

Abstract
Combustion and air-pollution aerosol particles often contain a substantial mass fraction of carbon. In biomass or residual-fuel smoke, this carbon may span a continuum of molecular sizes and physical properties, from macromolecular black carbon (BC) and tarballs to smaller molecules of organic particulate matter (OM). The quantification of these materials presents a metrological challenge which rapid temperature programmed oxidation instruments (RTPOs) may address. RTPOs collect particles on filters, which are then rapidly heated (> 700 K/min) in ambient or synthetic air while CO2 in the emitted gases is quantified either with (e.g. the “FATCAT” instrument) or without (e.g., “TCA08”) first passing gases over an oxidation catalyst. Both RTPOs monitor CO2 concentrations in real time to provide thermograms; both report total carbon mass by reference to baseline-subtracted CO2 thermograms. In this study, we investigated the response of these instruments to a variety of laboratory samples. Integrated carbon mass from the FATCAT and TCA08 agreed with one another, and with reference measurements, for both mature, fully graphitized soot (OC/TC < 0.1) and young, partially formed soot (OC/TC = 0.6 after denuding at 350 °C). However, due to its lack of an oxidation catalyst, the TCA08 CO2 measurements were Equation1(1)
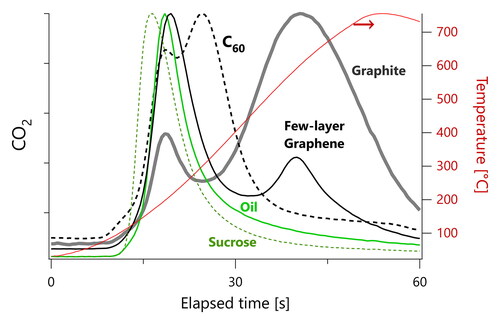
(1) 0-fold lower than reference measurements for two model OM compounds (dioctyl sebacate and sucrose). Since a previous atmospheric study has observed consistency between a TCA08 and a reference instrument, our data imply a large difference in the evaporation kinetics of these surrogates and atmospheric OM, as expected for highly-viscous (glassy) atmospheric OM. Finally, we discuss the thermograms of nebulized BC surrogates (C60, graphene, graphite), which showed two peaks at lower and higher temperatures, even after denuding at 350 °C.
Graphical Abstract
Editor:
Acknowledgements
This article is dedicated to our late colleague Daniel Clavel, who, in his own words, “thoroughly enjoyed” obtaining the measurements. We are grateful to Pacwill Environmental (Canada) for the loan of the TCA08, Aerosol d.o.o. (Slovenia) for technical support for the TCA08, and Alejandro Keller (University of Northwestern Switzerland) for the loan and for technical support of the FATCAT. We thank Brett Smith (National Research Council Canada) for technical assistance.
Author contributions
Conceptualization – JCC; Investigation – DC, JCC; Formal analysis – DC, JCC; Methodology – JCC, DC, GJS; Writing original draft – JCC; Writing review and editing – JCC, GJS.
Disclosure statement
No potential conflict of interest was reported by the authors.
Notes
1 We obtained these EC/TC values, and the distributions plotted in our , by re-analyzing the data published in of Rigler et al. (Citation2020). In Figure 6, we calculated the soot mass fraction using an EC/soot ratio of 0.9, representing the mass fraction of carbon in soot (Corbin et al., Equation2(2)
(2) 020) and an OM/OC ratio of Equation1
(1)
(1) .8 (calculated using the data of Rigler et al. Citation2020).