
Abstract
Objective
To investigate interrater and intrarater agreement between physicians and medical students on heart sound classification from audio recordings, and factors predicting agreement with a reference classification.
Design
Intra- and interrater agreement study.
Subjects
Seventeen GPs and eight cardiologists from Norway and the Netherlands, eight medical students from Norway.
Main outcome measures
Proportion of agreement and kappa coefficients for intrarater agreement and agreement with a reference classification.
Results
The proportion of intrarater agreement on the presence of any murmur was 83% on average, with a median kappa of 0.64 (range k = 0.09–0.86) for all raters, and 0.65, 0.69, and 0.61 for GPs, cardiologist, and medical students, respectively.
The proportion of agreement with the reference on any murmur was 81% on average, with a median kappa of 0.67 (range 0.29–0.90) for all raters, and 0.65, 0.69, and 0.51 for GPs, cardiologists, and medical students, respectively.
Distinct murmur, more than five years of clinical practice, and cardiology specialty were most strongly associated with the agreement, with ORs of 2.41 (95% CI 1.63–3.58), 2.19 (1.58–3.04), and 2.53 (1.46–4.41), respectively.
Conclusion
We observed fair but variable agreement with a reference on heart murmurs, and physician experience and specialty, as well as murmur intensity, were the factors most strongly associated with agreement.
Heart auscultation is the main physical examination of the heart, but we lack knowledge of inter- and intrarater agreement on heart sounds.
• Physicians identified heart murmurs from heart sound recordings fairly reliably compared with a reference classification, and with fair intrarater agreement.
• Both intrarater agreement and agreement with the reference showed considerable variation between doctors
• Murmur intensity, more than five years in clinical practice, and cardiology specialty were most strongly linked to agreement with the reference.
Key points:
Introduction
Heart auscultation is a cornerstone of the clinical approach to the cardiac patient, and particularly for the detection of heart murmurs. Murmurs can be heard when there is turbulent blood flow across abnormal heart valves (valvular heart disease (VHD)), septal defects, or outflow obstructions [Citation1]. Echocardiography is the gold standard for the detection of VHD [Citation2], but it is a resource-intensive examination usually performed in secondary care units. Heart auscultation is a quick and inexpensive examination when suspecting VHD, only requiring a stethoscope, and many patients with undiagnosed VHD initially present to primary care and are examined by a GP.
Valvular heart disease is associated with significant morbidity and mortality and contributes to a major reduction in health [Citation3–5]. VHD might affect all four heart valves, and of particular clinical importance is CAVD (calcific aortic valve disease) which comprises a range of pathologies, from aortic sclerosis to hemodynamically significant aortic stenosis (AS). The prevalence of CAVD increases with age, with an age-standardized prevalence in high-income countries above 200 per 100,000 [5]. Moderate and severe AS are associated with increased 5-year mortality of 56% and 67% respectively [Citation6]. For patients with asymptomatic AS or successful surgery for AS, there is no evidence of increased mortality compared to the normal population [Citation7].
Heart auscultation faces several challenges to remain a relevant examination, as studies suggest that it has a high interobserver (interrater) variation [Citation8] and that clinical examination skills are declining [Citation9,Citation10]. When determining the usefulness of heart auscultation for the diagnosis of VHD, intra- and interrater agreement need to be assessed [Citation11]. There are few studies examining such intra- and interrater agreement, and the existing studies include few raters.
The goal of this study was to describe intra- and interrater agreement between general practitioners, cardiologists, and 6th-year medical students on the classification of heart sound recordings, and to identify factors that are related to differences in agreement.
Method
Recording of heart sounds
We collected heart sound recordings during the Tromsø-7 study performed in 2015–2016. All inhabitants of the municipality of Tromsø in Northern Norway, ≥40 years of age received a postal invitation to participate in the first of two visits (n = 32591). The attendance rate of the first visit was 65% (n = 21 083), and 9235 participants were invited to a second visit, where 90.2% attended (n = 8 346). On the second visit, we recorded heart sounds from 2409 participants and echocardiography from 2340 participants. A total of 2132 participants had both echocardiography and their heart sounds recorded. Recordings from the first 200 of the 2132 participants to be classified were included in this project, resulting in a total of 800 heart sound recordings available.
Heart sounds were recorded from 4 different locations: the aortic area (located at the 2nd intercostal space at the right sternal border), the pulmonic area (2nd intercostal space at the left sternal border), the tricuspid area (4th intercostal space at the left sternal border), and mitral area (5th intercostal space in the left mid-clavicular line). All participants were seated at least 3 minutes before the recordings to normalize heart- and respiratory rates. They were allowed to breathe slowly during the recording session, and the duration of each recording was 10 seconds.
We used an analog stethoscope (Littmann Classic II, 3 M Company, Maplewood, Minnesota, U.S.) and cut the tube 10 centimeters from the chest piece. At the end of the tube, opposite to the chest piece, we inserted a microphone (MKE 2-EW, Sennheiser electronic GmbH, Wedemark, Germany) which was connected to a wireless microphone system (EW 112-P G3-G from the same producer). The receiver transmitted the sound through an external sound card (Scarlett 2i2, Focusrite Audio Engineering Ltd., High Wycombe, UK) to a computer running personalized software that could label the sounds with participant ID and recording site. This program would allow us to start the recording with a wireless control (R700, Logitech Europe S.A., Lausanne, Switzerland). The recordings stopped automatically after 10 seconds, and the audio files were saved in ‘.wav’ format. We used Adobe Audition CS6 software for audio playback with a presentation of audio spectrograms, and the classification database was created using Microsoft Access.
Reference classification
We created a 3-step process to produce a reference classification which included 3 GPs (SA, AD, HM) and a cardiologist (HS), and all four were blinded for echocardiography findings and other test results reported in the Tromsø-7 study. In the first step, all four physicians classified the first 400 recordings, where any disagreement was discussed to reach a consensus. The second step involved the GP specialist with 2 years of cardiology training (AD) and the GP in training (SA) who separately made an initial classification of all 800 recordings. The third step involved discussing disagreement from step 2 with the GP professor (HM) and a cardiology professor (HS) to reach a final consensus, which was determined by a majority vote.
The recordings were classified as ‘normal’, ‘systolic murmur’ or ‘diastolic murmur’, where the intensity was graded on a scale from 1 to 6. This scale was chosen to reflect the Levine scale, which is commonly referred to in clinical practice, even if it is not representative from grade 4 and up on recordings, as it includes physical properties of the murmurs, such as a palpable ‘thrill’, and hearing a murmur without the stethoscope touching the chest [Citation12]. Due to this limitation, the murmurs were grouped according to intensity where grade 1–2 were ‘faint’ and grades 3–6 were ‘distinct’.
We used the randomizer tool from random.org [Citation13] to select 40 from the 800 classified recordings, aiming at a 50/50 mix of recordings with murmurs and normal heart sounds. In a few cases with recordings of very poor technical quality, a substitute recording with similar classified heart sounds was randomly selected. Due to the limited sample size of recordings with diastolic heart sound, two of these recordings are from the same participant, but from different auscultation sites. The 40 selected recordings were thus from 39 participants with a median age of 64.5 years (range 40–83 years), where 51.3% were women.
The final set of 40 heart sounds were classified again after the selection, resulting in a change where one normal sound was reclassified as faint systolic murmur, and one faint systolic murmur was reclassified as distinct systolic murmur. Thus, the reference was made up of 19 recordings with normal heart sounds, 4 with diastolic murmurs, 8 with faint systolic murmurs, and 9 with distinct systolic murmurs
Classification by observers
All raters were recruited by convenience sampling among final-year medical students at UiT The Arctic University of Norway and through the network of the General Practice Research Unit at UiT. The 34 raters include 8 medical students from UiT, 9 cardiology consultants/registrars, and 17 GPs. Four of the cardiologists and 3 of the GPs were from the Netherlands, the rest were from Norway. See for rater characteristics.
Table 1. Characteristics of the 34 raters who classified the heart sound recordings.
We arranged meetings with groups of 3 and 4 raters who listened to, and classified, the 40 heart sound recordings. Each meeting consisted of two sessions lasting in total around 1 hour, including a 5–10-minute break between the sessions. The 40 recordings were played twice in succession and in a different order each session. The raters were not allowed to communicate with each other during the sessions.
The heart sound recordings were presented for the raters by running Adobe Audition CS6 for audio playback, and each rater used Sennheiser HDR 160 wireless headphones connected to a Sennheiser TR 160 transmitter. On an Apple iPad, the raters registered their answers in Google forms. We obtained complete registrations from 32 raters in session 1 and from all 34 raters in session 2. We lost two session 1 registrations due to technical errors, one from a cardiologist, and one from a GP.
Data analysis
For the statistical analysis, we used the software ‘R’ version 1.4.1717 running statistical packages to calculate kappa statistics and perform regression analysis [Citation14–17]. We calculated the mean proportion of agreement with the reference classification, meaning the percentage of answers agreeing with the reference, on ‘any murmur’ (not differentiating between systolic and diastolic murmurs) and on the level of normal/systolic murmur/diastolic murmur. We also calculated Cohen’s kappa coefficients to determine intrarater agreement on any murmur, using answers from sessions 1 and 2 for each rater, and agreement with the reference using session 2 for each rater. Fleiss kappa was used to calculate the interrater agreement within each specialty group using session 2 data. We also calculated the correlation between the intrarater kappa and the kappa for agreement with the reference. The significance of differences between groups were evaluated by the Mann-Whitney-U test.
We applied univariate and multivariable regression analysis to determine the association between the rater characteristics and agreement with the reference. We aggregated the 40 classifications of the 34 raters to a single dataset of 1360 observations, and agreement was defined as identical to the reference on the level of ‘normal/systolic/diastolic murmur’. The P values were corrected due to the clustering of the dataset by using robust standard errors. To obtain a final model of the significant rater characteristics, we ran a backward-forward stepwise multivariable logistic regression analysis with an alpha level of 0.05.
Guidelines for Reporting Reliability and Agreement Studies (GRRAS) were followed [Citation18].
Results
Intrarater agreement
Intrarater agreement was calculated among the 32 raters who completed both sessions. The mean proportion of intrarater agreement for any murmur (without differentiating between systolic and diastolic) was 83%, and with little difference between the three rater groups, 81%, 84%, and 83% for GPs, cardiologists, and students, respectively. The median intrarater kappa was moderate at 0.64 (range 0.09–0.86) for all raters, 0.65 (range 0.09–0.86) for GPs, 0.69 (range 0.43–0.80) for cardiologists, and 0.61 (range 0.41–0.85) for medical students.
Interrater agreement
Interrater agreement on any murmur was k = 0.46 (95% CI 0.34–0.59) for GPs, 0.58 (95% CI 0.48–0.68) for cardiologists, and 0.47 (95% CI 0.32–0.61) for medical students.
Agreement with the reference classification
The mean proportion of agreement with the reference when classifying for any murmur was 81% for all raters and 81%, 84%, and 79% for GPs, cardiologists, and students, respectively (). The corresponding median kappa values were 0.67 (range 0.29–0.90) for all raters, 0.65 (range 0.29–0.90) for GPs, 0.69 (range 0.29–0.89) for cardiologists, and 0.51 (range 0.36–0.85) for medical students (). The differences between the groups did not reach statistical significance.
Figure 1. Kappa values for agreement with the reference on the presence of murmur for each rater. Each point represents individual raters.
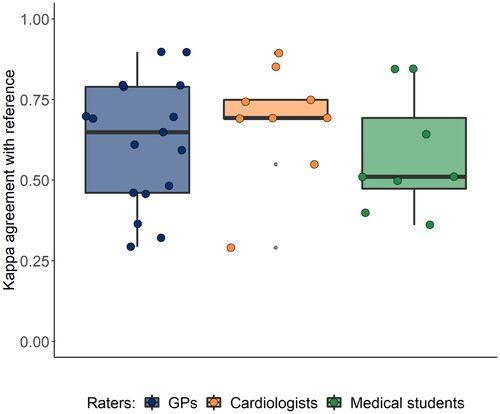
Figure 2. Scatter plot showing correlation of the Kappa values between intrarater agreement on the x-axis and agreement with the reference classification on the y-axis.
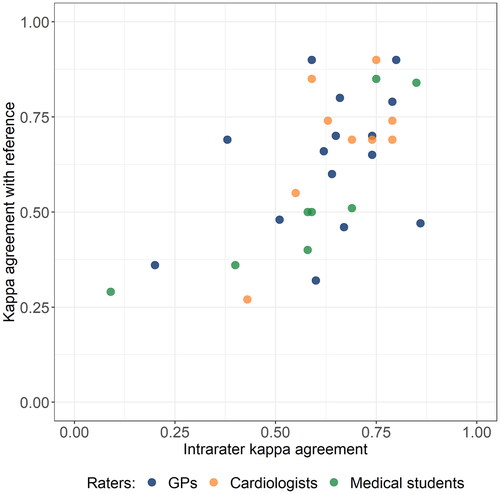
The kappa values for agreement with the reference showed great variation within each rater group. This variation correlated significantly with the variation in intrarater agreement, with r = 0.61 (95% CI 0.33–0.79).
In the univariate logistic regression analysis, the four variables ‘more than five years of clinical practice’, ‘distinct vs faint murmur’, ‘GP vs medical student’, and ‘cardiologist vs medical student’ significantly predicted agreement with the reference. These four variables were included in a multivariable regression analysis, and we found ORs ranging from 1.22 to 2.53, where all but ‘GP vs medical student’ significantly predicted agreement with the reference (). We corrected the P values using robust standard error, which remained statistically significant.
Table 2. Predictors of agreement with the reference classification, multivariable logistic regression analysis.
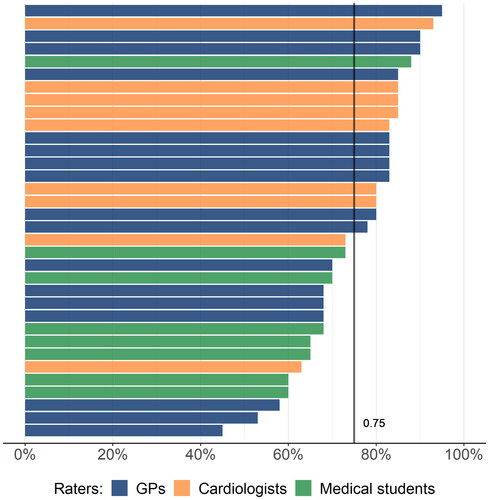
The proportion of agreement with the reference when classifying on the level of systolic/diastolic/normal was on average 75% for all raters, but with substantial variation between individuals, both between specialties and within specialty groups. The mean proportion of agreement on this level of classification was 75% (range 45%–95%), 81% (range 63%–93%) and 68% (range 60%–88%) for GPs, cardiologists, and medical students, respectively (). The difference between medical students and cardiologists were statistically significant (p = 0.03).
Figure 3. The proportion of agreement with the reference classification for each rater, on the level of ‘systolic/diastolic/normal’. The vertical line shows the overall mean proportion of agreement at 75%.
Discussion
In this study, we found that most physicians could identify heart murmurs from heart sound recordings in fair agreement with the reference classification, and usually agreeing with themselves when classifying a second time. However, the intrarater agreement varied considerably and showed a strong correlation with the agreement with the reference. Cases with distinct murmurs, more than five years of clinical practice, and cardiology specialty predicted the agreement with the reference.
Strengths and limitations
Through convenient sampling, we have included raters from relevant settings including university hospitals (cardiologists and students) and GP offices, representing a greater variety of stethoscope users than in other similar studies. However, the selection of raters did not secure representativity, and this could have been compensated for by including more raters. Rating heart sound recordings is different from describing heart sounds in a real clinical setting, and the commonly used Levine scale for grading murmurs uses the physical properties of the murmurs from grades 4 to 6 which are lost on recordings alone.
It is a strength of the study that we have assessed how agreement with reference was associated with intrarater agreement, and how agreement with the reference could be predicted. The reference classification was rigorously developed over several sessions by four experienced clinicians, and the use of an audio spectrogram during the classification has probably contributed to increased quality [Citation19].
Relations to other studies
We found only one study describing intrarater agreement on heart auscultation in adults, which reported an intrarater kappa of 0.58 for a single cardiologist when the classification of heart sounds from tape was compared with traditional auscultation face-to-face [Citation20].
Most studies on this topic are on tele-auscultation and with pediatric patients.
A study with 4 raters evaluating the identification of murmurs in heart sound recordings from 47 children found an intrarater kappa of 0.87, and a mean interrater kappa of 0.81 [Citation21]. These high agreements might indicate that murmurs are more easily recognized in children than in adults. A study including 5 cardiologists found an interrater k = 0.48 when examining 100 patients, with a simple agreement of 70% [Citation22]. This is similar to the interrater agreement found in our study.
Several studies indicate that auscultation proficiency is declining and suggest that the proficiency continues to decline after years in practice [Citation23]. However, our findings suggest that the recognition of a present heart murmur increases with experience, and we observed a linear relationship, suggesting that more experienced physicians had a higher agreement with the reference. This might, however, be due to a ‘cohort effect’, where older doctors educated several years ago could have received more comprehensive training in medical school when heart auscultation were more strongly emphasized.
Implications of our findings
The agreement with the reference varied considerably among the raters. There was a clear tendency that raters who had a low agreement with the reference also had low intrarater agreement (), which might indicate lower heart auscultation proficiency. Poor reliability, as determined by interrater and intrarater agreement, undermines the predictive value of clinical examinations [Citation11,Citation24]. The agreements found in this study cannot be categorized as poor, but anyway affects the usefulness of heart auscultation for identifying valvular heart disease. A recent study found the presence of an audible murmur to have limited accuracy for the detection of VHD [Citation25], suggesting that easy access to echocardiography for patients with symptoms is a better diagnostic strategy. Echocardiography has been touted as the natural next step in heart diagnostics in primary care, and comprehensive training in point of care ultrasound has been recommended [Citation26].
However, ultrasound and heart auscultation are not mutually exclusive. Clear benefits of detecting asymptomatic patients for timely intervention still suggest that efforts should be made to identify these individuals in primary care, where the stethoscope presently is much more available than ultrasound [Citation7]. To defend heart auscultation as a cornerstone of clinical examination in the future, efforts are needed to provide better education and medical doctor proficiency regarding the identification and description of heart murmurs. There is also a point to be made about the development of smart stethoscopes which use deep learning algorithms to provide heart sound evaluation. If proven to perform on expert human level or better, it might render human assessment unnecessary, and over time replace the traditional stethoscope [Citation27].
Ethics approval
This project was approved by the Regional Committee for Medical Research Ethics Northern Norway, REK North, in 2020, and by the Norwegian Centre for Research Data in 2021.
Acknowledgements
The work has been performed in the Department of Community Medicine, General Practice Research Unit, UiT The Arctic University of Norway. SA has been participating at the Norwegian Research School in General Practice. The collection of heart sounds was done by the Tromsø study, affiliated with the Faculty of Health Sciences at UiT, The Arctic University of Norway
Disclosure statement
No potential conflict of interest was reported by the author(s).
Additional information
Funding
References
- Innes JA, Dover A, Fairhurst K. Macleod’s clinical examination. 14th ed. Edinburgh (UK): Elsevier; 2018.
- Vahanian A, Beyersdorf F, Praz F, ESC/EACTS Scientific Document Group, et al. 2021 ESC/EACTS guidelines for the management of valvular heart disease. Eur Heart J. 2022;43(7):561–632.
- d‘Arcy JL, Prendergast BD, Chambers JB, et al. Valvular heart disease: the next cardiac epidemic. Heart. 2011;97(2):91–93.
- Coffey S, Roberts-Thomson R, Brown A, et al. Global epidemiology of valvular heart disease. Nat Rev Cardiol. 2021;18(12):853–864.
- Roth GA, Mensah GA, Johnson CO, GBD-NHLBI-JACC Global Burden of Cardiovascular Diseases Writing Group, et al. Global burden of cardiovascular diseases and risk factors, 1990-2019: update From the GBD 2019 study. J Am Coll Cardiol. 2020;76(25):2982–3021.
- Strange G, Stewart S, Celermajer D, National Echocardiography Database of Australia contributing sites, et al. Poor Long-Term survival in patients With moderate aortic stenosis. J Am Coll Cardiol. 2019;74(15):1851–1863.
- Eveborn GW, Schirmer H, Heggelund G, et al. The evolving epidemiology of valvular aortic stenosis. the tromso study. Heart. 2013;99(6):396–400.
- Iversen K, Sogaard Teisner A, Dalsgaard M, et al. Effect of teaching and type of stethoscope on cardiac auscultatory performance. Am Heart J. 2006;152(1):85 e1-7–85.e7.
- Lam MZ, Lee TJ, Boey PY, et al. Factors influencing cardiac auscultation proficiency in physician trainees. Singapore Med J. 2005;46(1):11–14.
- Mangione S, Nieman LZ, Gracely E, et al. The teaching and practice of cardiac auscultation during internal medicine and cardiology training. A nationwide survey. Ann Intern Med. 1993;119(1):47–54.
- Haynes RB. Clinical epidemiology: how To do clinical practice research. 3rd ed. Philadelphia, PA, USA: Lippincott Williams & Wilkins; 2006.
- Levine SA. Auscultation of the heart. Br Heart J. 1948;10(4):213–228.
- Haahr M. RANDOM.ORG: true random number service. 2022. https://www.random.org
- Vanbelle S. multiagree: comparaison of dependent kappa coefficients. 2019.
- Zeileis A, Köll S, Graham N. Various versatile variances: an Object-Oriented implementation of clustered covariances in R. J Stat Soft. 2020;95(1):1–36.
- Zeileis A. Econometric computing with HC and HAC covariance matrix estimators. J Stat Soft. 2004;11(10)1–7
- Zeileis A, Hothorn T. Diagnostic checking in regression relationships. R News. 2002;2(3):7–10.
- Kottner J, Audige L, Brorson S, et al. Guidelines for reporting reliability and agreement studies (GRRAS) were proposed. J Clin Epidemiol. 2011;64(1):96–106.
- Aviles-Solis JC, Storvoll I, Vanbelle S, et al. The use of spectrograms improves the classification of wheezes and crackles in an educational setting. Sci Rep. 2020;10(1):8461.
- Goethe Doualla F-C, Bediang G, Nganou-Gnindjio C, et al. A proof of concept of the contribution of tele-auscultation in the screening of heart disease: a cross sectional study. J Health Inform Africa. 2021;7(2):4–11.
- Lauritz Bredrup Dahl PH, Arild E, Hasvold T. May heart murmurs be assessed by telemedicine? J Norwegian Med Assoc. 2003;(123):3021–3023.
- Dobrow RJ, Calatayud JB, Abraham S, et al. A study of physician variation in Heart-Sound interpretation. Med Ann Dist Columbia. 1964;33:305–308 PASSIM.
- Vukanovic-Criley JM, Criley S, Warde CM, et al. Competency in cardiac examination skills in medical students, trainees, physicians, and faculty: a multicenter study. Arch Intern Med. 2006;166(6):610–616.
- Park JH, Kang TW, Choi J, et al. Radiographic prediction of lunate morphology in asians using plain radiographic and capitate-triquetrum distance analyses: reliability and compatibility with magnetic resonance arthrography (MRA) findings. BMC Musculoskelet Disord. 2019;20(1):128.
- Gardezi SKM, Myerson SG, Chambers J, et al. Cardiac auscultation poorly predicts the presence of valvular heart disease in asymptomatic primary care patients. Heart. 2018;104(22):1832–1835.
- Otto CM. Mind the gap: missed valve disease diagnosis. Heart. 2018;104(22):1810–1811.
- Chorba JS, Shapiro AM, Le L, et al. Deep learning algorithm for automated cardiac murmur detection via a digital stethoscope platform. J Am Heart Assoc. 2021;10(9):e019905.