
 ?Mathematical formulae have been encoded as MathML and are displayed in this HTML version using MathJax in order to improve their display. Uncheck the box to turn MathJax off. This feature requires Javascript. Click on a formula to zoom.
ABSTRACT
A new stand-level growth and yield model, consisting of component equations for stand volume, basal area, survival, and dominant stand height, was developed from a dataset of long-term trials for managed thinned and unthinned even-aged Norway spruce (Picea abies (L.) Karst.) forests in Norway. The developed models predict considerably faster growth rates than the existing Norwegian models. Further, it was found that the existing Norwegian stand-level models do not match the data from the thinning trails. The significance of thinning response functions indicated that thinning increases basal area growth while reducing competition related mortality. No significant effects of thinning were found in the dominant stand height growth. Model examination by means of cross-validation indicated that the models were unbiased and performed well within the data range. An application of the developed stand-level model highlights the potential use for these models in comparing different management scenarios.
KEYWORDS:
Introduction
Since the 1950s, a large portion of forested lands in Norway have been planted with pure stands of Norway spruce (Picea abies (L.) Karst.) and Norway spruce is by far the most economically important tree species responsible for app. 80% of annual cut. At present, as much as 60% of harvested forests in Norway are regenerated by planting Norway spruce (Granhus et al. Citation2016). More recently the conversion of low-density, low-productivity broadleaved stands to higher producing Norway spruce stands has been considered in Norway as a means to increase carbon sequestration (Søgaard et al. Citation2019). Given the importance of Norway spruce for the Norwegian forest sector, it is central to have tools that can be used to make informed decisions about Norway spruce management.
During the 1960s to1980s there was a strong emphasis on the development of whole-stand models in Norway (e.g. Tveite Citation1977; Braastad Citation1982; Blingsmo Citation1984). The increased computing power in the 1990s and the availability of the first remeasurement of the permanent sample plots in the Norwegian National Forest Inventory (NNFI) induced a shift of interest towards individual-tree models (e.g. Eid and Tuhus Citation2001; Andreassen and Tomter Citation2003; Bollandsås Citation2007; Bollandsås and Næsset Citation2009). While individual-tree models provide more detailed information, as compared to whole-stand models, they also require more detailed information to be used in growth and yield simulation. Alternatively, whole stand models require relatively less detailed information for simulation and can lead to smaller stand-level prediction errors (Vanclay Citation1994; Weiskittel et al. Citation2011). As the majority of forest inventories are carried out through the use of fixed or variable-radius plots, practical forest management planning in Norway is mainly performed at the stand level, as opposed to the individual-tree level (Eid Citation2001). Thus, there is still the need for reliable whole-stand models in the Norwegian forest sector.
The currently available stand-level forest planning and scenario tools in Norway are AVVIRK-2000 (Eid and Hobbelstad Citation2000) and GAYA-JLP (Hoen and Eid Citation1990; Lappi Citation1992; Hoen and Gobakken Citation1997). The core of the growth model used in these planning and scenario tools consist of functions for quadratic mean diameter increment (Blingsmo Citation1984), height-development (Strand and Braastad Citation1967; Tveite Citation1976, Citation1977) and mortality (Braastad Citation1982). More recent developments of stand-level models include functions for stand-level volume (Næsset and Tveite Citation1999), mortality (Eid and Øyen Citation2003), height-development (Sharma et al. Citation2011), and prediction equations for quadratic mean diameter and trees per hectare (Eid Citation2001). Empirical models are generally only appropriate if they are applied within the range of data that was used for model development. The existing stand-level models in Norway are relatively old and their fitting data are even older. Since, in general, empirical models are only appropriate within the range of data that was used for model development, it is questionable if they represent the current growing conditions (climate) and management practices as needed.
Historically, low pulpwood values along with high costs of thinning operations have resulted in relatively low thinning intensity (no thinning or one late thinning) in spruce forests in Norway. However, recent increases in pulpwood prices and an improved demand for timber have resulted in increased interest in thinning of Norway spruce. The existing Norwegian stand-level models for even-aged spruce stands do not explicitly model differences in growth following thinning (no thinning response). It is widely accepted that there is a thinning response in Norway spruce and results from thinning trials of Norway spruce in Sweden and Finland have shown that thinning influences basal area growth and survival (Mäkinen and Isomäki Citation2004; Nilsson et al. Citation2010). Thus, not explicitly representing the thinning response in basal area growth and survival can lead to biased estimates of future density and volume. The lack of thinning effects in the current stand-level growth and yield models used in Norway suggests a gap in the tools necessary for determining optimal stand-level management strategies. Improved models that include a thinning response will provide forest managers with a better tool for planning stand level management of Norway spruce.
The objective of this study was to develop a stand-level model for forecasting growth and yield of thinned and unthinned Norway spruce stands. As such, data from long term thinning trials were used to develop a system of stand-level equations for predicting stand volume, basal area, survival, and dominant height. Comparisons of growth and yield projections among the new models developed here and the most recent stand-level models were made to show the improvements of the functions. Further, the model behavior is illustrated and used to examine the interactions of the models and effects of thinning on stand-development.
Materials and methods
Data
The data used in this study consists of a series of silvicultural trials with 94 unthinned and 135 thinned permanent sample plots, ranging from 0.4–0.6 hectares in size, established in even-aged planted Norway spruce stands. Establishment of the trials occurred between 1969 and 1976 in stands aged 20–31 years. Plot measurements were scheduled in five-year intervals, with a few deviations from the schedule, and to date each plot has received between 5 and 10 measurements. Within these data are 311, 442, and 246 growth observations in unthinned, once thinned stands, and twice thinned stands, respectively (). The trials are distributed across the natural range of Norway spruce in Norway, ranging from 58 to 67 degrees in latitude. The full range of the sample plot data are presented in . A summary of these trials has been previously provided by Braastad and Tveite (Citation2001).
Figure 1. Distribution of Norway spruce sample plots across Norway.
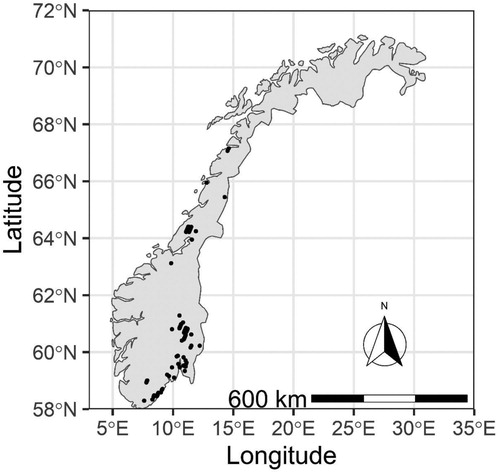
Table 1. Descriptive statistics of thinned and unthinned Norway spruce data.
The trails were established to examine the effects of thinning from below with focus on thinning intensity and timing of thinning on volume production and stand structure. Initially, the trials were planned to include treatments of different density reductions at different stages of stand development. Treatments included one to three thinnings from below with different combinations of target residual trees per hectare (TPH) of 2070, 1600, 1100, and 800 at stand dominant heights of 8, 12, 16, and 20 meters. Over the course of the experiment, the target residual TPH were often missed (thinning too light or too heavy) and/or the timing of thinning was performed too early or late. Further the experimental design lacked replication. The deviation from the experimental design restricts the examination of treatment groups but fortunately has resulted in a dataset which covers a wide range of thinning intensities and is highly useful for the development of models which explain growth response to thinning.
At plot establishment, every tree greater than 5 cm in diameter at breast height (dbh) was numbered and the species, dbh, and any damages were recorded. Total tree heights and crown heights were subsampled by randomly selecting one tree out of the first four trees for a height measurement, and then systematically sampling the height of every fourth tree thereafter. Non-sampled tree heights were estimated with a linear mixed-effects variant of the logarithmic height-diameter model of Lenhart (Citation1968) localized with random parameters fit to each trial, plot, and measurement period. Total stem volumes were calculated using the volume equations of Vestjordet (Citation1967). In-growth trees were included in plot measurements once reaching a dbh of 5 cm.
Model development
The whole-stand growth and yield model is comprised of individual equations for stand volume, basal area, survival, and dominant stand height. During the model development stage, multiple models for each stand component from the literature were compared to determine the best final model. In all cases, the Bayesian Information Criterion (BIC) was used in order to compare non-linear models with varying numbers of parameters (Claeskens and Hjort Citation2008). A list of variable names and definitions used in the following modeling framework is provided in . Further, a flow chart of the model application is provided in .
Figure 2. Description of the model application in the new stand-level model. Numbers in brackets corresponds to the equations presented in the text.
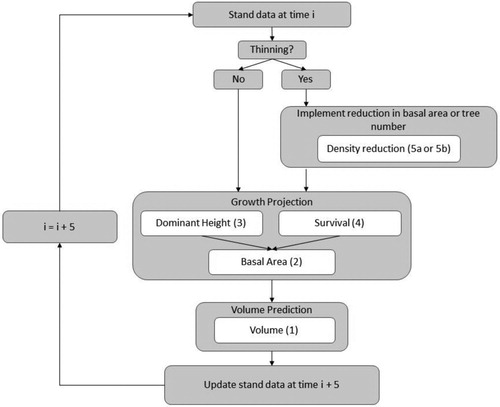
Table 2. Definitions of variables and their abbreviations used in this work.
Volume: For predicting stand-level volume, a non-linear version of the Schumacher (Citation1939) volume equation was developed:(1)
(1) where
are parameters to be estimated. Additional variables which described thinning response were initially included but none were significant in the final model and no patterns in the residuals were detected between thinned an unthinned stands. Predictions of future basal area (G2) and future height (H2) are needed for predicting volume with Equation (1).
Basal Area: Projection of stand basal area was modeled using a modified version of the equation of Hasenauer et al. (Citation1997):(2)
(2)
The thinning response function (TR) is defined as:
This thinning response function allows for an increase in basal area growth following thinning for a period, but with time the basal area growth returns to that of the unthinned stand (Hasenauer et al. Citation1997). In addition to predictions of future dominant stand height (H2), predictions of future trees per hectare (N2) is also needed for predicting basal area with Equation (2).
Survival: Multiple stand-level survival models based on Zhao et al. (Citation2007), with the inclusion of a thinning effect, were tested. The final best fitting model, similar to that of Gyawali and Burkhart (Citation2014), was:(3)
(3)
Dominant Height: Stand height projection was modeled using a GADA formulation of the Chapman-Richards type height-age model (Cieszewski and Bailey Citation2000). Multiple model forms from Diéguez-Aranda et al. (Citation2005) were tested, with the following model providing the best fit:(4)
(4) where
Tree reduction: Thinning treatments are often specified as a reduction in either tree number or basal area. In the case that one of these variables is known following thinning and the other is not, for example under simulation studies, it will be necessary to predict the reduction in the other. To predict the number of trees remaining after a thinning when the reduction in basal area after thinning is known, the following model was developed:(5a)
(5a)
In the case that the number of trees following thinning is known and the basal area following thinning is unknown then Equation (5) can be solved to determine the reduction in basal area as:(5b)
(5b)
Model fitting and validation
Equations (1–5) were fit using non-linear seemingly unrelated regression using the “systemfit” package (Henningsen and Hamann Citation2007) in the open source statistical software R version 3.6.1 (R Core Team Citation2019). Seemingly unrelated regression accounts for the contemporaneous correlations among different regression equations and has been widely used in the development of growth and yield models (Furnival and Wilson Citation1971; Borders Citation1989; Robinson Citation2004; Coble Citation2009; Zhao et al. Citation2015). The system of equations was fit to the trial data () as a growth series over each measurement period (5-year intervals). The growth series was constructed by considering all measurement intervals in succession. For example, for a plot with one initial measurement and two additional re-measurements, two growth periods were constructed.
The goodness of fit of all component equations of the whole-stand model was evaluated using four fit statistics: the mean residual (E), the mean of the absolute values of the residuals (MAE), root mean square error (RMSE), and the coefficient of determination (R2). These four criteria can be expressed mathematically as:(6)
(6)
(7)
(7)
(8)
(8)
(9)
(9) where
,
, and
represent the observed, predicted, and mean values of each component, respectively, and n represents the number of observations.
Model validation was performed using two-fold cross-validation. The trial data were randomly split into two datasets roughly equal in number of observations, one validation and one fitting dataset. Equations (1–5) were fitted to the fitting dataset and then the validation dataset was used to calculated summary statistics (Equations 6–9) for the validation. A similar validation approach using Leave-one-out (LOO) cross-validation was also performed but provided similar fit statistics as the two-fold cross-validation. Since the LOO validation did not provide additional information those results are not shown.
Table 3. Stand data for four selected unthinned Norway spruce plots.
Model comparison
To show the improvements of the new model, Equations (1–4), comparisons were made against the most recent existing functions for each of the respective components. Stand volume and mortality were compared with the functions of Næsset and Tveite (Citation1999) and Eid and Øyen (Citation2003), respectively. As there is no existing stand-level basal area growth equation for Norway spruce in Norway, the implied future quadratic mean diameter (QMD2, cm) as calculated from predictions of G2 and N2 using Equations (2) and (3) where compared to the predictions of QMD2 using the function of Blingsmo (Citation1984). Each of the component equations were evaluated based on residual analysis and fit statistics from Equations (6–9).
Lastly, height-age relationships from Equation (4) were compared to those predicted from the site index function of Tveite (Citation1977) and the height-age model of Sharma et al. (Citation2011). As Equation (4) was based on age from planting, the site index curves produced from the functions of Tveite (Citation1977) and Sharma et al. (Citation2011) were adjusted to reflect the age from planting, instead of the age from which most trees reach 1.3 m in height, using age correction factors published in Søgaard et al. (Citation2019).
Stand development in thinned and unthinned stands as implied by the models was examined by simulating forest growth under different stand productivities and three different thinning scenarios. One measurement from each of four plots from the fitting dataset, representing site indices of 11, 14, 17, and 20 m, where selected to demonstrate each component model (). Growth for each stand in was simulated in 5-year time steps according to the work flow presented in . The thinning scenarios examined were based on representative thinning treatments performed in the thinning trial data and included an unthinned scenario, a one-thinning scenario where 25% basal area is removed at a stand dominant height of 12 m, and a two-thinning scenario where 25% basal area is removed once at a stand dominant height of 12 m and then a second time at a stand dominant height of 16 m. All figures were generated using the ggplot2 package in R (Wickham Citation2009).
Table 4. Parameter estimates (standard errors) and fit statistics for Equations (1–5).
Results
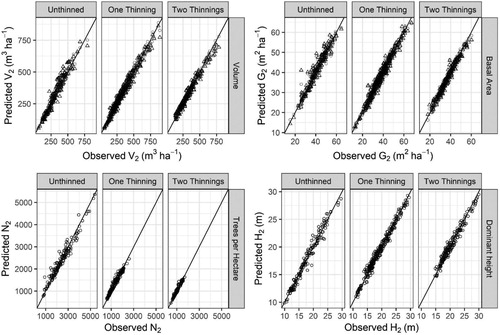
Parameter estimates and fit statistics for Equations (1–5) are presented in . Estimated parameters for all equations were significant at the α = 0.01 level. When comparing the observed vs predicted values for each component in Equations (1–4) no obvious bias was seen () and further residual analysis (results not shown) indicated no obvious bias with stand age, site quality, degree of thinning, altitude, or latitude. Further, when estimated values of N2 and H2 were used in the prediction of G2 and then estimates of H2 and G2 in the prediction of V2, no bias was seen in the model predictions (). Fit statistics for the total dataset and for the two-fold cross-validation indicated that the models fit well and explained a large portion of the variation, with R2 values greater than 0.96 for Equations (1–4) and greater than 0.84 for Equation (5) ().
Figure 3. Observed versus predicted values for future Volume (V2), basal area (G2), trees per hectare (N2), and dominant stand height (H2) based on predictions from Equations 1–4 with parameter values from . Residuals are based on direct predictions from observations (circles) and, in the case of G2 and V2, include predictions from the necessary model components (triangles).
Dominant height projection
In the model development stage, the effect of thinning on height development was examined using indicator variables and thinning response variables. In no case were any parameters which including a thinning effect significant. Further, there was no obvious bias in dominant height projection when no thinning effects were included in the model. These results suggest that thinning from below does not significantly influence dominant height development in even-aged Norway spruce stands in Norway.
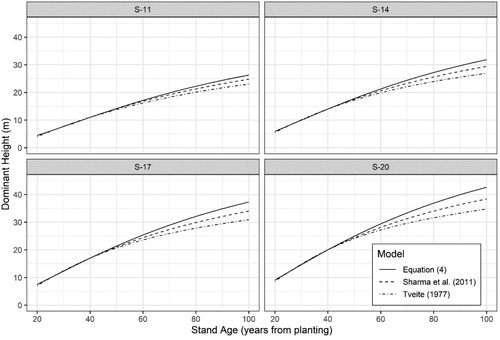
A comparison of height-age curves produced from Equation (4) and those produce by Tveite (Citation1977) and Sharma et al. (Citation2011) indicates differences in height development at older ages (). The curves of Tveite (Citation1977) tended towards lower heights at later ages, followed by the curves of Sharma et al. (Citation2011), as compared to the curves from Equation (4).
Figure 4. Comparison of site-index curves between the new Equation (4) and the equations of Tveite (Citation1977) and Sharma et al. (Citation2011).
Survival
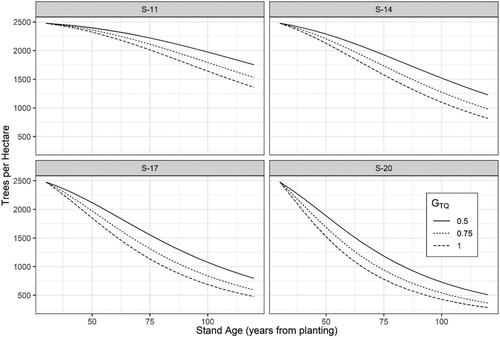
Parameters for site index and thinning response were significant in Equation (3) indicating that both stand productivity and degree of thinning effect future trees per hectare (N2) (). The effect of these two variables is shown in which depicts the development of N2 from a common starting value of 2500 trees per hectare under site indices 11, 14, 17, and 20 m and for different density removals as indicated by the ratio of basal area before and after thinning (GTQ). The models indicate that the mortality rate is greater in stands of higher productivity. Further, the mortality rate is generally less in thinned stands.
Figure 5. Development in number of trees per hectare for different site indices (m, base age 40 years) and different thinning intensities based on a common starting value of 2500 trees per hectare. The basal area thinning quotient (GTQ) is the ratio of basal area before and after thinning where a value of 1 indicates the unthinned stand condition.
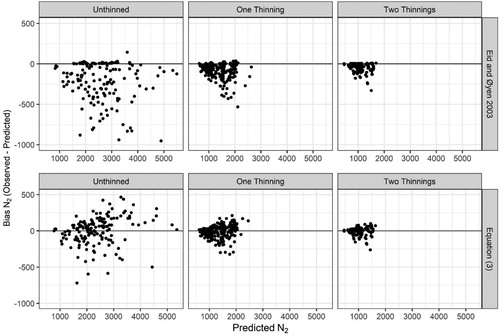
Comparisons of the residuals between Equation (3) and those produced from the function of Eid and Øyen (Citation2003) indicates the improvement of the new model (). For both thinned and unthinned treatments, the function of Eid and Øyen (Citation2003) over-predicted future N2 which indicates an underprediction in mortality. While, the variance explained by the model of Eid and Øyen (Citation2003) was high (R2 = 0.94), the mean error was −86.8 trees per hectare, indicating the obvious bias seen in .
Figure 6. Comparison of residuals for predicted future trees per hectare (N2) between the new survival function, Equation (3), and the survival function of Eid and Øyen (Citation2003).
Basal area and quadratic mean diameter
The significant parameter in the thinning response function (TR) in Equation (3) indicates that thinning positively influence basal area growth. Additional parameters to distinguish between one or two thinnings were also examined but none proved significant in the model. Further, no obvious bias was observed in the residuals between stands thinned once or twice (e.g. ).
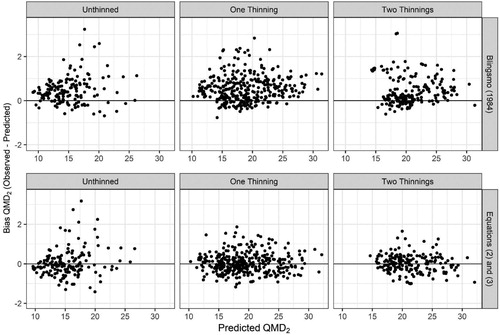
As there is no stand-level basal area growth model for thinned or unthinned stands of Norway spruce stands in Norway, comparisons were made against the current diameter growth model of Blingsmo (Citation1984). For this analysis the future quadratic mean diameter (QMD2) was calculated from predictions of future basal area (G2) and N2 using Equations (2) and (3). Comparisons of the residuals for QMD2 as calculated from the new models indicated an improvement over the function of Blingsmo (Citation1984) (). The diameter increment function of Blingsmo (Citation1984) tended to under-predict QMD2 whereas the implied QMD2 as calculated from Equations (2) and (3) was unbiased.
Figure 7. Comparison of residuals for future quadratic mean diameter (QMD2, cm) between the function of Blingsmo (Citation1984) and the implied QMD2 calculated from future basal area and trees per hectare as predicted from Equations (2) and (3), respectively.
Stand volume
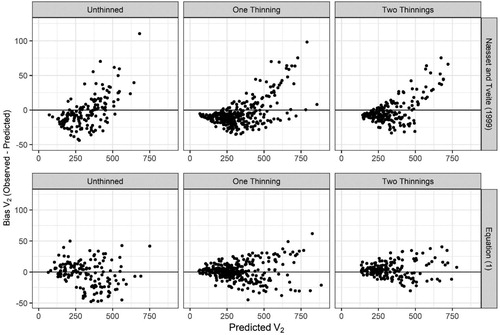
Equation (1) predicts stand-volume as a function of basal area, stand dominant height, and stand age. Inclusions of parameters which explain differences between thinned and unthinned stands were not significant and residuals indicated no obvious bias in thinned and unthinned stands. Thus, Equation (1) can be equally applied in both stand types. Comparisons of residuals indicated that Equation (1) is unbiased, whereas, the volume function of Næsset and Tveite (Citation1999) tended to over-predict volume when stand volumes were lower than 400 m3 ha−1 and then under-predict volume thereafter ().
Figure 8. Comparison of residuals for future volume (V2, m3 ha−1) as predicted from Næsset and Tveite (Citation1999) and from Equation (1).
Stand development
Based on the simulated stand growth from initial stand states (), the results indicate the different responses from site productivity and thinning treatment. As seen in , mortality is much higher on better-quality sites, gradually decreasing with decreasing site quality (). Such results are expected as better-quality sites will grow into the self-thinning range much faster than lower-quality sites. As there were no significant effects of thinning in Equation (4), dominant height development was the same for all three scenarios.
Figure 9. Development in future trees per hectare and basal area for four Norway spruce stands () representing different site indices (S-11, 14, 17, and 20 m) with three management scenarios including: Unthinned, one-thinning removing 25% of the basal area at a dominant stand height of 12 m, and two-thinnings removing 25% of the basal area at dominant stand heights of 12 and 16 m.
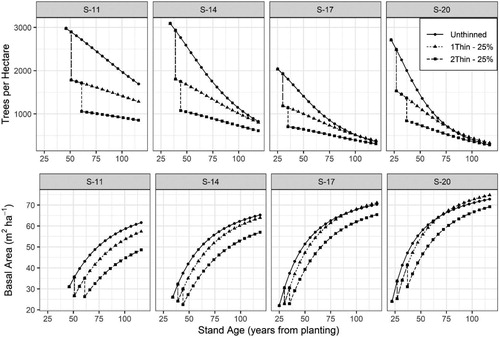
The effects of thinning on basal area development varied with site quality and thinning treatment. In the lowest site indices (S-11), one or two light thinnings (25%) did not result in a noticeable increase in basal area growth and by 120 years of age basal areas in the thinned scenarios remained well below the unthinned scenario. However, with increasing site quality the effect of thinning on basal area growth increased. The modeling results further indicate that thinned stands on good sites can potentially achieve a higher maximum basal area as compared to unthinned stands on good sites.
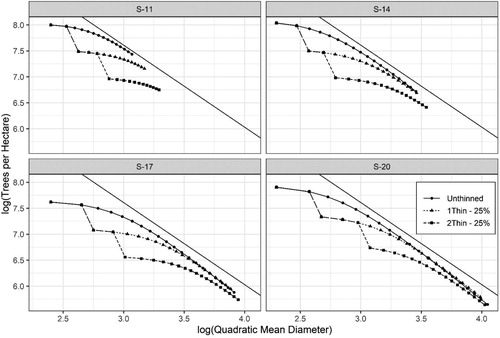
While maximum size-density relationships (MSDR) where not explicitly modeled for these data, the implied MSDRs can be examined by calculating the quadratic mean diameter (QMD, cm) from basal area and trees per hectare (N) and then relating N to QMD. In order to determine the MSDR line, the equation of Reineke (Citation1933) was fit to using the fitting data described in and was determined to be:where all variables are described as previously. Note the objective was not to determine the best fitting method for MSDRs but to produce a general MSDR line from which the implicit MSDRs in the stand models could be examined. indicates that the implied MSDRs from the basal area and survival models do coincide with the MSDRs observed in the fitting data.
Figure 10. Maximum size-density relationships for four Norway spruce stands () representing different site indices (S-11, 14, 17, and 20 m) with three management scenarios including: Unthinned, one-thinning removing 25% of the basal area at a dominant stand height of 12 m, and two-thinnings removing 25% of the basal area at dominant stand heights of 12 and 16 m.
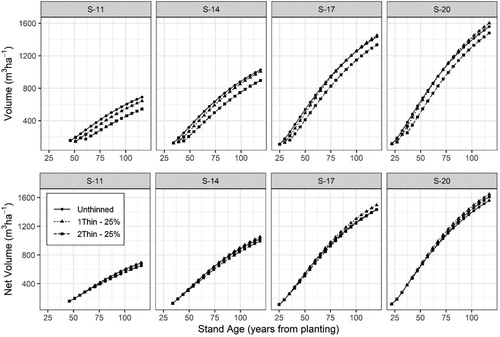
The lack of thinning response in basal area growth in site indices S-11 and S-14 resulted in less total standing volumes in the thinned scenarios as compared to the unthinned scenarios by 120 years of age (). However, in S-17 the unthinned and once thinned scenarios produced similar standing volumes by age 120 and in S-20 the once-thinned stand produced more standing volume. When comparing the total potential volume removed, net volume (standing plus removed volume) was similar among all three thinning scenarios in S-11 and S-14. Net volume in site indices S-17 and S-20 among the thinned scenarios surpassed the unthinned scenario at later ages.
Figure 11. Development of standing volume and net volume (standing + removed volume) for four Norway spruce stands () representing different site indices (S-11, 14, 17, and 20 m) with three management scenarios including: Unthinned, one-thinning removing 25% of the basal area at a dominant stand height of 12 m, and two-thinnings removing 25% of the basal area at dominant stand heights of 12 and 16 m.
Thinning also effects the current annual net volume increment (CAI, m3 ha−1 yr−1) with the effect dependent on site-productivity, the thinning treatment, and the amount of time since thinning. shows for these sample data () that, among the thinning scenarios examined here, thinning initially reduced the CAI in all site indices. In the lowest site indices (S-11) the CAI in the one-thinning scenario was able to converge to the CAI of the unthinned scenario after a short time, but CAI in the two-thinning scenario remained below that of the unthinned stand. With increasing site productivity, the effect of thinning had an increasingly favorable response on volume growth and the models indicate that in S-14, −17, and −20 thinning can result in increases CAI in thinned stands above that of the unthinned stand. Such a result indicates the higher net volume as seen in .
Figure 12. Comparison of current annual volume increment (CAI) and mean annual volume increment (MAI) stands of different site indices under three management scenarios: Unthinned, one-thinning removing 25% of the basal area at a dominant stand height of 12 m, and two-thinnings removing 25% of the basal area at dominant stand heights of 12 and 16 m.
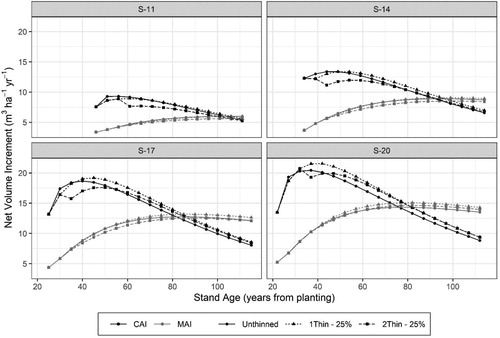
The rotation age as defined by the culmination of mean annual net volume increment (MAI) also varied depending on site productivity and degree of thinning. For site indices S-11, −14, and −17, MAI similarly culminated in thinned and unthinned stands at 5.5, 8.1, and 12.2 m3 ha−1 yr−1 for those site indices, respectfully. However, in S-20 MAI culminated at 12.7, 14.7 and 13.7 m3 ha−1 yr−1 for the unthinned, once-thinned, and twice thinned scenarios, respectfully. Harvesting ages according to maximum MAI were similar among thinned and unthinned stands in S-11 and S-14 but thinning increased the age of maximum MAI in S-17 and S-20 by 4–5 years.
Discussion
Forest management planning in Norway is generally conducted based on information at the stand-level (Eid Citation2001), as opposed to the individual-tree level, and reliable stand-level models are needed for forecasting current stand conditions under different management scenarios to make informed decisions about treatment schedules. To fill this need, new stand-level models were developed based on an extensive dataset of thinned and unthinned long-term permanent sample plots in managed even-aged Norway spruce stands.
It is noteworthy that the new models predict considerably faster growth and mortality rates than the equations of Blingsmo (Citation1984) and Eid and Øyen (Citation2003), respectively. The growth function of Blingsmo (Citation1984) tended to under predict future quadratic mean diameter while the survival function of Eid and Øyen (Citation2003) tended to over predict future trees per hectare (e.g. and ). Increased mortality rates are linked to increased growth rates as forest stands will grow into the range of distant-dependent mortality (self-thinning) faster. These changes in growth and survival can be primarily linked to differences in the underlying data sources used in model fitting. The data used in model fitting in this work () consist of managed Norway spruce stands comprised of newer genetics, whereas the previous models are developed primarily from un-managed, naturally regenerated stands.
The new dominant height projection equation (Equation 4) differs from previously developed models (e.g. Tveite Citation1977; Sharma and Brunner Citation2016) for Norway spruce in Norway as the stand age used in Equation (4) is the age from planting instead of the age at which the height of most trees in the stand reaches 1.3 m. The use of age from planting may be more practical for forest owners and managers as the age when most trees reach a height of 1.3 m is subjective and without consistent inventories must me estimated. Thus, the new dominant height model will be useful for projecting height development in Norway spruce plantations where the exact stand age from planting is known.
When compared against the existing height development equations of Tveite (Citation1977) and Sharma et al. (Citation2011) Equation (4) indicated greater height growth at later stand ages across a range of site indices, with larger differences occurring as site index increased (). One difference between these three models is the underlying data used in model fitting. Tveite (Citation1977) combined data from naturally regenerated forests, which covered ages of a general rotation in Norway spruce, and young planted stands where the average age was about 35 years. Thus, most of those data represent stands of different genetics, climate, and management. While Sharma et al. (Citation2011) used the same trial data used in this work (), with fewer measurements, they also incorporated data from the Norwegian National Forest Inventory where older aged stands are predominantly on sites of lower productivity (as indicated in their ). The inclusion of such data in the development of a height-age model, in addition to representing different genetics and management, could result in high-leverage on the asymptote resulting in the decreased height growth at later ages as seen in .
An application of the model is presented to illustrate the model behavior with four selected plots ( and ). This limited exercise is not an exhaustive study of the model behavior, but an example of how the new models can be used to evaluate different management options in even-aged Norway spruce stands. The comparisons of predicted future yields for the four selected plots indicated the potential for greater total harvested volume at later ages when stands are thinned. However, standing volumes of thinned stands in lower site indices did not surpass those of the unthinned stands, indicating lower final yields (). Further, modeling results indicate that thinning can potentially increase the rotation age, as defined by culmination of maximum MAI, depending on site quality and thinning treatment ().
Results from the new-models indicate that they are unbiased and provide better predictions for growth and yield of thinned an unthinned even-aged Norway spruce stands than the most current stand-level equations available (e.g. –). Additionally, a comparison of predictions of G2 with estimated values from Equations (3) and (4) and then predictions of V2 with estimated values from Equations (2) and (4) with observed values of G2 and V2, respectively, indicated that the new stand-level model was unbiased when used as a system (). The new equations indicate the need to explicitly account for degree of thinning in the stand-level model to account for changes in growth conditions following thinning. Overall the newly developed models shown quite different behaviors from the existing models and may result in deferent decisions about thinning scheduling and the optimal timing of final harvesting.
Equations (1–4) indicate that the primary differences in growth conditions between thinned and unthinned stands occur in basal area growth and survival. However, thinning does not influence dominant height growth. Further, an examination of the model behavior indicates that over a traditional rotation period, total net volume production is similar among thinned and unthinned scenarios (e.g. ). These results mirror results from analysis of thinning trials of Norway spruce in Sweden and Finland. For example, Mäkinen and Isomäki (Citation2004) concluded that thinning from below in Norway spruce stands in Finland significantly reduced natural mortality and increased diameter growth, while having no significant effect on dominant height growth. The authors show that over a 30-year period there was no significant difference in total net volume production between thinned and unthinned stands. In Sweden, Nilsson et al. (Citation2010) showed similar results in thinning trials of Norway spruce as those of Mäkinen and Isomäki (Citation2004). While the data used in this work is not sufficient for a similar analysis of thinning experiments as performed by Mäkinen and Isomäki (Citation2004) and Nilsson et al. (Citation2010), the modeling results indicate similar reactions to thinning from below in Norway spruce stands in Norway as compared to both Sweden and Finland.
The modeling approach used in this work to incorporate thinning response into the basal area equation differs from the current documented basal area equations used in the decision support systems in Sweden (Heureka) and Finland (MOTTI) which rely on categorical variables to adjust growth over different periods following thinning. For example, the basal area growth model presented in Elfving (Citation2010) incorporates two categorical variables which provide an increase in basal area growth over the period of 0–10 years following thinning and then a smaller increase over the period of 11–25 years following thinning, as compared to a stand with no thinning. A similar approach was used in the basal area growth model of Hynynen et al. (Citation2002), where a categorical variable provides an increase in growth over the period of 0–5 years following thinning as compared to the unthinned stand.
Equation (2) provides a more detailed response in basal area growth to thinning by the inclusion of a continuous thinning response function, as opposed to a discrete categorical variable. This thinning response function accounts for both the intensity of thinning, through the ratio of basal area before and after thinning, and relative time since thinning, expressed as the ratio of stand dominant height at the time of thinning to the future stand dominant height. By expressing time since thinning in this manner, site effects are also accounted for as the ratio between stand dominant height in the future and at thinning for a given period after thinning depends on site productivity.
The data used for the development of the new stand-level model presented in this work come from long-term thinning trials in managed even-aged Norway spruce stands aged 20–70 years. These trials are representative of well stocked stands with adequate control of deciduous competitors. Further, the thinning treatments were implemented mostly from below, removing trees from the lower portion of the diameter distribution. Thus, the models may not properly represent stand development in un-managed forests or in different thinning applications. While the models appear to extrapolate well, following the self-thinning line, some care should be used if applied to stands outside of the range of data used for model fitting.
In conclusion, the new equations for volume, basal area, survival, and dominant stand height developed in this work collectively provide a stand-level model from which growth and yield of managed thinned and unthinned even-aged Norway spruce stands can be forecasted. Further, the stand-level model can be used to compare potential gains or losses in total or net harvested volume from different thinning treatments. The model will prove useful to forest landowners, managers, or analysts for making management decisions in managed even-aged Norway spruce plantations. Further, when coupled with additional auxiliary models, the new stand-level model can provide the core for a decision support system in managed Norway spruce forests.
Acknowledgements
This work was partially supported by the Research Council of Norway through project 301745 (Maximizing the Resilience and Carbon Sequestration in Managed Norway Spruce Forests) and the Forest Growth and Yield Research Group at the Norwegian Institute of Bioeconomy Research. The authors are indebted to the many people who have been involved in collecting and maintain the data series used in this work.
Disclosure statement
No potential conflict of interest was reported by the author(s).
Additional information
Funding
References
- Andreassen K, Tomter SM. 2003. Basal area growth models for individual trees of Norway spruce, Scots pine, birch and other broadleaves in Norway. For Ecol Manag. 180(1):11–24. doi: 10.1016/S0378-1127(02)00560-1
- Blingsmo K. 1984. Diameter increment functions for stands of birch, Scots pine, and Norway spruce. Ås: Norwegian Forest Research Institute. Research Paper 7/84, 22 pp. ISSN 0333-001X.
- Bollandsås OM. 2007. Uneven-aged forestry in Norway: Inventory and management models. Ås: PhD thesis 2007:30, Department of Ecology and Natural Resource Management, Norwegian University of Life Sciences.
- Bollandsås OM, Næsset E. 2009. Weibull models for single-tree increment of Norway spruce, Scots pine, birch and other broadleaves in Norway. Scand J For Res. 24(1):54–66. doi: 10.1080/02827580802477875
- Borders BE. 1989. Systems of equations in forest stand modeling. For Sci. 35(2):548–556.
- Braastad H. 1982. Naturlig avgang i granbestand. Rapport fra Norsk Institutt for Skogforskning (Norway). Research Paper from Norwegian Forest Research Institute. no. 12/82.
- Braastad H, Tveite B. 2001. Thinning in spruce and pine stands: effect of thinning on volume production, average diameter, and the diameter of the largest 800 trees per hectare. Rapport fra skogforskningen. Ås: Norwegian Forest Resource Institute , 27p. Norwegian.
- Cieszewski CJ, Bailey RL. 2000. Generalized algebraic difference approach: theory based derivation of dynamic site equations with polymorphism and variable asymptotes. For Sci. 46(1):116–126.
- Claeskens G, Hjort NL. 2008. Model selection and model averaging. Cambridge: Cambridge University Press.
- Coble DW. 2009. A new whole-stand model for unmanaged loblolly and slash pine plantations in east Texas. South J Appl For. 33(2):69–76. doi: 10.1093/sjaf/33.2.69
- Diéguez-Aranda U, Burkhart HE, Rodríguez-Soalleiro R. 2005. Modeling dominant height growth of radiata pine (Pinus radiata D. Don) plantations in north-western Spain. For Ecol Manag. 215(1):271–284. doi: 10.1016/j.foreco.2005.05.015
- Eid T. 2001. Models for prediction of basal area mean diameter and number of trees for forest stands in south-eastern Norway. Scand J For Res. 16(5):467–479. doi: 10.1080/02827580152632865
- Eid T, Hobbelstad K. 2000. AVVIRK-2000: a large-scale forestry scenario model for long-term investment, income and harvest analyses. Scand J For Res. 15(4):472–482. doi: 10.1080/028275800750172736
- Eid T, Øyen BH. 2003. Models for prediction of mortality in even-aged forest. Scand J For Res. 18(1):64–77.
- Eid T, Tuhus E. 2001. Models for individual tree mortality in Norway. For Ecol Manag. 154(1):69–84. doi: 10.1016/S0378-1127(00)00634-4
- Elfving B. 2010. Growth modelling in the Heureka system. Swedish University of Agricultural Sciences, Faculty of Forestry. http://heurekaslu.org/wiki/Heureka_prognossystem_(Elfving_rapportutkast).pdf.
- Furnival GM, Wilson RW. 1971. Systems of equations for predicting forest growth and yield. In: Patil GP, Pielou EC, Walters WE, editors. Statistical ecology , Vol. 3. University Park: Pennsylvania State University Press; p. 43–55.
- Granhus A, Eriksen R, Nilsen JE. 2016. Resultatkontroll skogbruk/miljø Rapport 2015. Norwegian Institute for Bioeconomy Research. 35.
- Gyawali N, Burkhart HE. 2014. General response functions to silvicultural treatments in loblolly pine plantations. Can J For Res. 45(3):252–265. doi: 10.1139/cjfr-2014-0172
- Hasenauer H, Burkhart HE, Amateis RL. 1997. Basal area development in thinned and unthinned loblolly pine plantations. Can J For Res. 27(2):265–271. doi: 10.1139/x96-163
- Henningsen A, Hamann JD. 2007. Systemfit: a package for estimating systems of simultaneous equations in R. J Stat Softw. 23(4):1–40. doi: 10.18637/jss.v023.i04
- Hoen H, Eid T. 1990. A model for analysis of treatment strategies for a forest applying standvice simulations and linear programming [En modell for analyse av behandlingsalternativer for en skog ved bestandssimulering og lineær programmering]. Report 9:90.
- Hoen HF, Gobakken T. 1997. Brukermanual for Bestandssimulatoren GAYA v1.20. Department of Forest Sciences, Agricultural University of Norway, 59 pp. Internal report.
- Hynynen J, Ojansuu R, Hökkä H, Siipilehto J, Salminen H, Haapala P. 2002. Models for predicting stand development in MELA system. Metsäntutkimuslaitos.
- Lappi J. 1992. JLP: a linear programming package for management planning. Suonenjoky: The Finnish Forestry Research Institute. 134 pp. Research Paper 414.
- Lenhart JD. 1968. Yields of old-field loblolly pine plantations in the Georgia Piedmont. Athens: University of Georgia. 98 pp.
- Mäkinen H, Isomäki A. 2004. Thinning intensity and growth of Norway spruce stands in Finland. For Int J For Res. 77(4):349–364.
- Nilsson U, Agestam E, Ekö P-M, Elfving B, Fahlvik N, Johansson U, Karlsson K, Lundmark T, Wallentin C. 2010. Thinning of Scots pine and Norway spruce monocultures in Sweden – effects of different thinning programmes on standlevel gross- and net stem volume production. Stud For Suec. 219:46.
- Næsset E, Tveite B. 1999. Stand volume functions for Picea abies in eastern, central and northern Norway. Scand J For Res. 14(2):164–174. doi: 10.1080/02827589950152890
- R Core Team. 2019. R: a language and environment for statistical computing. Vienna: R Foundation for Statistical Computing. http://www.R-project.org/.
- Reineke LH. 1933. Perfecting a stand-density index for even-aged forests. J Agric Res. 46(7):627–638.
- Robinson A. 2004. Preserving correlation while modelling diameter distributions. Can J For Res. 34(1):221–232. doi: 10.1139/x03-191
- Schumacher FX. 1939. A new growth curve and its application to timber yield studies. J For. 37:819–820.
- Sharma RP, Brunner A. 2016. Modeling individual tree height growth of Norway spruce and Scots pine from national forest inventory data in Norway. Scand J For Res. 32(6):1–14.
- Sharma RP, Brunner A, Eid T, Øyen B-H. 2011. Modelling dominant height growth from national forest inventory individual tree data with short time series and large age errors. For Ecol Manag. 262(12):2162–2175. doi: 10.1016/j.foreco.2011.07.037
- Søgaard G, Allen M, Astrup R, Belbo H, Bergseng E, Blom HH, Bright R, Dalsgaard L, Fernandez CA, Gjerde I, et al. 2019. Effekter av planting av skog på nye arealer. Betydning for klima, miljø og næring. [Effects of planting forest in new areas. Importance for climate, environment and industry]. NIBIO. 3:86.
- Strand L, Braastad H. 1967. Høydekurver for bjørk. Meddelelser fra det Norske Skogforsøksvesen. 22:291–302.
- Tveite B. 1976. Bonitetskurver for furu. Intern rapport. [Unpublished].
- Tveite B. 1977. Bonitetskurver for gran. Norsk Institute for Skogforskning. 33(1):84.
- Vanclay JK. 1994. Modelling forest growth and yield: applications to mixed tropical forests. Wallingford: CAB International.
- Vestjordet E. 1967. Functions and tables for volume of standing trees: Norway spruce. Meddr Nor Skogforsøksves. 22:543–574. (In Norwegian with English summary).
- Weiskittel AR, Hann DW, Kershaw Jr JA, Vanclay JK. 2011. Forest growth and yield modeling. Oxford: Wiley-Blackwell.
- Wickham H. 2009. ggplot2: elegant graphics for data analysis. New York (NY): Springer-Verlag.
- Zhao D, Borders B, Wang M, Kane M. 2007. Modeling mortality of second-rotation loblolly pine plantations in the piedmont/upper coastal plain and lower coastal plain of the southern United States. For Ecol Manag. 252(1):132–143. doi: 10.1016/j.foreco.2007.06.030
- Zhao D, Kane M, Markewitz D, Teskey R, Clutter M. 2015. Additive tree biomass equations for midrotation loblolly pine plantations. For Sci. 61(4):613–623. doi: 10.5849/forsci.14-193