Abstract
We seek to determine whether cellular radiosensitivity in nineteen human colorectal tumor cell lines and three human glioblastoma tumor cell lines segregate into statistically distinct groups and whether such groups correlate with gene expression. We measure clonogenic survival in 22 cell lines that vary in radiosensitivity and in expression of selected genes: ATM, TP53, CDKN1A, 14-3-3σ, Ki-ras and DNA mismatch repair genes. We describe and compare radiosensitivity in these cell lines by one-parameter or two parameter analysis. Radiosensitivity varies among and between colorectal tumor cell lines and glioblastoma cell lines. When compared directly using survival, or using two-parameter analysis of radiosensitivity, cell lines distribute into four statistically-significant radiosensitivity groups. These groups associate strongly with the status of two genes, ATM and TP53, but do not associate with CDKN1A, 14-3-3σ, Ki-ras and DNA mismatch repair genes. Intrinsic cellular radiosensitivity of 22 colorectal and glioblastoma cell lines fall into four radiosensitivity groups that associate with expression of ATM and TP53. These analyses suggest multiple mechanisms underlay intrinsic cellular radiosensitivity.
Since Puck and Marcus Citation[1] first showed that reproducible clonogenic survival patterns could be derived when cells were irradiated in vitro with graded doses of x-rays, these “survival curves” have been studied in great detail by many research scientists. Goals of these studies generally have sought to discern whether these patterns: 1) showed insight into physical, molecular and cellular processes; 2) represented the response of tumors in vivo from which the cells were derived; and 3) presented a model to guide development of more effective radiotherapy protocols.
Our experimental plan is straightforward and designed to compare survival levels in 22 cell lines and test whether differences are significant. We compared survival between cell lines in two ways. First we performed a direct comparison of survival levels at selected doses between groups of cells. Second, we extracted descriptive parameters from each survival curve and compared these by single-parameter and by two-parameter analyses. These parameters were derived using the linear-quadratic model and also using a linear-linear (LL) model. The LQ model has become the most widely used model in radiobiology Citation[2], Citation[3] and we extract the parameters α (LQ) and β (LQ) from this model as descriptors of response at lower doses (circa 2 Gy) and for higher doses (4 to 10 Gy). The linear-quadratic model has been used extensively to describe the response of tumors and also the response of normal tissues Citation[4] usually by assigning α/β ratios to these responses. Hall Citation[5] in his text compares the characteristics of the LQ model of radiosensitivity to other models.
We calculated two parallel coefficients from a linear-linear model. At lower doses, we calculated α (SF2), the coefficient of the slope of the survival curve from 0 to SF2 (survival at 2 Gy) or from data at 2.5 Gy. We calculate ω* as the coefficient of the slope of the component at higher doses (> 4 Gy) that represents additional killing beyond that attributed to the α (SF2) component
Tumor radiosensitivity circa 2 Gy has been proposed as a marker for tumor radiocurability, at least for those protocols that use multiple fractions in this dose range. Malaise and his colleagues Citation[6] have shown a correlation between the radiosensitivity of tumor cells and the radiocurability of the same histological tumor type. Important to this paper, West et al. Citation[7] have shown that a specific parameter, SF2 (survival of explanted tumor cells to 2 Gy irradiation in vitro) predicts response of the same tumor to radiotherapy protocols when they are irradiated with multiple fractions of circa 2 Gy. However, these studies used only a one-parameter analysis and we posit that for complete descriptions of radiosensitivity, at least two-parameters are needed to uniquely identify the radiosensitivity of a human tumor cell.
Another major focus in the study of radiosensitivity in vitro has been to identify genes that associate with cellular response to radiation. Studies have focused on genes that determine efficacy of DNA repair Citation[8] and more recently on TP53. Tumor cells mutant in TP53 have elevated prevalence in human tumors, and the TP53 gene has have been suggested as important in radiation response Citation[9]. Radiosensitivity in cells that vary in TP53 status has been extensively studied and reviewed comparing radiosensitivity with TP53 status Citation[10–13]. In general these reviews conclude that there is an association between cellular radiosensitivity and TP53 status or p53 protein synthesis but this is not a universal finding. For instance Daniels et al. Citation[14] find no association between TP53 status and p53 synthesis in human melanoma lines. Important for this paper is the observation by Kandolier et al. Citation[15] that there is an association between TP53 status but not p53 protein of tumor cells and the clinical response of rectal cancer to local preoperative radiotherapy. The mechanistic bases for involvement of TP53 in cellular radiosensitivity have not been identified, complicated by multiple roles that TP53 plays in the cell Citation[16]. We selected the relationship between radiosensitivity and TP53 as a major focus of our studies. We approached this problem in two ways. First, we studied a larger series of cell lines that express different forms of TP53 status: wildtype, mutant, abrogated and null. This increased the statistical power of our experiments to identify clustering of cell lines into radiosensitivity groups and possible association with molecular markers. Further we compared radiosensitivity directly between a pair of isogenic cell lines produced by Vogelstein's laboratory. These cell lines were HCT116, a relatively sensitive human colorectal tumor line that expresses wtTP53, and a subline of this tumor cell, 379.2, that has been abrogated for the TP53 gene Citation[17]. Thus in a pair of isogenic cell lines we could compare radiosensitivity before and after the wtTP53 gene was abrogated.
Other genes have also been suggested as possible modulators of radiosensitivity. Recently 14-3-3σ, a gene associated with cell progression through G2 phase has been shown to be important for cytogenetic damage induced by radiation in colorectal cells Citation[18]. We included a cell line abrogated in this gene. We have previously shown that cells that have been abrogated for the gene CDKN1A (p21, WAF-1, CIP-1) show in vitro sensitivity similar to their parent line but a much stronger response in vivoCitation[19] and we included these lines in our studies. N-ras and K-ras have been suggested as playing a role in radioresistance Citation[20] and we examined a pair of isogenic colorectal tumor cells, one of which had been transfected with a Ki-ras vector. Cells and tumors from individuals with the genetic condition ATM are known to be radiosensitive Citation[21] and we obtained a cell line mutant for the ATM gene (an A inserted in codon 6997 of exon 50) from Dr. James Russell. Since several of the colorectal tumor cell lines studied were deficient in genes involved in DNA mismatch repair, we again evaluated isogenic cell lines, one of which having its deficiency in DNA mismatch repair (hMLH6) restituted by chromosomal transfer Citation[22].
While the colorectal tumor system offered a very diverse and relevant system for studying radiosensitivity in human tumor cells, our preliminary studies also showed that three glioblastoma cell lines were, as a group, more resistant than colorectal lines. Therefore we included two such lines that expressed mutTP53 and one that expressed wtTP53 in our studies.
Thus our preliminary data and analyses suggested three hypotheses: 1) Radiosensitivity of tumor cells falls generally into four groups; 2), there is correlation between expression of TP53 and at least two of the radiosensitivity groups; and 3) there is a correlation between parameters that describe the rate of radiosensitivity at lower doses and parameters that describe radiosensitivity at higher doses. We designed and performed three sets of experiments to test these two hypotheses. First we sought better definition of the relationship between cellular radiosensivity and gene expression in multiple cell lines that vary in their expression of TP53 and other genes. Second, we made detailed measurements of survival extracting coefficients as defined by the linear-quadratic model and a linear-linear model. Third, we performed two-parameter analysis to understand the nature of clustering and correlations between the coefficients of the 22 cell lines.
Materials and methods
Cell lines
The human glioblastoma cell lines U251 and U87 were obtained from the American Type Culture Collection (Rockville MD). HCT116, 80S4, 379.2, 14-3-3 σ − /−, DLD1, 19S186 were obtained from Dr. Bert Vogelstein of Johns Hopkins. SW1222 was obtained from Dr. James Russell at Memorial Sloan Kettering Cancer Center. T98G cells were from Dr. John B. Little of Harvard School of Public Health. Most cell lines were maintained in McCoy's medium (exceptions being SW1222 in RPMI 1640, U251 and U87 in F12/DMEM, T98G in MEM). Medium was supplemented with 10% fetal bovine serum and 1% penicillin plus streptomycin (Gibco Long Island NY). 14-3-3 σ − /− cells were cultured in the presence of G418 (0.5 mg/ml). Stock cultures were grown in plastic flasks in a 37oC incubator with a 5% CO2-95% air atmosphere and subcultured to maintain cells in exponential growth.
Radiation and clonogenic assay
Cell survival studies after exposure to high-dose-rate radiation exposures were carried out in a Gammacell 40 (Nordion Ottawa ONT Canada) at approximately 0.7 Gy/min. Single cells at appropriate cell densities were plated 18 hours before irradiation in 3 to 5 replicate plates. After exposure, plates were incubated for 8 – 14 days depending on specific growth and colonies stained with crystal violet. Colonies with more than 50 cells were counted. For each cell line we performed controls to account for possible proliferation during the period between plating and irradiation. This control consisted of plating 105 cells in separate plates when replicates of cells were plated for colony formation. When irradiation was performed on the plates for colony formation, the microcolony plates were stained and the number of cells per colony measured microscopically. The average number of cells per colony was below 1.15 cells per microcolony for all cell lines and did not vary significantly between cell lines.
Analytical units
We express all survival data in logarithms to the base 10. All error bars represent the standard error of the mean. The coefficients of the slopes of survival curves (rates of cell kill) are expressed as logs10 killed per Gy.
Statistical analysis
Comparison of data clusters were evaluated using Student's t-test using p < 0.05 as the level for significance. Correlation coefficients were calculated using Pearson's Correlation Coefficient Regression Analysis.
Calculation of parameters from clonogenic survival curves that provide quantitative descriptors of cellular radiosensitivity
For each survival curve, we calculated two parameters that describe the rate of cell kill circa 2 to 2.5 Gy and two parameters that describe the rate of cell killing at higher doses,>4 Gy. Each replicate for each data point in the range of 2.0 to 2.5 Gy was converted into a form that could be compared directly between cell lines. To do this we estimated the slope of the line between each datum, not means of the replicates, and zero dose. For each dose-point for each cell line there were 3 to 5 replicates per experiment. In this paper we will refer to this slope as “α (SF2)” which in numerical terms is exactly ½ of SF2 but is a rate, and expressed as logs killed per Gy Second, we used the linear-quadratic model to extract the coefficient of the linear component and we designate this as “α (LQ)”. To do this we performed reiterative fitting to achieve the best fit to the α-β model and extracted the coefficient of the linear component. The correlation coefficient between α (SF2) α (LQ) for a much larger data set (data not shown) was R2=0.9552, suggesting they are appreciably equivalent.
We calculated two parameters that describe the slope of the survival curve for doses from 4.0 to 10.0. First we performed linear regression of the dose points in this range and determined the slope of the regression line and we designate the coefficient of this line as as “ω”. This parameter is inversely related to “Do”, the dose needed to reduce survival on the linear portion of the survival curve by 1/e. We used the linear-quadratic model to predict the terminal rate of cell killing as – α D – β D2 and from this extracted β. We also calculated a parameter that represents cell killing at larger doses that cannot be attributed to killing by α (SF2) for a linear-linear analysis and designate this as “ω*” which is ω-α, and is the equivalent of term β D2 from the linear-quadratic model.
Results
Survival patterns in human colorectal and human glioblastoma tumor cells
We selected ten human colorectal tumor cell lines on the basis of their TP53 status: four lines that express wtTP53, four lines that express mutTP53 and two lines that did not express TP53 i.e. null TP53. In we show clonogenic survival for these 10 cell lines.
Figure 1. Clonogenic survival in 10 human colorectal tumor cell lines. Panel A shows survival of colorectal cell lines that express wtTP53, panel B shows survival of cell lines that express mutant TP53, panel C shows survival of cell lines that are null for TP53 expression. Dotted lines represent average of cell lines from other panels. We use the terms R, S and VS to designate groups of cells that appear to constitute groups of cells classified as resistant, sensitive or very sensitive.
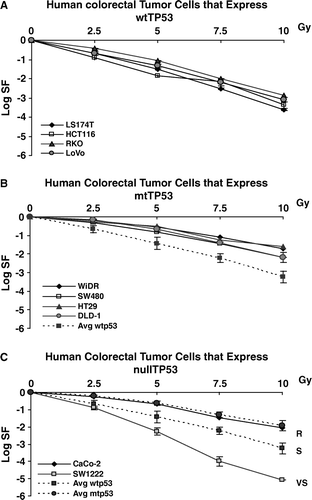
Comparing data in panels A and B, there are clear differences, at least at higher doses, between colorectal tumor cells that express wtTP53 and those that express mutTP53, the former being more sensitive than the latter. Panel C shows that one colorectal tumor cell line null for TP53 (CaCo-2) segregates with the mutTP53 cell lines while the other null cell line SW1222 is considerably more sensitive than any other line. However on the scale of , differences may seem small, even when they represent significant differences as will be shown subsequently. For purposes of discussion, we will refer to the three radiosensitivity groups shown in panel C as: VS (very sensitive), represented by the cell line SW1222; S (sensitive) represented by wtTP53 colorectal tumor cells; and R (resistant) represented by the mutTP53 colorectal tumor cells. In data shown below, we will propose a fourth group, VR (very resistant) represented by the three human glioblastoma cells, one expressing wtTP53 and two expressing mutTP53.
While the data in showed a relatively wide range of radiosensitivity, three glioblastoma cell lines were more resistant and these data are shown in , together with representation of the three radiosensitivity groups shown in .
Figure 2. Survival of three glioblastoma cell lines compared to data on glioblastoma cells in . Two cell lines express mutTP53 (U251 and T98G) and one cell line expresses wtTP53 (U87).
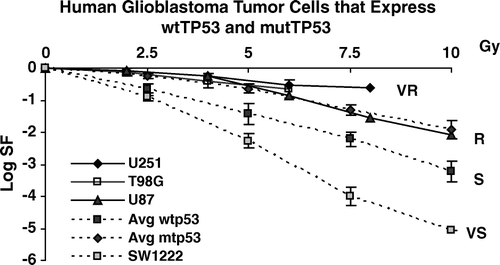
Two of the glioblastoma lines in express mutTP53 (U251 and T98G) and one expresses wtTP53 (U87). These cell lines, when considered as a group, are more resistant than colorectal tumor cells, as will be shown statistically below.
Positive or negative association of cellular radiosensitivity with specific genes
We evaluated radiosensitivity in a series of pairs of isogenic cell lines so the effect of modulating several genes could be compared directly to its parent line. First we compared HCT116, a relatively sensitive (S) colorectal tumor line that expresses wtTP53 gene, with a subclone of this line (379.2) that was abrogated for the TP53 gene, rendering it null for p53 expression. Further, we obtained cell lines that had been manipulated in several genes from the same common parent line, HCT116. These included: abrogation of CDKN1A (p21, CIP-1, WAF-1) in an HCT subline, 804S; abrogation of 14-3-3σ in an HCT subline, 14-3-3σ −/ − ; transfection of chromosome 3 to restore mismatch repair in HCT116, N6CH3. In addition we compared isogenic pairs from two mutTP53 cell lines: transfection of CaCO2 with a Ki-ras vector (CaCo2-neoras); and abrogation of DLD-1 at the CDKN1A gene (19S186). Each manipulated cell is compared to its parent line and to three unmanipulated clones of HCT116. These data are shown in .
Figure 3. Clonogenic survival in genetically manipulated cell lines compared to their parent lines. For clones derived from HCT116, manipulated lines are compared to the average of three clones of this line which is shown in the top left panel. Manipulated lines, shown in sequence from the second panel in the left column through to the right column: 379.2 (abrogation of TP53 in HCT116 cells); 80S4 (abrogation of CDKN1A in HCT116 cells); N6CH3 (transfection of HCT116 cells with chromosome 3 to restitute hMLH1); 14-3-3s − /− (abrogation of 14-3-3s +/+ in HCT116 cells); Caco2-neoras (transfection of CaCo2 cells with a Ki-ras vector) and 19S186 (abrogation of CDKN1A in DLD-1 cells).
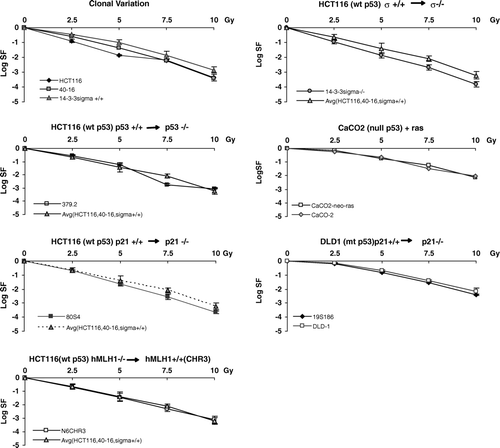
To interpret these data we used two criteria. First, the derived cell line must be significantly more sensitive or resistant for at least three dose points. Second, for cell lines derived from HCT116, this difference must be greater than the inter-clonal variance shown in the upper left panel. Using these standard survival curves, no differences in survival are observed for the several manipulated cell lines shown in . While survival of 14-3-3σ −/− is significantly decreased compared to its parent line when survival at each point is tested, this decrease does not exceed the variation shown between multiple clones of HCT116.
Parametric analysis of intrinsic radiosensitivity in 22 cell lines
In , it is not possible to discern clear differences between some of the cell lines at doses circa 2 Gy, however these differences can be compared quantitatively by extracting parameters that describe the slope of cell killing curve (logs10 cells killed per Gy) over this dose segments and also at doses greater than 4 Gy. To extract these parameters we used two models, the linear-quadratic model (LQ) and a linear-linear model as described above.
For each survival curve in we derive two parameters that describe cell killing circa 2 Gy, α (LQ) and α (SF2) and two that estimate additional cell killing at higher doses β (LQ) and ω*. In we show the 22 cell lines, their histology, their biological characteristics and the four coefficients that describe their radiosensitivity using the LQ and LL models.
Table I. Molecular and radiobiological characteristics for human colorectal and human glioblastoma cell lines. Note that the coefficients are expressed as logarithms to the base 10.
The data in can be analyzed to answer two questions: 1) are there statistically valid differences between coefficients of cells that fall into the four radiosensitivity groups; and 2) are there patterns of parameters within radiosensitivity groups and between radiosensitivity groups that suggest mechanistic relationships between response at higher or lower doses?
First, using Student's t-test we tested the validity of differences between the four coefficients for all four radiosensitivity groups. Our hypothesis tested the hypothesis that there are four radiosensitivity groups in our set of 22 cell lines: a VS group comprised of 1 cell line (SW1222); an S radiosensitivity group comprised of 10 cell lines (HCT116, LoVo, CBS, LS174T, 379.2, 80S4, 14-3-3σ + /+,40-16,14-3-3σ − /−, N6CH3), an R radiosensitivity group comprised of 8 cell lines (DLD-1, HT29, WiDR, SW480, SW116, 19S186, CaCo2, CaCo2-neoras) and a VR radiosensitivity group of three cell lines U251, U87 and T98G. For each of these groups we measured the mean and standard deviation of the coefficient α (SF2). These data, shown on the basis of radiosensitivity group is shown together with statistical confidence analysis are shown in .
. Statistical comparison between the parameter a(SF2) for three radiosensitivity groups S, R and VR. Upper panel: data extracted from . Lower panel: t-test for significance between different values.
These data show significant differences between S and R cells and between VR and R cells. The significance between VR and R cells increases when data for the wtTP53 line U87 is omitted from the comparison. Since the VS radiosensitivity group is comprised of a single line, the significance of its difference from S cells cannot be estimated but based on the two-parameter analysis shown below the hypothesis seems supported by both sets of data. Similar differences are observed for analysis of the parameter α (LQ). There are no significant differences between the four radiosensitivity groups for the parameters β (LQ) or ω*.
Two parameter analysis of survival patterns for 22 cell lines
Preliminary data also indicated that there was clustering and correlations between some of the four parameters that describe radiosensitivity when they were compared one with the others. Some correlations were expected and observed, for instance between different estimates using the two models for the rate of cell killing over the same dose ranges e.g. circa 2 Gy and > 4 Gy. For instance there was strong correlation between α (SF2) and α (LQ), R2= 0.9552; there was significant correlation between β and ω*. However we did not anticipate the strong correlations we observed between descriptors of radiosensitivity at 2 Gy and the descriptors of radiosensitivity at > 4 Gy. Further these correlations clustered in patterns specific to different radiosensitivity groups. In we show correlation between the two coefficients determined by linear-linear analysis, α (SF2) and ω. There was a generally similar pattern for correlation between α (LQ) and β (LQ) but with decreased correlation coefficients (data not shown).
Figure 4. Two parameter analysis of 22 human tumor cell lines. Cell lines fall into four radiosensitivity groups that we have designated as VS, S, R and VR respectively. Correlation coefficients are shown next to each group.
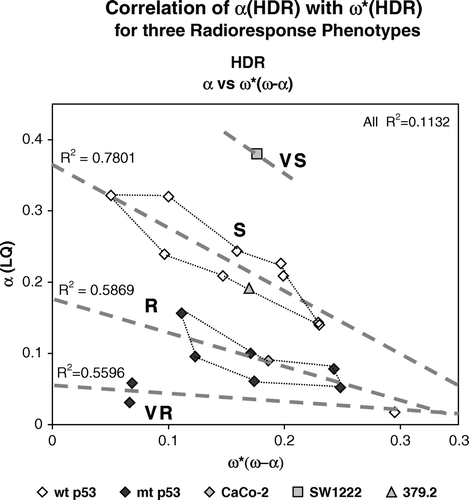
The R and S data fall into diagonal, relatively linear patterns. Values for the VR cell lines also show this same general pattern, but more glioblastoma cell lines will be needed to establish this with confidence. The correlation coefficient shown in for S cells shows that there is relatively strong correlation and somewhat less so for the R cell lines and VR cell lines. However correlation is very poor when all cell lines are considered demonstrating that it is the segregation into different groups that confers correlation. It is interesting that the terminal slope (ω*) of the wildtype glioblastoma cell (U87) is the largest of all tumor cells we have examined while the initial slope is, with the other two glioblastoma lines, quite small. In the data point for U87 lies close to the extreme end of the S line if it is extrapolated to higher values of α (SF2).
Discussion
The data presented in this paper have important implications:
Cellular radiosensitivity of human tumor cells falls into distinct groups. Our data suggests that cellular radiosensitivity is based on multiple, distinct cell response mechanisms;
Our data show correlation between radiosensitivity and some genes but not others. These associations suggest molecular bases for these distinct cellular response mechanisms;
These data have significant implications for clinical application and future research.
Intrinsic radiosensitivity of human tumor cells fall into four groups
Our designation of these four groups as VS, S, R and VR is arbitrary but the assignment of cell lines into the four groups is not. Data in and , and 3 suggest several relationships between gene expression and cellular radiosensitivity. First, there is a strong, but not absolute, association between radiosensitivity and expression of TP53, at least for colorectal tumor cells. The prevalence of wtTP53 cells in the S group is 90% (9 of 10), but all wtTP53 colorectal cell lines fall into this group. The prevalence of mutTP53 cells in the R group is 78% (7 of 9) but all mut TP53 colorectal cells fall into this group. If one examines the exact nature of the mutations in colorectal tumor cell lines that fall into R group, they are dominant negative changes and have point mutations between codons 178 and 245 (). However, cells that do not express p53 protein (null) fall into all four groups. The cell line SW1222 is the most sensitive cell line we have examined and we posit that its failure to express p53 is secondary to its mutant status in the ATM gene. Two null lines fall into the R group. Most importantly from a mechanistic standpoint, abrogation of TP53 in the cell line HCT116 rendered it null for p53 expression but did not induce a shift out of the S radiosensitivity group. We hypothesize a mechanism for these data below. Our data also test the hypothesis that the presence or absence of wildtype or mutant p53 protein is causally related to radiosensitivity. It is not. Cells that do not express either form of p53 fall into multiple radiosensitivity groups. These several data show that the presence of wtp53 protein does not confer radiosensitivity as seen in the colorectal S cells nor does the presence of mutp53 confer radioresistance as observed in R cells.
The data in also show that manipulation of other genes did not alter radiosensitivity: abrogation of CDKN1A in either a wtTP53 or a mutTP53 background; abrogation of 14-3-3σ, transfection of chromosome 3 to restore DNA mismatch repair or insertion of a Ki-ras vector into a mutTP53 background.
When two-parameter analysis is applied as shown in the linear clusters of S and R data groups do not intersect nor overlap. In the VR group, we have examined only three cell lines but there is a small but significant difference between this group and the R group. The single VS cell line when compared to other groups appears to be a significantly more radiosensitive.
Association between radiosensitivity of tumor cells and expression of specific genes
The data in this paper also establish relationships between the status of certain genes and radiosensitivity of human tumor cells. Regarding TP53, we have examined the radiosensitivity of cells that vary in the status of this gene, and there are firm, interesting correlates. First, all colorectal cell that express wtTP53 all fall into the S radiosensitivity group. They share this cell radiosensitivity group with the cell line 379.2 that has been abrogated at the TP53 gene and hence does not produce p53. Therefore the presence of wtp53 protein is not causally related to the radiosensitivity characteristics exhibited by this group of cells. We will use this fact in our proposed model. All colorectal tumor cells that express mutTP53 fall into the R and VR groups. One wtTP53 glioblastoma lines, U87, can be included in the VR group is one parameter analysis is used (, ) but can be considered to fall at the extreme end of S cells if two-parameter analysis is used (). Evaluation of more glioblastoma cell lines will resolve these alternatives.
The cell line SW1222, mutant in ATM, is unusual in its sensitivity but since we examined only a single cell line with this defect, statistical validation cannot be determined in a rigorous manner.
Beyond TP53 and ATM, our data makes specific statements on the effect of other genes on radiosensitivity. Using isogenic comparisons, the effects of several other genes have been evaluated: CDKN1A, Ki-ras, 14-3-3σ and DNA mismatch repair genes and these genes as evaluated in our studies do not influence cellular radiosensitivity to acute irradiation in vitro. We caution that our observations on the influence of these genes on response to high dose-rate radiosensitivity in this paper does not mean that they do not necessarily influence low dose-rate radiosensitivity, susceptibility to apoptosis, susceptibility to chromosome aberrations and redistribution in the cell cycle.
Implications for clinical application
Our data have several implications for clinical application. First, we propose that it presents an overall quantitative description of human tumor cell radiosensitivity. In over 40 cell lines we have examined, SW1222 is the most sensitive and U251 is most resistant. Thus the data in , we contend, is a useful overview of human tumor cell radiosensitivity. The data in can be used to predict cell killing by any protocol for any cell line. Total cell killing may be a useful parameter for examining its possible correlation with xenograft tumors and to tumors in the clinic. Thus the benefit of protocols such as hypofraction can be evaluated using the data in . One of the most interesting, and to us unexpected, results from this paper is the linear relationship in S and R cells between parameters that describe survival at lower and higher doses, i.e. a linear relationship between α (SF2) and ω* or the nearly linear relation ship between α(LQ) and β(LQ). This observation can be the basis of new efforts to predict cell killing and tumor response on the basis of a single dose measurement if the TP53 status is known. At least for colorectal tumor cells, if one cell survival level is identified and the TP53 status is determined, then the entire survival curve can be inferred as well as other parameters such as the α/β ratio. From a sampling viewpoint, TP53 status is clearly a useful marker for predicting radiosensitivity groups. All wtTP53 cells and no mutTP53 cells fall into the S group. Thus sampling a colorectal tumor for expression of TP53 immediately suggests that constituent cells probably fall into the S group. Conversely, if mutTP53 expression is observed, the cells of such tumors fall most probably fall into R or VR radiosensitivity groups. In a practical sense, nullTP53 expression can also be classified as R cells since only two such cells fall outside the R group. One of these cells, 379.2 is an artificial construct unlikely to present in the clinic. SW1222 is a tumor that should respond well to any radiotherapy protocol. Hence, a strategy may be developed for treating tumors whose constituent cells are mutTP53, e.g. tumors comprised of R and VR cells; on the basis they will not respond well to protocols that use small fractions (circa 2 Gy). S cells should respond to these protocols having smaller values for α. Tumors that respond well to standard protocols may be comprised of S cells. Tumors comprised by R and VR cells may respond better to protocols that use larger fractions (hypofractionation) and we are investigating this approach in the clinic at Loma Linda using proton radiotherapy.
An overall model of tumor cell radiosensitivity
Identification of four radiosensitivity groups implies that there may be mechanistic differences in these four groups. If we apply Ockham's razor to our data, the simplest model suggests a “base-line radiosensitivity” that can be modulated by four factors or mechanisms. We hypothesize that “base-line radiosensitivity” of human tumor cell should be the S group since it shares expression of wtTP53 with normal tissues. Based on this hypothesis, we propose that four factors or mechanisms can influence tumor cell radiosensitivity. In we present this hypothesis in cartoon fashion imposed on the data from , showing the four possible factors as arrows emanating within and from the S line.
Figure 5. A hypothetical model proposing that radiosensitivity groups can be considered as modifications of the S cell group. Factor 1 represents modification between different cell lines within the S group. Factor 2 represents the modification of S radiosensitivity to R radiosensitivity. Factor 3 represents the modification of S cells to VR radiosensitivity and factor 4 represents the sensitization caused by mutation of the ATM gene.
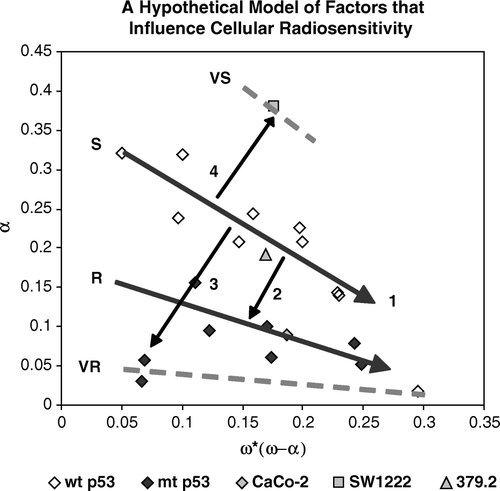
In , we present Factor 1 as the mechanism(s) that determines variation in sensitivity within the S group, and also within the R group. These variations are substantial, and radiosensitivity of cells in both the S and R groups extends over a significant range of each of the two parameters. The relatively strong correlation coefficients for the S and R groups suggest within these groups the two parameters, α (SF2) and ω*, (and α (LQ) and β (LQ) as well, data not shown) are directly related or co-vary with a common mechanism. The variation and overlap that we observe between and within S and R cells may also explain why different authors are not consistent in their observations of correlation between radiosensitivity in cells that express wtTP53 and mutTP53. The negative slope of these correlations, showing that as α (SF2) decreases, ω* increases, suggests a conservative death paradigm in which changes in the rates of cell killing over one range of doses, co-varies inversely with changes in cell killing in the other dose range.
Factor 2 represents the mechanism(s) that distinguish radiosensitivity of S cells from that of R cells. The common characteristics of all cells in the S group, cells that express wtTP53 and the cell line 379.2 that has been rendered null by abrogating that gene, is that they progressed through oncogenesis in the presence of wildtype TP53. Since radiosensitivity of all S cells is retained through extensive mitotic proliferation, we conclude that such a property may be associated with a differential susceptibility of cells to radiation-induced damage such as heritable changes in chromatin conformation as suggested by Chapman Citation[22]. Alternately, heritable modification of susceptibility to efficient DNA repair by altered DNA methlyation is also possible Citation[23]. The concept proposed by Allison and Milner Citation[24] that p53 creates a novel protective function through a global remodeling of chromatin, is extremely interesting in this context. We propose that wtp53 or mutp53 protein does not contribute causally to radiosensitivity but may be useful markers for the S and R groups.
Factor 3 represents the mechanism or characteristics that render some glioblastoma cells very resistant. While it is attractive to speculate that this radiosensitivity may reflect an extension of mechanisms associated with Factor 2, we have no evidence to support this and biological characteristics of this resistance are not defined. Certainly radioresistant glioblastoma cells may have altered patterns of chromatin structure.
Factor 4 reflects the increase in radiosensitivity observed in the SW1222 cell line. Factor 4 is important in that in our model, it is the only factor that renders cells more sensitive. In extensive and detailed studies to be published elsewhere, we observe exceptional levels of radiation-induced apoptosis in this line; exceptional patterns of radiation-induced G2 arrest; unusual patterns of radiation-induced chromosome aberrations and exceptional sensitivity as xenograft tumors to protracted, fractionated and acute irradiation. Thus the VS group, as represented by SW1222 may represent a unique and peculiar radiosensitivity. However, we point out that this cell line probably does not represent any clinically relevant group of tumors but does, we suggest, represent a powerful tool to study one type of radiosensitivity that may be mimicked by chemical or biological vectors that inhibit or remove ATM function(s).
Implications for future research
Our data suggest directions for future research. Tumor cells from the four radiosensitivity groups present an excellent experimental model for comparing patterns of gene expression that correlate with the different factors (mechanisms) that influence cell killing. Further, since the data in provides a global view of tumor cell radiosensitivity, this overview can be used to select those research directions that offer the potential for the greatest effect on increasing cell killing by the several mechanisms. This is especially true for comparison of possible effects of different radiotherapy protocols such as hypofractionation. Our judgment is that our data suggests two priorities. First, mimicking the effects seen in the mutATM cell by intervention with chemical or biological vectors could potentially increase radiosensitivity, perhaps in any tumor cell. Second the use of larger fractions should increase response in those human tumor cells whose small values of α (SF2) coefficient suggest reduced response to protocols using fractions at circa 2 Gy.
Summary
In summary, our data show that radiosensitivity expressed in human tumor cells falls into distinct groups. This in turn suggests that factors that determine intrinsic cellular radiosensitivity are limited in number. We have suggested an analytical structure that expands this hypothesis. The expression of wtTP53 and mutTP53 are markers for the two major radiosensitivity groups although we believe wtp53 and mutp53 protein are not involved directly in radiosensitivity. Mutated ATM, at least as expressed in SW1222 cells, strongly sensitizes tumor cells to radiation-induced killing. CDKN1A, 14-3-3 σ, k-ras or MLH1 genes do not affect high dose-rate radiosensitivity.
Related Research Data
References
- Puck TT, Marcus PI. Action of X-rays on mammalian cells. J Exp Med 1956; 103: 653–66
- Thames HD, Jr, Withers HR, Fletcher GH. Changes in early and late radiation responses with altered dose fractionation: Impliations for dose-survival relationships. Int J Radiat Oncol Biol Phys 1982; 8: 219–26
- Fowler JF. The linear-quadratic model and progress in fractionated radiotherapy. Br J Radiol 1989; 62: 679–94
- Fowler JF. Dose-response curves for organ function in cell survival. Br J Radiol 1983; 56: 497–500
- Hall, E. Radiobiology for the Radiologist. Chapter 3. Philadelphia: JB Lippincott; 1994.
- Malaise EP, Fertil B, Chavaudra N, Guichard M. Distribution of radiation sensitivities for human tumor cells of specific histological types: Comparison of in vitro to in vivo data. Int J Radiat Oncol Biol Phys 1986; 12: 617–24
- West CM, Davidson SE, Roberts SA, Hunter RD. The independence of intrinsic radiosensitivity as a prognostic factor for patient response to radiotherapy of carcinoma of the cervix. Br J Cancer 1997; 76: 1184–90
- Friedberg EC, Walker GC, Siede W. DNA Repair and Mutagenesis. ASM Press, Washington 1995
- Kastan MB, Onyekwere O, Sidransky D, Vogelstein B, Craig RW. Participation of p53 protein in cellular response to DNA damage. Cancer Res 1991; 51: 6304–11
- Bristow RG, Benchimol S, Hill RP. The p53 gene as a modifier of intrinsic radiosensitivity: Implications for radiotherapy. Radiother Oncol 1996; 40: 197–223
- Dahm-Daphi J. p53: Biology and role for cellular radiosensitivity. Strahlenther Onkol 2000; 176: 278–85
- Matsui Y, Tscuchida Y, Keng PC. Effects of p53 mutations on cellular sensitivity to ionizing radiation. Am J Clin Oncol 2001; 24: 486–90
- Weber KJ, Wenz F. p53, apoptosis and radiosensitivity–experimental and clinical data. Onkologie 2002; 25: 136–41
- Danielsen T, Smith-Sorensen B, Gronland HA, Hvidsten M, Barrensen-Dale AL, Rofstad EK. No association between radiosensitivyt and TP53 status, G1 arrest or in levels of p53, myc, ras or raf in human melanoma lines. Int J Radiat Biol 1999; 75: 1149–60
- Kandolier D, Zwrtk R, Ludwig C. TP53 genotype but not p53 immunohistochemistry results predicts response to preoperative short-term radiotherapy in operative rectal cancer. Ann Surg 2002; 235: 493–8
- Robles AI, Linke SP, Harris CC. The p53 network in lung carcinogenesis. Oncogene 2002; 21: 6898–907
- Bunz F, Hwang PM, Torrance C, Waldmann T, Zhang Y, Dillehay L, et al. Disruption of p53 in human cancer cells alters the responses to therapeutic agents. J Clin Inv 1999; 104: 263–9
- Han TA, Hermeking H, Lengauer C, Janschek E, Ploner M, Hofbauer F, et al. 14-3-3σ is required to prevent mitotic catastrophe after DNA damage. Nature 1999; 401: 616–20
- Waldman T, Zhang Y, Dillehay LE, Yu J, Kinzler K, Vogelstein B, et al. Cell cycle arrest vs. cell death in cancer therapy. Nat Med 1997; 3: 1034–6
- Sklar MD. The ras oncogenes increase the intrinsic resistance of NIH 3T3 cells to ionizing radiation. Science 1998; 239: 645–7
- Tribius S, Pidel A, Casper D. ATM protein expression correlates with radioresistance in primary glioblastoma cells in culture. Int J Radiat Oncol Biol Phys 2001; 50: 511–23
- Koi M, Umar A, Chauhan DP, et al. Human chromosome 3 corrects mismatch repair deficiency and microsatellite instability and reduces N-methyl-N'-nitro-N-nitrosoguanidine tolerance in colon tumor cells with homozygous hMLH1 mutation. Cancer Res 1994; 54: 4308–12
- Chapman JD. Single hit mechanism of tumour cell killing by radiation. Int J Radiat Biol 2003; 79: 71–81
- Allison SG, Milner J. Remodelling chromatain on a global scale: A novel protective effect of p53. Carcinogenesis 2004; 25: 1551–7