Abstract
Purpose. To assess the role of image parameters derived from dynamic contrast enhanced magnetic resonance imaging (DCEMRI) in bladder cancer staging, and to investigate the potential use of such parameter images in biological image-adapted radiotherapy (RT). Materials and methods. High-resolution volumetric interpolated breath-hold (VIBE) DCEMRI of 26 patients diagnosed with bladder cancer was performed. DCEMRI parameters derived from tumor and muscle contrast uptake curves were extracted and subjected to correlation analysis with tumor volume as well as clinical, pathological, histological and T2-weighted MR tumor stage. For parameters showing a significant correlation with tumor stage, 3D malignancy maps were generated. As an initial step towards delivery of biologically adapted intensity modulated radiotherapy (IMRT) it was hypothesized that the malignancy map could be used as a RT dose prescription map. Simulating IMRT delivery with multi-leaf collimators (MLCs), idealized dose distributions, constituted by dose cubes, were adapted to the prescription map. The size of the dose cubes were varied to mimic MLCs of varying leaf width. The difference between the adapted and prescribed dose distributions was quantified by the root mean square deviation (RMSD). Results. No significant relationships were found between tumor volume and extracted DCEMRI parameters. The normalized area between tumor and muscle contrast uptake curves (nABC) evaluated from 0–180 seconds (nABC180) and 0–480s (nABC480) correlated significantly with tumor stage (p=0.047 and p=0.035, respectively). Dose prescription maps for 10 patients were generated from the nABC480. The RMSD between the prescribed and adapted dose distribution decreased with decreasing size of the dose cubes. Large interpatient variations in the RMSD and in the dependence of the RMSD on different dose cube sizes were found. Conclusions. The nABC180 and nABC480 may provide added value in staging of bladder cancer. High-resolution IMRT is required for some patients for optimal adapted RT.
Non-invasive three-dimensional imaging using magnetic resonance tomography may provide high resolution images revealing structural, functional and molecular tissue properties. The potential use of such images is still not fully exploited, neither for diagnostic purposes nor for designing novel therapeutic strategies.
In dynamic contrast enhanced magnetic resonance imaging (DCEMRI), an intravenous bolus injection of a paramagnetic contrast agent is used to increase the signal intensity on T1-weighted MR images. Via the vascular network, the contrast agent permeates into the extravascular extracellular space (EES) and is subsequently cleared by renal excretion. Analysis of the temporal signal intensity pattern can be used to derive a variety of descriptive parameters such as peak enhancement, initial enhancement rate, and area under curve (AUC). These parameters reflect the underlying permeability and perfusion of the tumor microenvironment, and composition of the extravascular extracellular space. A voxel-by-voxel quantification of image parameters allows assessment of tumor heterogeneity and may provide localization of e.g. well-perfused regions.
The signal enhancement in DCEMRI is dependent on tissue vasculature. Therefore, the average enhancement might be expected to be poor in large tumors, as compared to small lesions, because they tend to outgrow their vascular supply and develop large areas of hypoxia and necrosis. However, studies have reported that the enhancement characteristics are independent of tumor volume Citation[1], Citation[2]. This indicates a higher prognostic role of DCEMRI, as derived image parameters provide biological intratumoral information not available using standard investigations.
Tumors are heterogeneous entities expected to present spatial variations in radiosensitivity. However, the current standard practice in radiotherapy (RT) is to deliver a homogeneous radiation dose to the entire tumor, thus ignoring biological variations. Tumor oxygenation is an important factor in determining the response to RT, where hypoxic tumors are more resistant to RT Citation[3]. Three-dimensional hypoxia mapping could therefore be useful, both for identifying radioresistant patients and for designing focal dose escalation strategies. Studies have demonstrated that selective boosting of radioresistant regions to increase the overall tumor cell kill is feasible with the recent technological advances in intensity modulated RT (IMRT) Citation[4–9]. Such strategies may be termed biologically adapted RT.
Non-invasive biological imaging modalities like MRI and positron emission tomography (PET) have shown a potential for depicting three-dimensional distributions of tumor radiosensitivity. Among them is DCEMRI, where studies have shown correlations between invasive measurements of interstitial oxygen pressure with extracted DCEMRI parameters Citation[1], Citation[10]. The present study was performed to (1) assess potential correlations between extracted DCEMR image parameters and bladder cancer staging and tumor volume, and (2) to investigate the potential use of derived parameter images in biological image adapted RT.
Materials and methods
Patients
Twenty-six patients with clinically localized biopsy-proven bladder cancer underwent MRI prior to radical radiotherapy between August 2002 and February 2005. Patient median age was 72 years (range: 55–83 years). The institutional ethics review board approved the study and informed consent was obtained from all patients.
Staging
Pathological staging was performed using the TNM classification system Citation[11]. Clinical, pathological, histological and T2-weighted MR tumor staging was performed for all patients. The radiological staging was performed by an experienced uro-radiologist (J.R.).
MRI protocol
MRI was performed on a 1.5 T MR scanner (Siemens Symphony, Erlangen, Germany), using a phased-array pelvic coil. Prior to DCEMR imaging, the protocol included standard T1-weighted (slice thickness: 5 mm, TR/TE = 860/12 ms) and T2-weighted (slice thickness: 5 mm, TR/TE = 3600/102 ms) turbo spin-echo imaging to provide tumor stage, volume and nodal status. The dynamic sequence was a fat-saturated three-dimensional volumetric breath-hold examination (VIBE) with scanning parameters: TR/TE = 4.2/1.88 ms, scan time = 24 s, slab thickness = 135 mm, slice thickness = 2.5 mm3, number of partitions = 54, FOV = 320 mm, giving a voxel size of 1.25×1.25×2.5 mm. Images were acquired prior to and 30, 90, 180 and 480 s after an intravenous bolus injection of 20 ml of gadolinium-DTPA (Omniscan, GE Healthcare, UK) using a power injector, followed by a saline flush of 20 ml NaCl (0.9%).
Image analysis
The tumor was traced in the DCEMR images using the enhancement pattern and T2-weighted images by the involved uro-radiologist (J.R.). The delineated tumor was transferred to IDL (Interactive Data Language v6.2, Research Systems Inc., Boulder, CO), where all further image analyses were performed. In IDL, an additional region-of-interest (ROI) was drawn in three axial slices of the gluteal muscle, avoiding artefacts and large vessels. The tumor volumes were calculated on the basis of voxel dimensions in the DCEMR images and the tumor delineations.
Signal intensity versus time curves were plotted for both tumor and muscle and the time dependence of the relative signal intensity, RSI(t), in each voxel was calculated using the equation
where SI(t) refers to the signal intensity in a post-contrast voxel, which was obtained at four different time points after injection; 30, 90, 180 and 480 s. SI(0) is the signal intensity acquired prior to injection (at time = 0). The area under the RSI(t) curve (AUC) for muscle and tumor was defined as
where t = 30, 90, 180 and 480 s. To account for differences in arterial input between individuals, the normalized area between curves, nABC(t), defined as the area between the tumor and muscle curves divided by the median AUC(t) for muscle, were found.
Statistical analysis
Statistical analysis was performed using SPSS version 15.0 (SPSS Science, Chicago, IL, USA). Extracted DCEMRI parameters were subjected to correlation analysis with tumor volume and clinical, pathological, histological and T2-weighted MR tumor stage using Pearson's correlation test. Significance between variables was assigned at p < 0.05.
Malignancy mapping and IMRT
For DCEMRI parameters showing a significant correlation with tumor stage, three-dimensional malignancy maps for 10 selected patients were generated. As an initial step towards delivery of biological adaptive RT, it was hypothesized that these maps could be used as a biological dose prescription map to investigate the potential use of DCEMRI in RT of bladder cancer. The prescribed dose in a given voxel was, for simplicity, taken as the DCEMRI parameter value. By a simplified simulation procedure, idealized dose distributions from segmented IMRT were adapted to the malignancy maps. The dose distributions were constituted by dose cubes varying in size from 2.5 to 10 mm, mimicking multi-leaf collimators (MLCs) of varying leaf width. The dose level in each cube was found by calculating the median value within the cube in the malignancy maps. The influence of the penumbra on the resulting dose distributions were tentatively accounted for by convolving the adapted dose cubes with a three-dimensional Gaussian kernel of σx=σy=σz=2 mm.
The difference between the prescribed and adapted dose distributions was quantified by the root mean square deviation, RMSD, defined as
where Dp,i is the prescribed dose in voxel i, Da,i is the adapted dose, and N is the number of voxels in the tumor. is the median of the prescribed dose in the tumor.
Results
Tumor volume
Tumor volumes ranged from 0.4 to 139.6 cm3 (median; 8.5, mean±SD; 24.3±34.5). No significant relationships were found either between tumor volume and extracted DCEMRI parameters or between tumor volume and staging ().
Figure 1. Relationship between tumor volume and T stage assessed in T2-weighted MR images (r = − 0.147, p = 0.472).
DCEMRI
Among the estimated image parameters, significant correlations were found between tumor stage assessed in T2-weighted MR images and the normalized area between the tumor and muscle RSI curve evaluated from 0–180 s (nABC180) and 0–480 s (nABC480) (p = 0.047 and p = 0.035, respectively) (). nABC90 was close to being significant (p = 0.111). Clinical, pathological and histological staging did not correlate significantly with any of the DCEMRI derived parameters (data not shown). In , the median nABC480, together with the 2.5 and the 97.5 percentile, is shown for each of the 26 patients. The median nABC480 varied from −0.4 to 16.5, where a positive nABC480 corresponds to a tumor with a higher contrast agent uptake than in the gluteal muscle. shows a pre-contrast image set through the centre of one bladder tumor in all three planes (axial, coronal and sagittal) with a parametrical overlay of nABC480. The figure illustrates the heterogeneous composition of the tumor.
Figure 2. Normalized area between the tumor and muscle contrast uptake curve from 0–480 s, nABC480, correlated significantly with T stage assessed in T2-weighted MR images (r = 0.416, p = 0.035).
Figure 3. Representative axial (upper), coronal (middle) and sagittal (lower) pre-contrast T1-weighted MR images for one bladder cancer patient with parametrical overlay of nABC480.
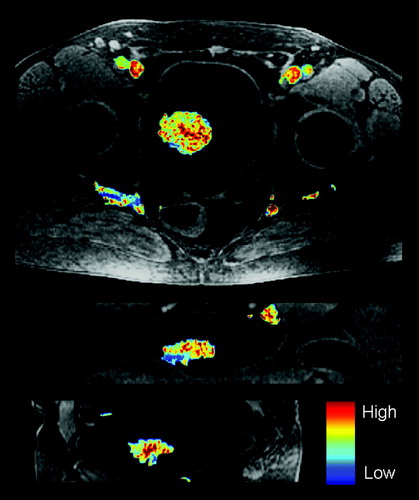
Table I. Median normalized area between the tumor and muscle contrast uptake curve for 0–480 s, nABC480, together with the 2.5 and 97.5 percentiles for the 26 bladder cancer patients.
Biological dose maps
Three-dimensional dose prescription maps and simulated adapted IMRT dose maps were generated based on the parametric nABC480 maps for 10 of the patients. A single axial slice of nABC480 (the dose prescription map) and the corresponding adapted dose maps for three of the tumors are shown in . As apparent, the adapted dose distributions using small dose cubes appear to reflect the prescription map quite well, although penumbra effects tend to dilute the simulated segmented dose delivery. shows the dependence of the RMSD between the prescribed and the adapted dose distributions on the size of the dose cubes. A perfect match corresponds to zero RMSD. For the highest cube resolution (2.5 mm), the RSMD ranged from 0.05 to 0.22. A clear reduction in RMSD is seen when the size of dose cubes is reduced from 10 mm to 2.5 mm. A cube size of 2.5 mm reduces the median RMSD with on average 35% as compared to a cube size of 10 mm. The reduction in RMSD with cube size ranged from 13 to 65%, reflecting large intertumor variations.
Figure 4. Axial nABC480 maps and simulated, adapted dose maps for cube sizes of 2.5, 5 and 10 mm for three different bladder tumors.
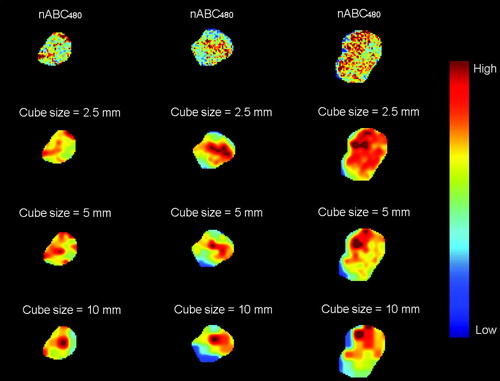
Figure 5. Relative root mean square deviation (RMSD) between the prescribed and the adapted dose distribution as function of varying dose cube size.
Discussion
To our knowledge, this is the first report relating DCEMRI parameters of bladder cancer to tumor volume and staging. In this study, no significant relationship was found between tumor volume and any of the extracted DCEMRI parameters. This could potentially be due to the relatively small cohort of patients included in the study. However, lack of such a correlation has also been reported in other studies, among them in patients with cervical cancer Citation[1], Citation[2], Citation[12]. This indicates an improved diagnostic role of DCEMRI since these parameters indicate biologically related intratumoral information not available in standard, anatomical MRI investigations.
The area under the enhancement curve (AUC) is considered to be independent of alterations in bolus duration and noise and is thought to be related to a combination of blood inflow, perfusion and fraction of tumor interstitial space Citation[13], Citation[14]. AUC is a model-free parameter often used due to its improved robustness and lack of assumptions as compared to more physiologically related pharmacokinetic models. In addition, unlike pharmacokinetic modelling, AUC may be used to derive parameters that relate more directly to the microvasculature Citation[16]. In the well-known Tofts and Kermode pharmacokinetic model Citation[15], AUC results from a combination of the vascular transfer rate (Ktrans) and extravascular extracellular space (ve). Model-based approaches such as the Tofts and Kermode model are generally thought to be more susceptible to noise and fitting errors, and may be less robust. Especially in multicenter clinical trials, there might be large variations in data acquisitions likely to produce differences in pharmacokinetic parameter estimates Citation[13], possibly obscuring the clinical interpretation of DCEMRI data. A model-free approach, such as the AUC, can more easily be implemented across institutions and be successfully compared.
The area between the tumor and muscle enhancement curves normalized to the median uptake in gluteal muscle (nABC) is expected to be a very robust estimate where uncertainties due to differences in both bolus duration and bolus size between individuals are minimized Citation[13], Citation[14]. The use of muscle as a reference tissue has been advocated by others as a true vascular input function since the arterial circulation of contrast agent to tumor is difficult to obtain Citation[17]. In this study, it is shown that nABC180 and nABC480 correlated significantly with tumor stage assessed in T2-weighted MR images. As no other imaging parameters correlated with staging, the current findings indicate the potential of nABC as a predictor of tumor stage.
A high local nABC may indicate a well-vascularized region of high oxygen pressure (pO2), most likely with proliferating cells, which also has been argued previously for comparable parameters derived from DCEMRI Citation[1], Citation[10], Citation[18], Citation[19]. Thus, it may be that low levels of nABC indicate hypoxia, and that nABC maps may be employed in biological image adapted radiotherapy. However, tumor stage is a negative predictor for disease-specific survival following radiotherapy of bladder cancer Citation[20]. As well-oxygenated tumors (suggested to have a high nABC in the current work) are more radiosensitive, it may seem like a paradox that nABC correlated positively with tumor stage in the current work. Nevertheless, a high nABC is likely to reflect an extensive vascular network caused by a high degree of vascular recruitment, thus resulting in an invasive, high stage tumor. This apparent paradox is well illustrated in the work by Loncaster et al. Citation[1], where both descriptive and pharmacokinetic parameters were obtained from DCEMRI of cervix carcinomas. Common to these parameters is that high levels imply high contrast enhancement (as is the case with nABC), and three of the parameters correlated positively with pO2 (p < 0.01). Also, tumor stage was close to being significantly correlated with the ‘A’ pharmacokinetic parameter (p = 0.08). Furthermore, this parameter was correlated with radiotherapy outcome (p = 0.02). Thus, in addition to being positively correlated with tumor stage, it is not unlikely that nABC is positively correlated with both pO2 and patient survival. A controlled clinical study is required to reveal the predictive potential of nABC for radiotherapy outcome of bladder cancer patients.
Delivering a uniform radiation dose distribution to the entire tumor may result in treatment failure since radioresistant tumor cells might receive insufficient radiation dose. If biological intratumoral information can be derived from DCEMRI, tumors with radioresistant regions can be identified and treatment planning strategies using IMRT can be employed to improve the treatment outcome. As opposed to current practice, where the enhancement pattern in DCEMR images is used visually with respect to target volume definition, future approaches should aim at exploiting this information to map physiological parameters of relevance for tumor radiosensitivity.
Based on nABC480, theoretical dose prescription maps were generated for 10 of the bladder cancer patients to evaluate the potential of using segmented IMRT for biologically adapted radiotherapy. In , the intratumoral variation in nABC480, indicated by the 2.5 and 97.5 percentiles, deviated markedly between the tumors, suggesting that some patients (presenting heterogeneous tumors) may benefit from local dose escalation. The dose cubes were introduced in order to simulate varying resolution of multi-leaf collimators in adapted radiotherapy. As apparent from , rather large voxel-to-voxel variations in the dose prescription map (nABC480) were seen. Using the root mean square deviation (RMSD) to evaluate the simulated delivery, a clear reduction in the patient averaged RMSD when using dose cubes of 2.5 mm compared to cubes of 5 and 10 mm was found (). In a previous study, where non-uniform tumor dose distributions using IMRT with 2.5 mm multi-leaf collimators were investigated Citation[5], RMSD and the estimated tumor control probability (TCP) were highly correlated quantities. Thus, RMSD appears to be a suitable metric for evaluating the quality of adapted treatments. The current work indicates that RMSD may be reduced by, on average, 35% by choosing 2.5 over 10 mm MLC resolution. However, heterogeneous tumors presenting scattered, small and radioresistant foci may not be optimally treated even with high resolution adapted radiotherapy.
Current advances in IMRT technology has allowed for realization of dose distributions based on parameters extracted from biologically related images, but controlled patient studies are needed to evaluate the potential benefit of biologically adapted treatments. High spatial resolution of the intensity modulated beams is needed to provide the irregular dose distributions required. It may also be relevant to evaluate the temporal evolution of image parameters during the course of treatment Citation[9], Citation[21], as this may have an impact on the dose prescription map. The situation is further complicated by the considerable geometrical uncertainties taking place during RT (bladder/tumor motion) for the present patient group Citation[22]. Methods to account for such uncertainties Citation[23] would also need to be included to realize the full potential of a biological adaptive RT approach.
In summary, the present study has shown that staging and parameters extracted from DCEMRI of bladder cancer are independent of tumor volume. Furthermore, the normalized area between the tumor and muscle contrast uptake curve (nABC) from 0–180 s and 0–480 s derived from the DCEMRI data correlated significantly with tumor stage. The underlying biological information may be useful for improved radiotherapy planning. Simulations of adapted IMRT based on DCEMR image parameters indicate that the treatment outcome might be increased with high-resolution IMRT for patients showing large intratumoral variations. Declaration of interest: The authors report no conflicts of interest. The authors alone are responsible for the content and writing of the paper.
References
- Loncaster JA, Carrington BM, Sykes JR, Jones AP, Todd SM, Cooper R, et al. Prediction of radiotherapy outcome using dynamic contrast enhanced MRI of carcinoma of the cervix. Int J Radiat Oncol Biol Phys 2002; 54: 759–67
- Gong QY, Brunt JN, Romaniuk CS, Oakley JP, Tan LT, Roberts N, et al. Contrast enhanced dynamic MRI of cervical carcinoma during radiotherapy: Early prediction of tumour regression rate. Br J Radiol 1999; 72: 1177–84
- Horsman MR, Overgaard J. Basic clinical radiobiology. 2nd ed. London: Arnold; 1997. p 132–141.
- Bentzen SM. Radiation therapy: Intensity modulated, image guided, biologically optimized and evidence based. Radiother Oncol 2005; 77: 227–30
- Malinen E, Søvik Å, Hristov D, Bruland ØS, Olsen DR. Adapting radiotherapy to hypoxic tumours. Phys Med Biol 2006; 51: 4903–21
- Tomé WA, Fowler JF. Selective boosting of tumor subvolumes. Int J Radiat Oncol Biol Phys 2000; 48: 593–9
- Wang JZ, Li XA. Impact of tumor repopulation on radiotherapy planning. Int J Radiat Oncol Biol Phys 2005; 61: 220–7
- Tomé WA, Fowler JF. On the inclusion of proliferation in tumour control probability calculations for inhomogeneously irradiated tumours. Phys Med Biol 2003; 48: N261–N268
- Søvik Å, Malinen E, Skogmo HK, Bentzen SM, Bruland ØS, Olsen DR. Radiotherapy adapted to spatial and temporal variability in tumor hypoxia. Int J Radiat Oncol Biol Phys 2007; 68: 1496–504
- Lyng H, Vorren AO, Sundfør K, Taksdal I, Lien HH, Kaalhus A, et al. Assessment of tumor oxygenation in human cervical carcinoma by use of dynamic Gd-DTPA-enhanced MR imaging. J Magn Reson Imaging 2001; 14: 750–6
- , UICC (International Union Against Cancer)Hermanek P, Hutter RVP, Sobin LH, Wagner G, Wittekind C. TNM-Atlas. 4th ed. Berlin: Springer Verlag; 1997. p 309–314.
- Haider MA, Sitartchouk I, Roberts TPL, Fyles A, Hashmi AT, Milosevic M. Correlations between dynamic contrast-enhanced magnetic resonance imaging-derived measures of tumor microvasculature and interstitial fluid pressure in patients with cervical cancer. J Magn Reson Imaging 2007; 25: 153–9
- Evelhoch JL. Key factors in the acquisition of contrast kinetic data for oncology. J Magn Reson Imaging 1999; 10: 254–9
- Evelhoch JL, LoRusso PM, He Z, DelProposto Z, Polin L, Corbett TH, et al. Magnetic resonance imaging measurements of the response of murine and human tumors to the vascular-targeting agent ZD6126. Clin Cancer Res 2004; 10: 3650–7
- Tofts PS, Brix G, Buckley DL, Evelhoch JL, Henderson E, Knopp MV, et al. Estimating kinetic parameters from dynamic contrast-enhanced T1-weighted MRI of a diffusible tracer: Standardized quantities and symbols. J Magn Reson Imaging 1999; 10: 223–32
- Walker-Samuel S, Leach MO, Collins DJ. Evaluation of response to treatment using DCE-MRI: The relationship between initial area under the gadolinium curve (IAUGC) and quantitative pharmacokinetic analysis. Phys Med Biol 2006; 51: 3593–602
- Yankeelov TE, Luci JJ, Lepage M, Li R, Debusk L, Lin PC, et al. Quantitative pharmacokinetic analysis of DCE-MRI data without an arterial input function: A reference region model. Magn Reson Imaging 2005; 23: 519–29
- Zahra MA, Hollingsworth KG, Sala E, Lomas DJ, Tan LT. Dynamic contrast-enhanced MRI as a predictor of tumour response to radiotherapy. Lancet Oncol 2007; 8: 63–74
- Yamashita Y, Baba T, Baba Y, Nishimura R, Ikeda S, Takahashi M, et al. Dynamic contrast-enhanced MR imaging of uterine cervical cancer: Pharmacokinetic analysis with histopathologic correlation and its importance in predicting the outcome of radiation therapy. Radiology 2000; 216: 803–9
- Robinson P, Collins CD, Ryder WDJ, Carrington BM, Hutchinson CE, Bell D, et al. Relationship of MRI and clinical staging to outcome in invasive bladder cancer treated by radiotherapy. Clin Radiol 2000; 55: 301–6
- Nehmeh SA, Lee NY, Schröder H, Squire O, Zanzonico PB, Erdi YE, et al. Reproducibility of intratumor distribution of (18)F-fluoromisonidazole in head and neck cancer. Int J Radiat Oncol Biol Phys 2008; 70: 235–42
- Muren LP, Smaaland R, Dahl O. Organ motion, set-up variation and treatment margins in radical radiotherapy of urinary bladder cancer. Radiother Oncol 2003; 69: 291–304
- Redpath AT, Muren LP. CT-guided intensity-modulated radiotherapy for bladder cancer: Isocentre shifts, margins and their impact on target dose. Radiother Oncol 2006; 81: 276–83