Abstract
Introduction. Increased expression of cytosine deaminase (CD) and uracil phosphoribosyltransferase (UPRT) may improve the antitumoral effect of 5-fluorouracil (5-FU) and 5-fluorocytosine (5-FC), and thereby enhance the potential of gene-directed enzyme prodrug therapy. For the applicability of gene-directed enzyme prodrug therapy in a clinical setting, it is essential to be able to monitor the transgene expression and function in vivo. Thus, we developed a preclinical tumor model to investigate the feasibility of using magnetic resonance spectroscopy and optical imaging to measure non-invasively CD and UPRT expression and function. Materials and methods. Expression vectors of CD or CD/UPRT fused to monomeric DsRed (mDsRed) were constructed and rat prostate carcinoma (R3327-AT) cell lines stably expressing either CD/mDsRed or CD/UPRT/mDsRed were generated. The expression of the fusion proteins was evaluated by flow cytometry, fluorescence microscopy, and Western blot analysis. The function of the fusion protein was confirmed in vitro by assessing 5-FC and 5-FU cytotoxicity. In vivo fluorine-19 magnetic resonance spectroscopy (19F MRS) was used to monitor the conversion of 5-FC to 5-FU in mice bearing the R3327-CD/mDsRed and R3327-CD/UPRT/mDsRed tumor xenografts. Results. Sensitivity to 5-FC and 5-FU was higher in cells stably expressing the CD/UPRT/mDsRed fusion gene than in cells stably expressing CD/mDsRed alone or wild-type cells. Whole tumor 19F MRS measurements showed rapid conversion of 5-FC to 5-FU within 20min after 5-FC was administered intravenously in both CD/mDsRed and CD/UPRT/mDsRed tumors with subsequent anabolism to cytotoxic fluoronucleotides (FNucs). CD/UPRT/mDsRed tumor was more efficient in these processes. Conclusion. This study demonstrates the utility of these tumor models stably expressing CD or CD/UPRT to non-invasively evaluate the efficacy of the transgene expression/activity by monitoring drug metabolism in vivo using MRS, with potential applications in preclinical and clinical settings.
Gene-directed enzyme prodrug therapy, or alternatively called suicide gene therapy, is designed to improve the selectivity of cancer treatment. In general, a non-mammalian gene encoding a certain enzyme is transduced into tumor cells, and the expression of this enzyme catalyzes the activation of a prodrug to a cytotoxin inducing tumor cell death Citation[1]. One of the best-characterized suicide gene therapy strategies utilizes cytosine deaminase CD/UPRT fusion gene, which has been used in clinical gene therapy trials Citation[2], Citation[3]. CD is found in bacteria and fungi but not in mammalian cells, and it converts the anti-fungal agent 5-fluorocytosine (5-FC) which has low toxicity in humans, to the potent chemotherapeutic agent 5-fluorouracil (5-FU), which is then catalyzed by cellular enzymes to fluoronucleotides (FNucs), such as 2’-deoxy-5-fluorouridine mono-, di- and tri-phosphates (FdUMP, FdUDP and FdUTP) and 5-fluorouridine-5'-mono-, di-and tri-phosphates (FUMP, FUDP, FUTP) Citation[4] which subsequently inhibit DNA or RNA synthesis. Certain tumor cells are not sensitive to or become resistant to 5-FU because of the low efficiency in the conversion of 5-FU to its toxic metabolites. Introducing the gene for uracil phosphoribosyltransferase (UPRT) from bacteria or yeast, which directly converts 5-FU into 5-FUMP, may improve the anti-tumoral effect of 5-FU Citation[5]. Simultaneous expression of CD and UPRT has been demonstrated to significantly increase the sensitivity of cancer cells to 5-FC in vitro and improve tumor control in vivo Citation[6], Citation[7].
One major difficulty in developing suicide gene therapy systems is the inability to accurately assess the transduction efficiency of the therapeutic gene, the biological function of the transgene, and the status of prodrug activation. Several approaches are being developed to establish clinically applicable noninvasive imaging techniques to monitor gene expression and enzyme activities, such as positron emission tomography (PET), magnetic resonance imaging (MRI) and optical imaging, among others Citation[8–10]. These molecular imaging methodologies are essentially non-invasive, obviating the need for biopsies before and during treatment. Furthermore, these methods provide the opportunity to detect tumors at many sites of the body and enable the direct comparison with healthy tissue.
Fluorescence and bioluminescence imaging are two of the methods often used to measure the expression of reporter genes and proteins. Fluorescent proteins such as green fluorescent protein (GFP) and red fluorescent protein (e.g. Discoroma sp. red fluorescent protein, DsRed) have properties well suited as reporters of suicide gene therapy, specifically when they are fused with therapeutic genes Citation[11], Citation[12]. This approach has several advantages for designing certain suicide gene therapy vectors and tumor models. First, cells expressing the gene product can be rapidly isolated from a pool of transfected cells using fluorescence-activated cell sorting (FACS). Secondly, the intracellular protein expression can be readily detected in live cells without the need for fixation and specific antibodies. Furthermore, in vivo tracking of live, transduced cells is facilitated. Several years ago, a monomeric version of DsRed that maintained spectral properties similar to the dimerized DsRed had been generated Citation[13] and its use as a better fusion tag has been validated using a variety of proteins with diverse functions and subcellular localizations Citation[14], Citation[15]. However, one disadvantage of optical imaging is the modest depth penetration thereby limiting the tissues that could be studied clinically.
Another important molecular imaging technique is magnetic resonance spectroscopy (MRS) which is an effective, non-invasive method for monitoring the expression and function of CD, and CD/UPRT in vivo. Fluoropyrimidines are ideal candidates for the direct detection of metabolites using 19F MRS. The stable isotope 19F has a natural abundance of 100%, a MR receptivity of 83% of that of 1H and no background signal from endogenous fluorine containing compounds, making 19F MRS a viable option for MR studies on patients. 19F MRS has previously been proven useful for monitoring the metabolism and pharmacokinetics of 5-FU and other fluorinated drugs in animal models and cancer patients Citation[16], Citation[17]. Conversion of 5-FC to 5-FU in xenograft tumors expressing CD has been reported using this technique Citation[18]. Increased prodrug activation has also been monitored with 19F MRS in tumors expressing CD/UPRT Citation[19]. A recent report has demonstrated the feasibility of mapping the regions wherein CD/UPRT is expressed in a preclinical model Citation[9].
Fusion of the mDsRed fluorescent protein with CD and UPRT will provide meaningful models that allow optical imaging and MRS to be combined during the course of the same study and harness the best features and utilities of each modality. In this study, we developed a preclinical tumor model to investigate the feasibility of using MRS and optical imaging to measure non-invasively the expression and function of CD and UPRT. Obtaining these preclinical data is important to evaluate the feasibility for clinical application.
Materials and methods
Cell culture
African green monkey kidney Cos7 cells (obtained from American Type Culture Collection, Manassas, VA) and Dunning R3327-AT rat prostate adenocarcinoma cells (obtained from J. Donald Chapman, CRM Consulting Services, Penticton, BC, Canada) were maintained in Dulbecco's Modified Eagle medium (DMEM; Mediatech, Herndon, VA) supplemented with 10% fetal bovine serum (Gemini, West Sacramento, CA), 100 U/ml penicillin and 100µg/ml streptomycin (Gemini). All cells were grown as monolayers at 37°C in a humidified atmosphere of 5% CO2 and 95% air.
Construction of plasmids and transfection
The cDNA, encoding the CD gene (of Saccharomyces cervisiae) and CD/UPRT fusio gene (UPRT of Haemophilus influenzae), was obtained by PCR amplification of the SFG retroviral vector Citation[9]. The PCR products were digested with ApaI and AgeI, separated in 1% agarose gel and purified with the Gel Extraction Kit (QIAGEN, Santa Clarita, CA). Expression plasmid of pDsRed-momomer-Hyg-N1 (Clontech, Mountain View, CA), which encodes DsRed-Monomer (mDsRed) Citation[14], a monomeric mutant derived from the tetrameric DsRed, was digested with ApaI and AgeI, then treated with calf intestinal alkaline phosphatase at 37°C for 3 h and served as vector. The purified PCR products were ligated to the multiple cloning sites positioned between the immediate early promoter of cytomegalovirus (CMV) and the DsRed-momomer coding sequence in the pDsRed-momomer-Hyg-N1 vector. The resulting plasmids contain the fusion genes of CD/mDsRed or CD/UPRT/mDsRed and a hygromycin B resistance gene for the selection of stable transfectants.
To test the function of the constructed expression plasmids, Cos7 cells were transiently transfected with plasmids containing pCMV-mDsRed, pCMV-CD/mDsRed or pCMV-CD/UPRT/mDsRed respectively using Lipofectamine2000 (Invitrogen, Carlsbad, CA) according to the manufacturer's instructions. The cells were trypsinized 24 h after transfection and a single cell suspension prepared. Half of these cells were placed into 4-chamber slides to visualize the mDsRed signal by fluorescence microscopy, and mDsRed protein expression was quantified in the other half of these cells using flow cytometry. Cell lysates were prepared from duplicate cell cultures 24 h after transfection for Western blot analysis.
Generation of stable cell lines containing dual reporter genes: Transfection and clonal isolation
R3327-CD/mDsRed and R3327-CD/UPRT/mDsRed cell lines were generated by transfecting R3327-AT cells with plasmids, pCMV-CD/mDsRed or pCMV-CD/UPRT/mDsRed using Lipofectamine2000 for 24 h and subsequently followed by culturing cells in medium containing Hygromycin B (0.2 mg/ml; Roche, Mannheim, Germany). Stable transfectants were selected and further enriched based on the expression of mDsRed by fluorescence activated cell sorting (FACS) using a MoFlo™ cell sorter (Dako, Carpinteria, CA). Single-cell-derived clones were obtained by seeding the mDsRed-positive cells into the 96-well plates (1cell/well). Individual positive colonies were isolated, further identified by flow cytometry, expanded and transferred to mini-vials for liquid nitrogen storage.
Western blot
To measure the protein expression of CD, UPRT and mDsRed, protein samples (20 µg) from transiently transfected Cos7 cells, stably transfected R3327-CD/mDsRed and R3327-CD/UPRT/mDsRed cells were analyzed by Western blotting Citation[20]. The sheep anti-yCD polyclonal antibody (1:200) was purchased from Biotrend (Cologne, Germany) and the anti-DsRed polyclonal antibody from Clontech (Mountain View, CA). The secondary antibodies used were the horseradish peroxidase-labeled bovine anti-sheep IgG (1/1000, Santa Cruz, Santa Cruz, CA) or sheep anti-rabbit IgG (Pierce, 1/1000, Rockford, IL), respectively. The protein expression was visualized using the Supersignal chemiluminescent substrate (Pierce, Rockford, IL).
Fluorescence microscopy
Transiently transfected Cos7 cells and stably transfected R3327-AT cells were plated onto 4-chamber slides. After cell attachment, the cells were washed once with 1xPBS (phosphate buffered saline) and fixed with 4% paraformaldehyde for 10 minutes and washed again with 1xPBS and distilled water.
To assess mDsRed expression of tumor xenografts, the animals were sacrificed after 19F MR spectroscopy, the whole R3327-CD/mDsRed tumors and R3327-CD/UPRT/mDsRed tumors were excised and frozen in OCT embedding matrix (Shandon Lipshaw, Pittsbrugh, PA). Frozen tissue sections (8 µm thick) were obtained with an OTF cryomicrotome (Bright-Hacker, Fairfield, NJ). The expression of mDsRed was measured by fluorescence microscopy.
Fluorescence images of cultured cells and unfixed tumor sections were taken at × 200 (for cells) or × 50 magnification (for tumor sections) using a fluorescence microscope (Axio2Imaging, Zeiss) equipped with a cooled charge-coupled device digital camera, a computer-controlled motorized stepping stage, a 575±50 nm filter for mDsRed and Metamorph Imaging software (Version 7.0; Molecular Devices Co. Sunnyvale, CA).
Flow cytometry
The expression of mDsRed in transiently transfected Cos7 cells and stably transfected R3327-CD/mDsRed and R3327-CD/UPRT/mDsRed cells was determined using the 568 nm laser line of the MoFlo™ cell sorter. Cells were trypsinized, prepared as single cell suspension, centrifuged and resuspended in 1xPBS at 4°C. Parental Cos7 and R3327-AT cells were used as negative controls. Only viable, single cells were included for FACS analysis. The gate for positive red fluorescence was set to include no more than 1% of corresponding control cells. The mean red fluorescence intensity per cell was used as a measure of mDsRed expression in the cells.
5-FC and 5-FU in vitro cytotoxicity
The sensitivity of R3327-AT, R3327-CD/mDsRed, and R3327-CD/UPRT/mDsRed cells to 5-FC and 5-FU was determined using the clonogenic colony formation assay. Cells (1×10⁶) were plated 24 h prior to the prodrug treatment in 60 mm Petri dishes. Cells were treated with 5-FC or 5-FU (InvivoGen, San Diego, CA) at various concentrations for 24 h. After the drug treatment, cells were trypsinized, counted, serially diluted, and plated into 60 mm Petri dishes. After incubation for 10–14 days, colonies were fixed, stained with crystal violet, and counted Citation[20]. Surviving fractions were normalized to the plating efficiency of untreated controls. Cytotoxicity was assessed using cell survival curves in which the percentage of cells that survive a given treatment is plotted as a function of prodrug concentration using Sigmaplot (Systat Software, San Jose, CA). LD50 and LD90 values (concentration of 5-FU or 5-FC required to inhibit colony formation by 50% and 90%) were calculated from the survival curves.
Animal Models
R3327-AT (2×10⁶), R3327-CD/mDsRed (5×10⁶), and R3327-CD/UPRT/mDsRed (5×10⁶) cells suspended in 0.1 ml 1x PBS were implanted subcutaneously into the lateral side of the right hind leg of male athymic nude mice (Nu/Nu; NCI, Frederick, MD). Tumor sizes of 200–400 mm3 were used for in vivo 19F MRS measurements. All mice were kept in accordance with the protocols approved by the Institutional Animal Care and Use Committee of Memorial Sloan Kettering Cancer Center.
In vivo 19F MRS
In vivo MRS was performed using a Bruker 7T spectrometer with a 31 cm wide horizontal bore magnet. An i.v. catheter was inserted into the tail vein of the mice to allow 5-FU or 5-FC to be administered after positioning the animals inside the magnet and after shimming. Mice were kept anesthetized during the MR measurements with isoflurane mixed in 100% oxygen administered through a nose cone as described previously Citation[21]. A home built two-turn radiofrequency solenoid coil with a diameter of 12 mm was used to collect MRS data. The mouse was placed in an animal holder (60 ml syringe barrel) and the leg carrying the tumor positioned inside the MR coil. The MR coil was immersed in a waterbath maintained at a temperature of 37°C to maintain the animal's body temperature and also to minimize magnetic susceptibility effects Citation[22]. The complete set-up was positioned in the magnet and the MR coil was tuned to the fluorine resonance frequency. Shimming was performed using the 1H MR signal of water to optimize the magnetic field homogeneity resulting in a water linewidth of 40–70 Hz. A ParaVision 3.0.2 PVM ONEPULSE sequence (Bruker) was used to acquire in vivo 19F MRS. Fluorine-19 MR spectra were acquired before the injection of 150 mg/kg 5-FU and 150 mg/kg 5-FC (baseline) and then sequentially for a maximum of 2 h. Fluorine-19 MRS acquisition variables included a 60° pulse angle, a repetition time (TR) of 1 s, a sweep width of 15 000 Hz, an acquisition size of 1024 points and averaging of 600 scans (temporal resolution ∼ 10 min). The MR time domain signal was Fourier transformed after applying a line broadening of 30 Hz. Spectral assignments of peaks observed were based upon chemical shifts previously described Citation[23].
Results
Generating stable cells lines expressing CD/mDsRed and CD/UPRT/mDsRed
The expression efficiency of the constructed plasmids containing CD/mDsRed and CD/UPRT/mDsRed driven by CMV promoter was first assessed by transient transfection of these plasmids into Cos7 cells, and comparing these to controls (non-transfected cells or cells transfected with plasmid only containing mDsRed (pCMV-mDsRed)). The gene expression at the protein level was then analyzed by Western blot, flow cytometry and fluorescent microscopy. As demonstrated by FACS analysis (A, left panel), transient transfection of Cos7 cells with the expression vectors pCMV-mDsRed, pCMV-CD/mDsRed or pCMV-CD/UPRT/mDsRed resulted in a significant increase in red fluorescence. Whereas below 0.2% of non-transfected Cos7 cells contributed to a low background red fluorescence signal, 61% of mDsRed-transfected cells, 57% of CD/mDsRed-transfected cells, or 31.3% of CD/UPRT/mDsRed-transfected cells displayed red fluorescence with the mean fluorescence intensity of 1579, 379 or 60.2, respectively (A left panel). Under the microscope, red fluorescence positive cells can be found from each group, with lower fluorescence intensity and positive ratio in CD/UPRT/mDsRed transfected cells (B, left panel).
Figure 1. Fusion protein expression in transiently tranfected Cos7 cells and stably transfected R3327-CD/mDsRed or R3327-CD/UPRT/mDsRed cells. A: Flow cytometric analysis. B: Fluorescent imaging of cells in tissue culture (magnification: 200×) demonstrating expression of the fusion protein of CD/mDsRed and CD/UPRT/mDsRed. C: Western blot (Line 1: parental; 2: mDsRed; 3: CD/mDsRed; 4: CD/UPRT/mDsRed). D: Fluorescent imaging of representative tumor sections (8 µm thickness, magnification: 50×) showing the constituous expression of the fusion proteins CD-mDsRed and CD/UPRT-mDsRed in R3327-CD/mDsRed and R3327-CD/UPRT/mDsRed tumors but not in tumors grown from parental cells.
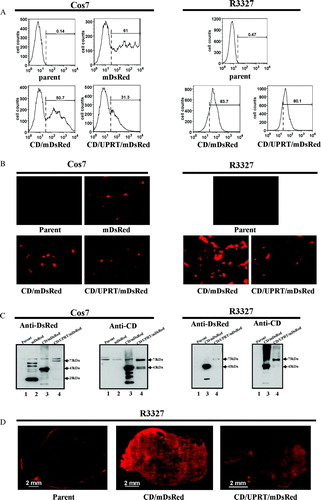
To generate stable cell lines, R3327-AT cells were stably transfected with corresponding plasmids and selected in medium containing Hygromycin B. The mDsRed-positive cells were selected and further enriched with the FACS, and individual clones were isolated. A total of 11 clones expressing CD/mDsRed and 8 clones expressing CD/UPRT/mDsRed were successfully established. The protein expression profile determined by Western blot, fluorescent microscopy and flow cytometry analysis was similar in these clones, and therefore one from each group was selected for further experiments. The mDsRed expression profile of these selected clones as obtained by FACS and fluorescence microscopy are shown respectively in A (right panel) and 1B (right panel).
Expression of fusion proteins detected by Western blot
To examine the fusion gene expression at the protein level, cellular proteins from transiently transfected Cos7 cells, R3327-CD/mDsRed and R3327-CD/UPRT/mDsRed cells were analyzed by Western blot using antibodies specific to yeast CD or DsRed (C). Immunoblot analysis with DsRed-specific polyclonal antibody showed a 28-kDa band in Cos7 mDsRed samples, a 43-kDa band in Cos7-CD/mDsRed and R3327-CD/mDsRed samples, and a 73-kDa band in Cos7-CD/UPRT/mDsRed and R3327-CD/UPRT/mDsRed samples respectively. Analysis with anti-CD antibody revealed a 43-kDa band in Cos7-CD/mDsRed and R3327-CD/mDsRed samples, and a 73-kDa band in Cos7-CD/UPRT/mDsRed and R3327-CD/UPRT/mDsRed samples. These signals corresponded to the predicted sizes of mDsRed, CD/mDsRed and CD/UPRT/mDsRed proteins respectively.
Fusion protein expression detected with fluorescence imaging and flow cytometry in stably transfected cells and xenografts
To further evaluate the stable expression of these established cell lines expressing fusion proteins, the intracellular distribution of mDsRed fluorescence was examined in R3327-AT cells stably expressing CD/mDsRed or CD/UPRT/mDsRed by fluorescence microscopy. Significant red fluorescence signal could be found both in R3327-CD/mDsRed and R3327-CD/UPRT/mDsRed cells, with the signal in CD cells slightly higher than that in CD/UPRT cells (B, right panel). Using fluorescence microscopy, the red fluorescence could also be detected in the sections of tumors arising from R3327-CD/mDsRed and R3327-CD/UPRT/mDsRed cells. Similar to the in vitro results described above, the red fluorescence signal in R3327-CD/mDsRed tumors was also higher than that in R3327-CD/UPRT/mDsRed tumors (D).
Flow cytometric analysis results confirmed the microscopic findings: the red fluorescence positive to negative cell ratios in these two cell lines are similar (>80%), while there were less than 0.5% mDsRed-positive parental cells (A, right panel). The mean fluorescence intensity of CD and CD/UPRT cells were 72.2 and 49, respectively.
Expression of CD and CD/UPRT leads to increased cytotoxicity of 5-FC and 5-FU in vitro
To functionally characterize the activity of the CD and UPRT enzymes expressed in the clonal cell lines R3327-CD/mDsRed and R3327-CD/UPRT/mDsRed, we compared the sensitivity of these cell lines to 5-FC and 5-FU to the sensitivity of the parental R3327-AT cell line. As depicted in A, 24 h treatment of 5-FU (at a dose >2 µg/ml) was cytotoxic to both wild-type (LD50: 1.71±0.18 µg/ml, LD90: 7.64±0.81 µg/ml) and CD-expressing cells (LD50: 1.030±0.066 µg/ml; LD90: 3.41±0.20 µg/ml). Presumably due to the more efficient conversion of 5-FU to 5-FUMP by UPRT, CD/UPRT-expressing cells were more potently sensitized to 5-FU compared to CD-expressing cells, with an 18-fold decrease in LD50 to 0.0580±0.0090 µg/ml and a 23-fold shift in LD90 to 0.150±0.017 µg/ml (A). As shown in B, wild-type R3327-AT cells were not sensitive to 5-FC even at a concentration of 100 µg/ml, whereas R3327-CD/mDsRed cells and R3327-CD/UPRT/mDsRed cells were sensitive to 5-FC in a dose-dependent manner. Furthermore, R3327-CD/UPRT/mDsRed cells were more sensitive to 5-FC than R3327-CD/mDsRed cells, as the LD50 and LD90 values for CD cells (9.28±1.14 µg/ml and 30.2±2.4 µg/ml) were 31 and 27 times larger than those for CD/UPRT cells (0.30±0.17 µg/ml and 1.13±0.50 µg/ml).
Figure 2. 5-FU (A) or 5-FC (B) cytotoxicity in R3327-AT cells expressing CD/mDsRed and CD/UPRT/mDsRed compared to parental cells. Cells were treated with the indicated concentrations of 5-FU or 5-FC and survival was determined using colony formation assay. Surviving fractions were normalized by the plating efficiency of untreated controls. Each data point and error bars represent average and SE of three independent experiments.
In vivo 19F MRS following the metabolism of 5-FC and 5-FU
In vivo 19F MRS measurements of the conversion of 5-FC to 5-FU and the metabolism of 5-FU were performed on mice bearing wild-type tumors, tumors expressing CD/mDsRed alone, or tumors expressing CD/UPRT/mDsRed. (upper panel) displays stacked 19F MR spectra of the R3327-AT parental tumor (A), R3327-CD/mDsRed tumor (B) and R3327-CD/UPRT/mDsRed tumors (C) each from a representative single animal after a bolus injection of 150 mg/kg 5-FU (i.v). The 19F MR spectra were acquired sequentially for up to 2 h after 5-FU injection with each individual spectrum representing a 10 min acquisition. The 5-FU signal was visible throughout the time course of data acquisition ( upper panel). No FNuc was detected in the R3327-AT (n = 4) parental tumor. Anabolism of 5-FU produced a small FNuc peak (4.8-5 ppm), which was observable 20–40 min after 5-FU administration in all three R3327-CD/mDsRed tumors and in all the R3327-CD/UPRT/mDsRed (n = 4) tumors and continued to accumulate up to 2 h in the latter. The 5-FU catabolites FUPA (-17.2 ppm, α-fluoro-ureidopropionic acid) and FBAL (-19.0 ppm, α-fluoro-β-alanine) were detectable in all transected tumors approximately 40 min after administration of 5-FU and accumulated during the time course of the study.
Figure 3. Representative, 1D 19F MR spectra of the whole tumor, demonstrating the uptake and metabolism of 5-FU (upper panel) and 5-FC (lower panel) in R3227-AT parental tumors (A, D), R3327-CD/mDsRed tumors (B, E), and R3327-CD/UPRT/mDsRed tumors (C, F). Each MR spectrum was averaged over 600 acquisitions (acquisition time 10 min/spectrum). The start of the acquisition coincided with the i.v. injection of 150 mg/kg 5-FC or 5-FU via a tail vein catheter. The chemical shift of 5-FU is normalized to 0 ppm with 5-FC at 1 ppm and FNuc at 4.8-5 ppm. Signal assigned are: 5-FU, 5-fluorouracil; 5-FC, 5-fluorocytosine; FNuc, fluoronucleotides; FUPA, α-fluoro-ureidopropionic acid; FBAL, α-fluoro-β-alanine.
After administration of a bolus i.v. dose of 150 mg/kg 5-FC, the conversion of 5-FC to 5-FU was followd by the production of FNuc in R3327-CD/mDsRed and R3327-CD/UPRT/mDsRed tumors (, lower panels). Wild-type R3327-AT tumors did not metabolize 5-FC (n = 4, D). Rapid conversion of 5-FC to 5-FU was seen in R3327-CD/mDsRed (E) and R3327-CD/UPRT/mDsRed tumors (F) within 20 min after 5-FC administration with the 5-FU levels decreasing afterwards. FNuc was detected 20 min after administration of 5-FC in one of four R3327-CD/mDsRed tumors and in all R3327-CD/UPRT/mDsRed tumors (n = 3) and continued to accumulate throughout the experiment (∼2 h). No downstream catabolites of 5-FU (FUPA and FBAL) were detected in any of these tumors.
Discussion
The objective of this study was to develop cell lines and animal xenograft models, in which the expression and function of fusion genes CD/mDsRed and CD/UPRT/mDsRed can be detected with optical imaging and MRS. These models provide a simple, reproducible means for selection, detection and characterization of cells transfected with genes encoding specific enzymes for prodrug activation, and allow us to compare the efficacy of 5-FU and 5-FC treatment in these cells. To achieve this goal, we constructed expression vectors containing CD or CD/UPRT fused with mDsRed driven by a CMV promoter, and established cell lines stably expressing these fusion genes. Our results demonstrated the advantages of multi-modality imaging using CD/mDsRed or CD/UPRT/mDsRed fusion reporter systems whose transgene products can be assessed by non-invasive imaging methods. The expression/activity of CD or CD/UPRT subunit can be detected with MRS, and the mDsRed subunit facilitates optical fluorescence imaging (both in vitro and in vivo), flow cytometric analysis and FACS. These fusion genes can also be used as therapeutic-marker gene constructs, with mDsRed as a marker gene, and CD (or CD/UPRT) as both a therapeutic and a marker gene since drugs activated by them are cytotoxic and the prodrug metabolic products can be detected in vitro and in vivo using MRS.
Optical imaging technologies based on fluorescent proteins produced in nature have been applied widely in reporter imaging, allowing efficient, non-invasive and rapid assessment of transgene expression in pre-clinical small animal models. The advantages of generating fusion fluorescent proteins and marker/therapeutic proteins have been demonstrated in our study. First, mDsRed-expressing cells can be rapidly isolated from a pool of transfected cells by FACS, which avoids labor-intensive and time-consuming drug selection and colony isolation. This is important when the transfection efficiency is relative low, as in R3327-AT cells only 5% cells expressed fluorescence after transfection and hygromycin B selection. However, the red fluorescence positive ratio increased to 30% after enrichment with FACS, and this process significantly facilitated the establishment of stable cell lines. Second, as shows, the fluorescence enables direct detection of transgene expression in living cells and whole tumors. Therefore, the need for time-consuming immunocytochemistry and histochemistry for the detection of transgene expression can be avoided. The long-term expression of fusion proteins in stable cell lines can also be easily monitored with fluorescence microscopy and flow cytometric analysis. Third, in this study, we used mDsRed as an alternative to green fluorescent protein (GFP) in the construction of fluorescent-tagged fusion proteins. The monomeric DsRed simultaneously overcomes the three critical problems associated with the wild-type tetramer of DsRed. Specifically, it is a monomer, it matures rapidly, and it has minimal emission when excited at wavelengths optimal for GFP Citation[14]. These features make it one of the most suitable red fluorescent proteins for the construction of fusion proteins and multicolor labeling in combination with GFP. At present, we are establishing stable cell lines simultaneously expressing HSV-TK/eGFP and CD/mDsRed or CD/UPRT/mDsRed, and pilot studies demonstrate that both TK/eGFP and CD/UPRT/mDsRed can be detected simultaneously using fluorescent microscopy and FACS (data not shown). The availability of these cell lines will provide valuable tools for multimodality molecular functional imaging including PET, MRS and optical imaging (unpublished data).
This study demonstrates that 19F MRS can monitor the transgene activity of CD and CD/UPRT in vivo following treatment with 5-FU or 5-FC (). This is evidenced by the intratumoral conversion of 5-FU to cytotoxic FNucs or 5-FC to 5-FU with the subsequent production of FNucs for up to 2 h following 5-FC administration in both R3327-CD and R3327-CD/UPRT tumors, but not in parental tumors. Moreover, rapid metabolism of 5-FU to FNuc was found in R3327-CD/UPRT tumors after injection of 5-FC. This finding is consistent with our results of the in vitro cytotoxicity assay shown in , and also supports previous studies demonstrating the combination of CD and UPRT added an additional enzymatic activation which sensitized transduced cells to 5-FC Citation[7], Citation[19]. In contrast to a relatively short tumor retention of 5-FU in Walker256 tumors Citation[9], prolonged tumor retention of 5-FU and 5-FC were seen in the R3327 tumor models, suggestive of intratumoral trapping of 5-FU and 5-FC. Recently, using a CD/UPRT(+)/CD/UPRT(−) co-transplanted tumor xenograft, Gade et al. showed that MRS imaging enabled the generation of anatomically accurate maps of the intratumoral heterogeneity in enzyme activity Citation[9].
A major limitation of in vivo MRS (which includes use of 19F MRS) is the lack of sensitivity which is dependent upon a number of factors including but not limited to the magnetic field strength. The detection limits for in vivo 19F MRS of 5-FU and its metabolites has been estimated to be around 100 µM for a 30 min acquisition time, which is tolerable for patient, on a 1.5T scanner Citation[24] and 50 µM for a 1 h acquisition time on a 11.7T vertical bore magnet Citation[17]. The availability of higher field strength magnets at 3T to 9T that are currently used for clinical studies can therefore improve sensitivity.
CD alone or combined with UPRT has been studied pre-clinically as therapeutic genes Citation[7], Citation[19], Citation[25]. With new fusion gene vectors, we found that CD and UPRT fused with mDsRed retain excellent enzyme activity. In earlier reports, CD derived from E.coli was used in CD/5-FC systems. Subsequently, it was demonstrated that the biochemical affinity for conversion of 5-FC to 5-FU by CD derived from yeast is more than 250-fold higher than that of the CD from bacteria, and the high catalytic efficiency of yeast CD (yCD) enhances 5-FC cytotoxicity and potentiates tumor growth inhibition Citation[26]. Based on these experiments, we chose to clone the yCD in our expression vectors, and our results showed high 5-FC cytotoxicity in R3327-AT cells expressing yCD (B). The 5-FC cytotoxicity in yCD-cells could be further improved with co-transfecting UPRT or with CD/UPRT fusion genes Citation[7], Citation[19]. Our results showed that the sensitivity of CD/UPRT-expressing cells to 5-FC and 5-FU was much higher than those of CD-expressing cells, which are consistent with the report from others Citation[19]. The improvement of in vitro 5-FC cytotoxicity and in vivo tumor control was also reported by others using adenovirus-mediated expression of CD combined with UPRT in different tumor models Citation[7], Citation[25]. The feasibility of adenovirus-mediated suicide gene therapy using CD/UPRT, and guided by multimodality functional MRS/optical imaging needs to be investigated further in a preclinical setting.
In conclusion, the presented study demonstrated that CD/mDsRed and CD/UPRT/mDsRed fusion genes are valuable tools for monitoring suicide gene expression and prodrug activation in living cells and in animal models with optical imaging and 19F MRS. Specifically, our data suggest that 19F MRS assessment of CD or CD/UPRT transgene expression and prodrug activation can provide useful information in the design and evaluation of clinical gene therapy trials. For example, MRS data obtained over the course of treatment could help to guide tumor transduction schedules and 5-FC doses. In terms of technical capability, the growing availability of high-field human MRS instruments will enhance the practicality and usefulness of the 19F MRS technique for optimizing gene therapy.
Acknowledgements
This work was supported in part by grants from the National Institutes of Health (PO1 CA115675, RO1 CA56909, P50 CA86438, P50 CA92629, R24 CA83084, and R33 CA109772).
Presented in part at the Joint Molecular Imaging Conference, September 8–11, 2007, Rhode Island, USA
Ligang Xing, Xuelong Deng, Khushali Kotedia contributed equally to this work.
References
- Greco O, Dachs GU. Gene directed enzyme/prodrug therapy of cancer: Historical appraisal and future prospectives. J Cell Physiol 2001; 187: 22–36
- Crystal RG, Hirschowitz E, Lieberman M, Daly J, Kazam E, Henschke C, et al. Phase I study of direct administration of a replication deficient adenovirus vector containing the E. coli cytosine deaminase gene to metastatic colon carcinoma of the liver in association with the oral administration of the pro-drug 5-fluorocytosine. Hum Gene Ther 1997; 8: 985–1001
- Pandha HS, Martin LA, Rigg A, Hurst HC, Stamp GW, Sikora K, et al. Genetic prodrug activation therapy for breast cancer: A phase I clinical trial of erbB-2-directed suicide gene expression. J Clin Oncol 1999; 17: 2180–9
- Daher GC, Harris BE, Diasio RB. Metabolism of pyrimidine analogues and their nucleosides. Pharmacol Ther 1990; 48: 189–222
- Kanai F, Kawakami T, Hamada H, Sadata A, Yoshida Y, Tanaka T, et al. Adenovirus-mediated transduction of Escherichia coli uracil phosphoribosyltransferase gene sensitizes cancer cells to low concentrations of 5-fluorouracil. Cancer Res 1998; 58: 1946–51
- Tiraby M, Cazaux C, Baron M, Drocourt D, Reynes JP, Tiraby G. Concomitant expression of E. coli cytosine deaminase and uracil phosphoribosyltransferase improves the cytotoxicity of 5-fluorocytosine. FEMS Microbiol Lett 1998; 167: 41–9
- Erbs P, Regulier E, Kintz J, Leroy P, Poitevin Y, Exinger F, et al. In vivo cancer gene therapy by adenovirus-mediated transfer of a bifunctional yeast cytosine deaminase/uracil phosphoribosyltransferase fusion gene. Cancer Res 2000; 60: 3813–22
- Tjuvajev JG, Stockhammer G, Desai R, Uehara H, Watanabe K, Gansbacher B, et al. Imaging the expression of transfected genes in vivo. Cancer Res 1995; 55: 6126–32
- Gade TP, Koutcher JA, Spees WM, Beattie BJ, Ponomarev V, Doubrovin M, et al. Imaging transgene activity in vivo. Cancer Res 2008; 68: 2878–84
- Golzio M, Rols MP, Gabriel B, Teissie J. Optical imaging of in vivo gene expression: A critical assessment of the methodology and associated technologies. Gene Ther 2004; 11(Suppl 1)S85–S91
- Jacobs A, Dubrovin M, Hewett J, Sena-Esteves M, Tan CW, Slack M, et al. Functional coexpression of HSV-1 thymidine kinase and green fluorescent protein: Implications for noninvasive imaging of transgene expression. Neoplasia 1999; 1: 154–61
- Steffens S, Frank S, Fischer U, Heuser C, Meyer KL, Dobberstein KU, et al. Enhanced green fluorescent protein fusion proteins of herpes simplex virus type 1 thymidine kinase and cytochrome P450 4B1: Applications for prodrug-activating gene therapy. Cancer Gene Ther 2000; 7: 806–12
- Baird GS, Zacharias DA, Tsien RY. Biochemistry, mutagenesis, and oligomerization of DsRed, a red fluorescent protein from coral. Proc Natl Acad Sci U S A 2000; 97: 11984–9
- Campbell RE, Tour O, Palmer AE, Steinbach PA, Baird GS, Zacharias DA, et al. A monomeric red fluorescent protein. Proc Natl Acad Sci U S A 2002; 99: 7877–82
- Muller-Taubenberger A, Vos MJ, Bottger A, Lasi M, Lai FP, Fischer M, et al. Monomeric red fluorescent protein variants used for imaging studies in different species. Eur J Cell Biol 2006; 85: 1119–29
- Wolf W, Waluch V, Presant CA. Non-invasive 19F-NMRS of 5-fluorouracil in pharmacokinetics and pharmacodynamic studies. NMR Biomed 1998; 11: 380–7
- Naser-Hijazi B, Berger MR, Schmahl D, Schlag P, Hull WE. Locoregional administration of 5-fluoro-2'-deoxyuridine (FdUrd) in Novikoff hepatoma in the rat: effects of dose and infusion time on tumor growth and on FdUrd metabolite levels in tumor tissue as determined by 19F-NMR spectroscopy. J Cancer Res Clin Oncol 1991; 117: 295–304
- Stegman LD, Rehemtulla A, Beattie B, Kievit E, Lawrence TS, Blasberg RG, et al. Noninvasive quantitation of cytosine deaminase transgene expression in human tumor xenografts with in vivo magnetic resonance spectroscopy. Proc Natl Acad Sci U S A 1999; 96: 9821–6
- Hamstra DA, Lee KC, Tychewicz JM, Schepkin VD, Moffat BA, Chen M, et al. The use of 19F spectroscopy and diffusion-weighted MRI to evaluate differences in gene-dependent enzyme prodrug therapies. Mol Ther 2004; 10: 916–28
- He F, Li L, Kim D, Wen B, Deng X, Gutin PH, et al. Adenovirus-mediated expression of a dominant negative Ku70 fragment radiosensitizes human tumor cells under aerobic and hypoxic conditions. Cancer Res 2007; 67: 634–42
- Procissi D, Claus F, Burgman P, Koziorowski J, Chapman JD, Thakur SB, et al. In vivo 19F magnetic resonance spectroscopy and chemical shift imaging of tri-fluoro-nitroimidazole as a potential hypoxia reporter in solid tumors. Clin Cancer Res 2007; 13: 3738–47
- Muruganandham M, Alfieri AA, Matei C, Chen Y, Sukenick G, Schemainda I, et al. Metabolic signatures associated with a NAD synthesis inhibitor-induced tumor apoptosis identified by 1H-decoupled-31P magnetic resonance spectroscopy. Clin Cancer Res 2005; 11: 3503–13
- Stevens AN, Morris PG, Iles RA, Sheldon PW, Griffiths JR. 5-fluorouracil metabolism monitored in vivo by 19F NMR. Br J Cancer 1984; 50: 113–7
- Schlemmer HP, Bachert P, Semmler W, Hohenberger P, Schlag P, Lorenz WJ, et al. Drug monitoring of 5-fluorouracil: in vivo 19F NMR study during 5-FU chemotherapy in patients with metastases of colorectal adenocarcinoma. Magn Reson Imaging 1994; 12: 497–511
- Koyama F, Sawada H, Hirao T, Fujii H, Hamada H, Nakano H. Combined suicide gene therapy for human colon cancer cells using adenovirus-mediated transfer of escherichia coli cytosine deaminase gene and Escherichia coli uracil phosphoribosyltransferase gene with 5-fluorocytosine. Cancer Gene Ther 2000; 7: 1015–22
- Kievit E, Bershad E, Ng E, Sethna P, Dev I, Lawrence TS, et al. Superiority of yeast over bacterial cytosine deaminase for enzyme/prodrug gene therapy in colon cancer xenografts. Cancer Res 1999; 59: 1417–21