Abstract
Purpose. The use of marker-based on-line image guided radiotherapy for prostate cancer has considerably reduced the treatment margins to sub-cm. In this study we have quantified the residual set-up errors remaining after isocenter correction, studied their development during beam delivery and estimated their impact on margins. Methods and materials. After initial on-line patient set-up based on orthogonal kV x-ray images of implanted fiducial markers, continuous electronic portal imaging was performed during treatment delivery in 10 of 39 treatment sessions for 20 prostate cancer patients. The cranio-caudal (CC) position of the centre-of-mass of the three markers was found using a threshold technique on every single image frame for all patients, typically 12–14 images for 5 treatment beams in every fraction. The CC prostate position was determined relative to its initial position at treatment onset and relative to its planned position within the field aperture. These results allowed determination of the CC intrafraction prostate motion and the intrafraction progression of the geometrical CC error, respectively. Results. At treatment onset the standard deviation (SD) of the set-up error was 1.0mm in the lateral direction and 1.5mm in the cranio-caudal (CC) direction. It did not depend significantly on the duration of the set-up procedure (mean: 3.0min, span 1.2–14.6min). The distribution of CC prostate positions relative to the position at treatment onset broadened from 0 to 1.4mm during the treatment session, while the corresponding CC setup error distribution broadened from 1.5 to 1.9mm. This broadening means that the necessary CC setup margin increased by around 1mm during the treatment fraction. Conclusions. Large differences in the intrafraction CC prostate motion patterns were found, however, intrafraction motion only results in a modest additional CC set-up margin of around 1mm relative to the margins needed for the residual set-up error at treatment start.
Escalation of radiation doses above levels causing normal tissue injury has been shown to lead to improved treatment outcome after radiotherapy (RT) for localized prostate cancer Citation[1–3]. Safe delivery of such doses has become clinically feasible firstly due to the improved dose conformality achievable with intensity-modulated RT (IMRT), and secondly, as a result of the tightening of margins made possible by the application of various forms of image-guided RT (IGRT) techniques. On-line image-guidance to account for the day-to-day variation of the prostate position at the beginning of each treatment session has become a routine clinical practice in many radiotherapy departments in order to account for intrafraction motion. Although this allows substantial reductions of the set-up margins around the prostate Citation[4–10], there will still remain residual geometrical set-up errors caused by inaccuracies of the imaging and repositioning system and by intra-fraction prostate motion. Prostate motion during the set-up procedure has been shown to be the main contributor to the occasional large set-up errors residual after on-line correction Citation[11]. Furthermore, prostate motion continues during the entire treatment session Citation[12].
In this study we have investigated the intra-fractional progression of this error in the cranio-caudal (CC) direction throughout the beam delivery. The study is based on continuous portal imaging during the delivery of a 5-field conformal RT technique with open and rectum-shielding segments. It allows for an accurate determination of the set-up errors and prostate motion in the CC direction leading to an estimate of the additional margin required to account for intra-fraction prostate motion.
Materials and methods
Patient material
In the period from June to November 2006, 20 prostate cancer patients treated at Aarhus University Hospital underwent continuous portal imaging for all five treatment fields at three early treatment fractions followed by a weekly fraction, in total 10 of 39 scheduled treatment sessions per patient (treatment days 2, 3, 4, 9, 14, 19, 24, 29, 34 and 39). All patients had three gold markers inserted into their prostate (as described in detail in the following section) that were used for daily on-line prostate localisation. The patients were all treated to a target dose of 78 Gy in fractions of 2 Gy using a five-field conformal technique (gantry angles of 36°, 103°, 180°, 257° and 304°) where a rectum-shielding segment was added for each gantry angle. The relative weights of the segments were manually optimised, resulting in typically 15% of the dose being delivered by the rectum-shielding segments. Planning target volume (PTV) margins of 5 mm laterally, 7 mm anterior and posterior as well as 9 mm superior and inferior were added to the prostate. All patients received written and oral instruction to empty the bladder and rectum prior to the planning CT scan and each treatment session. No laxative or specific diet was prescribed.
Marker implantation and CT scanning
Each patient had three cylindrical 1.2 mm×3 mm gold markers (Acculoc®, NMPE, Everett, WA) implanted trans-rectally under ultrasound guidance. The time interval between marker implantation and the planning CT scan was at least 14 days, but typically 2–3 months because the implantation took place during the neoadjuvant treatment prior to radiotherapy.
The planning CT scan was acquired with slices of 3 mm thickness with 512×512 pixels and 3 mm inter-slice distance.
Daily image-guidance procedure
The patients were treated at one of three Varian Clinac 2100 DHX linear accelerators, each equipped with both an On-Board Imager® (OBI) kilovoltage x-ray system and either an AS500 or AS1000 Portal Vision IAS3 electronic portal imaging device (EPID) (Varian Medical Systems, Palo Alto, CA).
After initial patient positioning in supine position according to external markers a right-lateral and an anterior kV x-ray image were acquired with the OBI system on a daily basis. On-line image registration with the corresponding digitally reconstructed radiographs (DRRs) from the treatment planning system (Eclipse, Varian Medical Systems) was performed manually based on the visualization of the gold markers in the OBI images. The gold markers were not outlined in the treatment planning system as they could be easily identified in the DRRs. When an adequate match was obtained, the corresponding couch correction was calculated automatically and performed remotely. The accuracy of this procedure has been reported previously for the CC and antero-posterior (AP) directions Citation[11]. Treatment delivery then started, during which the EPID was used for continuous portal imaging at 1.3 Hz. Typically 12–14 image frames were acquired per field. The present study was based on the position of the gold markers as documented in the portal images, totaling approximately 650 images (13 images per field×5 fields×10 sessions) per patient. The images for the rectum-shielding segments were not used in this study since one or more gold markers were typically not visible in these segments. Also, as the portal images were acquired during beam-on time only, the variations in the inter-field time (typically 1 minute) were not quantified with our approach.
Image analysis
In an off-line analysis performed using the ImageJ software (ImageJ, http://rsb.info.nih.gov/ij/ Citation[13]), the position of each gold marker in the portal images was determined by a semi-automatic approach. After contrast enhancement and background subtraction the position of a quadratic region-of-interest (ROI) with a side length of 8 mm was selected manually around each gold marker. Within this ROI a gray-scale threshold for marker segmentation was automatically adjusted such that a single area of at least 1.6 mm2 was segmented. The centre-of-mass (COM) of the segmented area was calculated and assumed to represent the projected marker position. In most cases it was sufficient to select the ROI in only the first portal image for a field because the ROI was automatically propagated to the subsequent images in the series. In very few cases, a new ROI had to be selected for subsequent images because the marker moved outside the ROI of the first portal image during field delivery. All results were manually inspected. If the inter-marker distance in the projections was less than ∼5 mm the semi-automatic marker segmentation could fail and an appropriate threshold for automatic segmentation was chosen manually. The COM of the three marker segmentations was used as surrogate for the prostate position.
The projected marker positions were determined similarly for a static phantom with an embedded marker placed in the isocenter of each linear accelerator. This allowed subtraction of apparent motion due to machine flex such that the CC prostate motion during treatment delivery could be determined for each image frame.
For each field in each treatment session, the marker position relative to the field aperture on the first portal image in the image series was compared with the position on the planning DRRs in order to determine the set-up error in the two directions of the imager (beams-eye-view set-up error).
Prostate motion analysis
For each treatment session the projected prostate trajectory in the CC direction was determined throughout the treatment session. Also the CC set-up error in each portal image was determined. No attempt was made to assess the separate lateral (LR) and AP components.
For each image frame number, the standard deviation of the CC prostate position relative to either (1) the initial position at the first frame for field 1 or (2) the planned position within the field aperture in the planning DRRs were determined. These two quantities represent intrafraction prostate motion and set-up error, respectively.
Margin calculations were performed using two different formalisms, the ‘standard’ van Herk recipe Citation[14] as well as the approach presented by Papiez et al. Citation[15]. Within the formalism by van Herk et al., the mean and standard deviation (SD) of the setup error were calculated for each patient. These values where then used for calculation of the population systematic set-up uncertainty Σ (the SD of the patient mean errors) and the population random set-up uncertainty σ (the quadratic mean of the patient SDs) Citation[14]. Finally, the required set-up margin to ensure a minimum CTV dose of 95% for 90% of the patient population was calculated as 2.5σ + 0.7σ Citation[14].
In the formalism by Papiez and Langer, the minimal CTV-PTV enlargement that ensures full CTV inclusion in the PTV at 90% of the treatment fractions was calculated Citation[15].
Results
summarizes the patient characteristics for the 20 patients participating in the study. shows all geometrical errors observed for each field. At treatment onset the standard deviation (SD) of the set-up error was 1.0 mm in the lateral (LR) direction and 1.5 mm in the cranio-caudal (CC) direction. It did not depend significantly on the duration of the set-up procedure (mean: 3.0 min, span 1.2–14.6 min). A simple margin calculation based on 90% probability of full CTV inclusion in the PTV (margins = 2.5*SD) gives margins of 2.5 mm for the LR direction and 3.6 mm for the CC direction. The projection of these margins is shown as the small ellipses in . The margins actually used for these patients were larger, as shown by the large ellipses in . With the actual margins, coverage rates of at least 98.0% were obtained during treatment of all 5 fields (). However, the actual margins should not only account for set-up errors, but all geometrical errors including e.g. target delineation errors.
Figure 1. Geometry of the 5-field prostate plan (middle) and scatter plots showing the set-up errors at all continuous portal images for each of the five treatment beams. The vertical component corresponds to CC errors (cranial direction in top of each graph) whereas the horizontal component is LR error for field 1 and a combination of LR and AP errors for the other fields. Large ellipses: Projection of actually used margins. Small ellipses: Projection of margins calculated as 2.5×SD of initial set-up error, where the LR and CC components are from the present study and the AP component is taken from Citation[11].
![Figure 1. Geometry of the 5-field prostate plan (middle) and scatter plots showing the set-up errors at all continuous portal images for each of the five treatment beams. The vertical component corresponds to CC errors (cranial direction in top of each graph) whereas the horizontal component is LR error for field 1 and a combination of LR and AP errors for the other fields. Large ellipses: Projection of actually used margins. Small ellipses: Projection of margins calculated as 2.5×SD of initial set-up error, where the LR and CC components are from the present study and the AP component is taken from Citation[11].](/cms/asset/d4b1ccfd-9c85-443b-bb89-a622aa59a9b8/ionc_a_325817_f0001_b.jpg)
Table I. Patient characteristics.
Table II. Set-up errors
The mean and SD of the set-up errors for Fields 1–5 is shown in . For Field 1 there is a relatively marked systematic error, probably caused by inaccuracies in the calibrations of the MLC and the OBI isocenter. also lists the fraction of geometrical errors lying within the ellipses shown and explained in , with Field 1, Field 4 and Field 5 having less than 90% of observations within the inner ellipses.
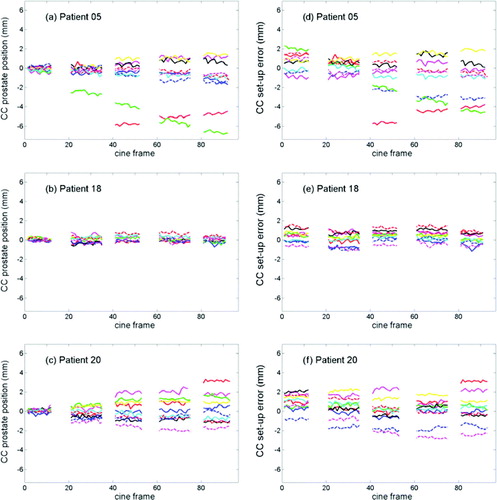
The CC intrafraction prostate motion relative to the initial prostate position at 10 treatment fractions for three selected patients is shown in a–c. For the patient in a, the prostate position was fairly stable at 8 of the treatment sessions while it underwent a continuous drift at one fraction and an abrupt shift followed by a somewhat restoring motion at another fraction. b is an example of a patient with very little prostate motion while c shows a gradual broadening of the position distribution during the treatment delivery. d–f shows the same data as a–c, but now the prostate position is determined relative to the planned position within the field aperture rather than being relative to the initial position at treatment start.
Figure 2. Cranio-caudal prostate position relative to initial prostate position at treatment start (a–c) and relative to field edge (d–f) across the delivery of the five beams for three selected patients. Each graph presents the result for 10 treatment fractions. Image frames number 1, 21, 41, 61, and 81 correspond to the onset of treatment field 1–5, respectively.
The population-based distribution of CC prostate positions relative to the position at treatment start is shown in for each of the five treatment fields. The distribution can also be determined for each separate image frame number, which is shown in a The intrafraction prostate motion means that the distribution of CC set-up error changes throughout the treatment session. The SD of this distribution is shown by the black curves in a. The margins needed to accommodate the position distribution are shown in b as calculated by two different formulas. For both formulas, the CC margin increases about 1 mm during the treatment delivery.
Figure 3. Distribution of cranio-caudal prostate displacements relative to initial prostate position at treatment onset for fields 1–5.

Figure 4. (a) Standard deviation of prostate position relative to planned position within field aperture (i.e. set-up error) (black) and relative to initial prostate position at treatment start (gray) in the cranio-caudal direction as a function of image frame number. (b) Margin in cranio-caudal direction as function of image frame number calculated by two different formulas. Image frames number 1, 21, 41, 61, and 81 correspond to the onset of treatment field 1–5, respectively.
Discussion
This study has investigated the residual set-up errors after on-line image-guided radiotherapy for prostate cancer, and has quantified the temporal progression of these errors throughout treatment fraction delivery. Remarkably different intrafraction prostate motion patterns were found, but the main finding is that intrafraction motion only results in a modest additional margin of around 1 mm relative to the margins needed for the residual set-up error at treatment start.
The LR and CC set-up errors found in this study at treatment start were within the range of previously reported residual set-up errors after image-guided prostate localization Citation[4], Citation[7], Citation[10], Citation[11]. The marked population systematic error in the LR direction suggests that the risk of margin shrinkage below a baseline level given by geometric errors and inaccuracies in the imaging, repositioning, and treatment delivery systems might be relevant for on-line prostate localization protocols. Most margin formulas assume that the population mean error is zero since population systematic errors in principle can be eliminated by proper calibration and compensation for machine flex. When the margins are reduced to the order of a few mm this assumption might not be valid for a practical clinical setting.
Intrafraction prostate motion has previously been studied by use of continuous portal imaging Citation[16], time-resolved MRI Citation[17], and electromagnetic transponders Citation[12]. While the present study finds motion magnitudes in accordance with these studies it also directly provides the impact of the intrafraction motion on the set-up error progression throughout the treatment fraction. For the patient population, the CC prostate position distribution (relative to the position at treatment start) broadened fast during the first 2–3 fields (∼2 minute time scale) after which the broadening slowed down as seen in a (gray curves). The effect of this intrafraction motion on the CC set-up error was a gradual increase of the SD from the initial value of 1.5 to 1.9 mm at the last two fields (a black curve). This in turn means an increase of 1 mm in the population based set-up margin (b) for either of the used margin formulas.
Using the current data material, we also investigated whether the occurrence of large prostate motion in the three first sessions where continuous portal imaging was used also predicted for large motion in the later sessions with portal imaging. This investigation showed that prostate motion occurs more or less randomly, with a correct prediction in only two of three cases (data not shown).
The fast broadening of the prostate position distribution during the first few minutes indicates that fast response is important for strategies aiming at position correction during treatment delivery such as prostate tracking or interfield repositioning. On the other hand, on-line prostate localization before each treatment fraction takes place at a longer time scale where the broadening of the position distribution has slowed down considerably. Therefore, time considerations are not that crucial, and relatively small additional margins can account for the intrafraction prostate motion. This is probably the reason why studies have shown no significant relation between duration of on-line set-up procedures and residual set-up error for prostate Citation[5], Citation[11].
The distribution of set-up errors residual after image-guided prostate localization broadened moderately during treatment delivery. The additional population based set-up margin to account for intrafraction prostate motion was ∼1 mm in the CC direction. However, in individual patients large intrafraction prostate motion occasionally occurs. Strategies to manage such outliers become increasingly important as population based margins are reduced or hypo-fractionation schemes are initiated.
In conclusion, the interfraction prostate motion only results in a modest additional CC set-up margin of 1 mm relative to the margin needed for the residual set-up error at treatment start. When the set-up margin is added (in quadrature) to other contributions such as target delineation errors, the resulting increase in total PTV margin magnitude due to prostate motion during treatment will be smaller than 1 mm. Declaration of interest: The authors report no conflicts of interest. The authors alone are responsible for the content and writing of the paper.
References
- Kupelian PA, Kuban D, Thames H, Levy L, Horwitz E, Martinez A, et al. Improved biochemical relapse-free survival with increased external doses in patients with localized prostate cancer: The combined experience of nine institutions in patients treated in 1994 and 1995. Int J Radiat Oncol Biol Phys 2005; 61: 415–9
- Peeters ST, Heemsbergen WD, Koper PC, van Putten WL, Slot A, Dielwart MF, et al. Dose-response in radiotherapy for localized prostate cancer: Results of the Dutch multicenter randomized phase III trial comparing 68 Gy of radiotherapy with 78 Gy. J Clin Oncol 2006; 24: 1190–6
- Zietman AL, DeSilvio ML, Slater JD, Rossi CJ, Jr, Miller DW, Adams JA, et al. Comparison of conventional-dose vs high-dose conformal radiation therapy in clinically localized adenocarcinoma of the prostate: A randomized controlled trial. JAMA 2005; 294: 1233–9
- Shimizu H, Shirato H, Kitamura K, Shinohara M, Harbayashi T, Tsukamoto T, et al. Use of an implanted marker and real-time tracking of the marker for the positioning of prostate and bladder cancers. Int J Radiat Oncol Biol Phys 2000; 48: 1591–7
- Enmark M, Korreman S, Nyström H. IGRT of prostate cancer; is the margin reduction gained from daily IG time-dependent?. Acta Oncol 2006; 45: 907–14
- Wu Q, Ivaldi G, Liang J, Lockman D, Yan D, Martinez A. Geometric and dosimetric evaluations of an online image guidance strategy for 3D-CRT of prostate cancer. Int J Radiat Oncol Biol Phys 2006; 64: 1596–609
- Litzenberg D, Dawson LA, Sandler H, Sanda MG, McShan DL, Ten Haken RK, et al. Daily prostate targeting using implanted radiopaque markers. Int J Radiat Oncol Biol Phys 2002; 52: 699–703
- Van den Heuvel F, Fugazzi J, Seppi E, Forman JD. Clinical application of a repositioning scheme, using gold markers and electronic portal imaging. Radiother Oncol 2006; 79: 94–100
- Beaulieu L, Girouard L-M, Aubin S, Aubry J-F, Brouard L, Roy-Lacroix L, et al. Performing daily prostate targeting with a standard V-EPID and an automated radio-opaque marker detection algorithm. Radiother Oncol 2004; 73: 61–4
- Chung PWM, Haycocks T, Brown T, Cambridge C, Kelly V, Alasti H, et al. On-line aSi portal imaging of implanted fiducial markers for the reduction of interfraction error during conformal radiotherapy of prostate carcinoma. Int J Radiat Oncol Biol Phys 2004; 60: 329–34
- Poulsen PR, Muren LP, Høyer M. Residual set-up errors and margins in on-line image-guided prostate localization in radiotherapy. Radiother Oncol 2007; 85: 201–6
- Kupelian P, Willoughby T, Mahadevan A, Djemil T, Weinstein G, Jani S, et al. Multi-institutional clinical experience with the Calypso System in localization and continuous, real-time monitoring of the prostate gland during external radiotherapy. Int J Radiat Oncol Biol Phys 2007; 67: 1088–98
- Image J. National Institutes of Health. A public domain image analysis software. Downloaded from http://rsb.info.nih.gov/ij/.
- Van Herk M, Remeijer P, Rasch C, Lebesque JV. The probability of correct target dosage: Dose-population histograms for deriving treatment margins in radiotherapy. Int J Radiat Oncol Biol Phys 2000; 47: 1121–35
- Papiez L, Langer M. On probabilistically defined margins in radiation therapy. Phys Med Biol 2006; 51: 3921–39
- Neederveen AT, van der Heide UA, Dehnad H, van Moorselaar RJA, Hofman P, Lagendijk JJW. Measurements and clinical consequences of prostate motion during a radiotherapy fraction. Int J Radiat Oncol Biol Phys 2002; 53: 206–14
- Ghilezan MJ, Jaffray DA, Siewerdsen JH, van Herk M, Shetty A, Sharpe MB, et al. Prostate gland motion assessed with cine-magnetic resonance imaging (cine-MRI). Int J Radiat Oncol Biol Phys 2005; 62: 406–17