Abstract
Introduction. With the purpose of implementing gated radiotherapy for lung cancer patients, this study investigated the interfraction variations in tumour size and internal displacement over entire treatment courses. To explore the potential of image guided radiotherapy (IGRT) the variations were measured using a set-up strategy based on imaging of bony landmarks and compared to a strategy using in room lasers, skin tattoos and cupper landmarks. Materials and methods. During their six week treatment course of 60Gy in 2Gy fractions, ten patients underwent 3 respiratory gated CT scans. The tumours were contoured on each CT scan to evaluate the variations in volumes and position. The lung tumours and the mediastinal tumours were contoured separately. The positional variations were measured as 3D mobility vectors and correlated to matching of the scans using the two different strategies. Results. The tumour size was significantly reduced from the first to the last CT scan. For the lung tumours the reduction was 19%, p=0.03, and for the mediastinal tumours the reduction was 34%, p=0.0007. The mean 3D mobility vector and the SD for the lung tumours was 0.51cm (±0.21) for matching using bony landmarks and 0.85cm (±0.54) for matching using skin tattoos. For the mediastinal tumours the corresponding vectors and SD's were 0.55cm (±0.19) and 0.72cm (±0.43). The differences between the vectors were significant for the lung tumours p=0.004. The interfractional overlap of lung tumours was 80–87% when matched using bony landmarks and 70–76% when matched using skin tattoos. The overlap of the mediastinal tumours were 60–65% and 41–47%, respectively. Conclusions. Despite the use of gating the tumours varied considerably, regarding both position and volume. The variations in position were dependent on the set-up strategy. Set-up using IGRT was superior to set-up using skin tattoos.
Patients with inoperable loco-regional non-small cell lung cancer can be treated with a combination of chemotherapy and 3-dimensional conformal radiotherapy. The target for radiation therapy of lung cancer is the primary lung tumour and the metastatic lymph nodes. Adequate irradiation requires that the target motion, and the changes in size, shape or displacement over time is taken into account. This leads to excessively large treatment fields consequently leading to increased toxicity. To reduce the toxicity, clinicians sometimes compromise treatment field margins or reduce prescribed dose, resulting in inadequate coverage of the tumour periphery or in inadequate central dose (marginal miss or underdosage). It has been suggested that the necessary treatment margins can be reduced if set-up strategy is based on bony landmarks in stead of set-up using skin tattoos Citation[1–3]. These studies, based on electronic portal imaging, contained no 3D information on tumour changes. Breathing adapted radiotherapy, including respiratory gating and breath hold techniques, has been associated with a potential of margin reduction. It has been suggested that the treatment field margins around the tumour could be shrunk proportionally to the reduction in breathing motion Citation[4–6]. To support their hypotheses the referred studies were based on observations of intrafractional breathing motion. The interfraction variations in breathing can not be ignored and have been shown to be up to 10 times larger than the intrafraction variations Citation[7]. Berbeco et al. investigated gated radiotherapy and found the residual tumour motion in a gating window behaved unpredictable in between fractions Citation[8]. Recently Spoelstra have shown reproducible tumour motion within a gating window, based on 2D images Citation[9]. The present study served two purposes. The first was to explore the potential of introducing respiratory gated radiotherapy for non small cell lung cancer patients, with respect to the interfractional 3D changes in tumour size, shape and internal displacement of the primary lung tumour as well of the metastatic lymph nodes, during entire courses of curative radiotherapy. The second was to explore the potential of image guided radiotherapy (IGRT) by comparing two different set-up strategies in 3D. We mimicked respiratory gated radiotherapy by using respiratory gated CT scans and evaluated three equally spaced time points; before start of radiotherapy, at fraction number 15 and at the end of the treatment course (at fraction no. 30).
Material and methods
Patients
All patients included in this study met the following criteria: histologically proven non-small cell lung cancer, stage II-IIIB, referral for radiotherapy with curative intent, age above 18 years, written informed consent according to a protocol approved by the local Scientific Ethical Committees (#KF 01-233/02), tumour visible on CT scan, performance and tumour status compatible with curative radiotherapy. Patients were enrolled consecutively, provided capacity was available on the CT scanner dedicated for respiratory gating. No screening was done with respect to the tumour location, tumour size or adherence to adjacent structures, thus avoiding selection bias occurring from individual tumour specifications. Twelve patients were initially enrolled in the study of whom two were excluded: one due to poor performance status (this patient then received radiotherapy with palliative intent), the other due to the finding of distant metastases on the planning CT scan. All of the included patients were treated according to the clinical guidelines of the Department of Radiation Oncology; no breathing adaptation was used during treatment delivery
CT scanning
During the treatment course of 30 fractions, three respiratory gated CT scans were acquired for each patient: one just before the treatment started (scan_A), one at fraction number 14, 15 or 16 (scan_B), and one at the end of the treatment (scan_C) at fraction number 29 or 30. For each of the three CT scans the patients were immobilized as for treatment. Set-up was based on skin tattoos (marked with external copper landmarks) and room lasers. The patient set-up mimicked a treatment situation and the staff in the CT scanner aimed at matching the skin tattoos perfectly to the in room lasers. The CT scanner was a single slice Siemens Somatom Plus 4. The scan parameters for the CT scans were; sequence mode, 3 mm slice, 3 mm feed, 120 kVp, 110 mAs, 0.75 s rotation time, and no use of intravenous contrast. All scans were acquired as phase gated CT scans in the end-inspiration phase of normal free breathing. The Real-Time Position Management (RPM) systemTM, version 1.4.8, Varian Medical Systems Inc., was used to trigger the CT scanner. For further description of the CT-gating technique see Korreman et al. Citation[10]. The RPM-marker box was placed on the thoracic wall with an interfraction reproducibility of ±1 mm (SD). To optimize the reproducibility of the marker box placement, it was done by the same physician (TJN) at every scan. Respiratory gating was used in order to simulate a situation where the radiotherapy was delivered in a gated mode. In this way the intrafraction breathing motion of the organs in the thorax was minimized. Furthermore, breathing artefacts are reduced on a gated CT scan, making contouring more precise.
Contouring
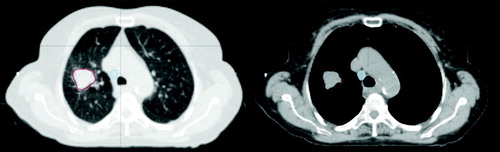
All CT scans were transferred to Eclipse treatment planning system™, Varian Medical Systems Inc. Contouring was done on every CT scan separately. To avoid inter-observer variations, the same physician (TJN) performed all contouring according to a delineation protocol. The lung tumours were delineated using a lung window (W: 1500, L: −700) and the mediastinal structures were delineated using a soft tissue window (W: 330, L: 40), for illustration see . The clinical planning CT scan was acquired with intravenous contrast and the contouring on scan_A was guided by the planning CT scan. To reduce the intra-observer variation, the contouring on scan_B and C was guided by the contours on scan_A. Separate volumes were assigned for the primary tumour (GTV_t) and the metastatic lymph nodes (GTV_l). The gross tumour volume (GTV) was manually contoured whereas the lungs were contoured using automatic segmentation and afterwards reviewed manually.
Figure 1. This is an axial CT slice of patient no. 10. The GTV_t, in red, was contoured using the lung window setting and the GVT_l, in light blue, was contoured using the soft tissue window.
Matching procedures
In order to compare two different set-up strategies, the three CT scans from each patient were matched in two separate ways. One strategy was to match by skin tattoos (represented by copper landmarks placed on the skin tattoos) in the central CT slice (Z = 0) defined at the CT scanner. This resembles a clinical set-up situation based on skin tattoos and in-room lasers. The other strategy was to use four bony landmarks, in the thoracic vertebrae, separated by several cm in the x, y and z planes, as in a clinical set-up situation using kV imaging in at least two planes or conebeam CT. Both strategies were based on rigid transformation. Scan_A was matched with scan_B and scan_C, whereas scan_B was not matched with scan_C.
Data analysis
The CT scans, the contoured structures and the matching coordinates were exported from the treatment planning system in a DICOM_RT format, containing the volume point coordinates. The informations were then imported into Matlab, The MathWorks Inc., with the help of a freeware package Computational Environment for Radiotherapy Research Citation[11]. For each structure the volume and the Centre of Volume (CoV) position were calculated. The calculations were based on the structures being defined by sets of polygons separated from each other by the CT scanner slice separation. The volumes of the structures were calculated by summing the volumes of all of the polygons included. The CoV was calculated as the corresponding centres of volume for every polygon in a structure and by summing them together with their relative weights. Three-dimensional (3D) mobility vectors were derived for each structure using the x, y, and z coordinates of the CoV from each CT scan. The vector difference between the GTV_t and the GTV_l in each patient was calculated as the vector difference. The volume and the CoV of the structures at scan_A were the references of comparison to the equivalent parameters at scan_B and scan_C. It was calculated how much of the target volume at scan_B and C overlapped with the target volume at scan_A. The calculations of the overlapping volume for 2 structures were performed by calculating the overlapping areas for every 2 polygons that defined the given structures and corresponded to the same z coordinate along the CT scan. The sum of the overlapping areas times the slice separation gave the value of the overlapping volume of these two structures. This overlapping volume was related to the target volume at scan_B, and scan_C respectively. The overlapping volume is hereafter referred to as percentage of overlap between scan_B and scan_A, and between scan_C and scan_A respectively.
Statistical methods
For variables without Gaussian distribution the Wilcoxon Signed Rank test was used for comparative analysis. To analyse the variations in volumes over time and to compare changes in volume to the size of the volumes one-sample t-test was used. An assumption for the t-test is a Gaussian distribution of the variables. Since the distribution of GTV_t and the GVT_l were not Gaussian, the volumes were log10 transformed to establish an appropriate distribution. If nothing else is stated, the tests showed p-values above 0.05.
Results
Patient characteristics
The patients in the study had local or locally advanced NSCLC, for details regarding age, gender, stage and performance status see . All the patients completed the prescribed radiotherapy dose of 60 Gy given in 30 fractions over 6 weeks. The radiotherapy was performed without gating and no concurrent chemotherapy was given. All patients completed three respiratory gated CT scans, except one patient who could not manage the last scanning session due to poor general condition. The acquired CT scans were matched using bony landmarks and skin tattoos respectively, except two scans with the latter method, due do missing copper landmarks.
Table I. Patient characteristics.
Volumetric variations
All patients had a GTV_t and in eight patients had a GTV_l; two patients had stage N0 and therefore no defined GTV_l, all the volumes are presented in .
Table II. Volumetric variations over the treatment course.
GTV_t and GTV_l
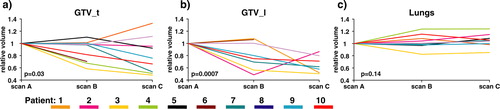
The median GTV_t volume at scan_A was 33.3 cm3 and at scan_C the median volume was reduced to 25.3 cm3. The relative changes in GTV_t over time are depicted in a. The mean volume reduction was 19% from scan_A to scan_C, p = 0.03. The test was done as one-sample t-tests on log10 transformed data.
For the eight GTV_l volumes the median size was reduced from 7.2 cm3 at scan_A to 4.0 cm3 at scan _C, see for the relative variations. The mean decrease from scan_A to scan_C was 34%, p = 0.0007 (one-sample t-tests on log10 transformed data).
Figure 2. The figure demonstrates the relative change in volumes for GTV_t, GTV_l, and Lungs as a function of treatment time (scan_A = fraction no. 1, scan_B = fraction no. 15, and scan_C fraction no. 30). Scan_A is the reference of comparison, indicated by all the curves starting from 1.0. The individual patient is depicted by the same colour in each graph. For each volume the p-value is reported.
Lungs
The median lung volume was 3 200 cm3 at scan_A (range 2 463–5 557 cm3), 3 560 cm3 (range 2 929–5 504 cm3) at scan_B, and 3 262 cm3 at scan_C (range 2 996–5 848 cm3), c. The lung volumes varied differently between patients, some had increasing and others had decreasing volumes. The changes in lung volume and changes in GTV_t were tested for linear correlation between increased lung volume and reduced tumour volume, but this could not be detected.
Centre of Volume (CoV) variations
The changes in CoV for GTV_t and GTV_l are reported separately for the scans matched using bony landmarks and the scans matched using skin tattoos. The length of each 3D mobility vector, based on the displacement in the x-, y- and z- coordinates of the CoV, is reported in . The displacements of the individual coordinates are depicted in .
Figure 3. The figure illustrates the displacement in the x-, y- and z- coordinates of the CoVs between scan A and scan B, or scan A and scan C, for each GTV_t and GTV_l. Every patient has a specific colour and the displacements from A to B are depicted with a dot and the displacements from A to C are depicted with a triangle. The x-coordinate corresponds to the medio-lateral displacement, the y-coordinate to the anterior posterior displacement and the z-coordinate to the superior inferior displacement. In all the plots, the first column represent CT scan matched using bony landmarks and the second column represent matching using skin tattoos.
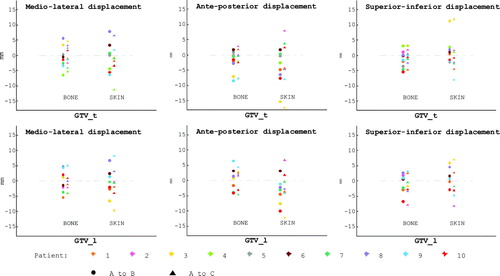
Table III. Length of the 3D mobility vectors in cm.
For the GVT_t the lengths of the vectors from A to B were not significantly different from the lengths from A to C. The displacement of the CoV from scan_A to any other scan (B or C) was compared for skin-match and bone-match. The mean vector length was 0.85 cm for the skin-match, and 0.51 cm for the bone-match. A Wilcoxon Signed Rank test was done to compare all bone-match displacement with all skin-match CoV displacement. The vectors for skin-match were larger than for bone match, p = 0.004.
Eight of the patients had a GTV_l. As for the GVT_t there were no significant differences between the vector lengths comparing A to B with A to C. The mean length of the 3D vectors (including both the displacement from scan_A to scan_B and from scan_A to scan_C) for the bone-match was 0.55 cm and 0.72 cm using the skin-match. This difference was not significant, p = 0.13. Only six patients were included in the comparative test, since one patient with a defined GTV_l did not have scan_C and for another patient no skin-match was possible due to missing copper landmarks.
For each situation the vector difference between the CoV of the GTV_t and the CoV of the GTV_l was calculated, . For each situation the difference between the GTV_t and the GTV_l is of the same magnitude as the displacement of the individual target volumes. This indicates that the positional variations of the GTV_t and the GTV_l have different directions within the same patient in the same session.
Small volumes were expected to be more mobile than large volumes and therefore more likely to be displaced. The linear correlation between vector length and target volume size was tested for both GTV_t and GTV_l, but no correlation could be detected.
Overlap of volumes
Scan_A was the reference for the calculation of the overlapping volumes. At scan_B 36 to 95% of the 3D GTV_t volume at scan_B was included in the original GTV_t, when matching was performed using bony anatomy. If matching was performed using skin tattoos, the overlap ranged from 19 to 96%.
For scan_C the overlap, using the bone-match, was 39 to 97% and 23 to 94% using the skin-match. We did expect the overlaps using bony landmarks to be larger than the overlaps using skin markers, but no significant differences were detected.
The GTV_l generally overlapped less than the GTV_t, but the differences were not statistically significant. At scan_B the 3D overlap ranged from 38 to 76% for the bone-match and from 10 to 86% for the skin-match. At scan_C the corresponding overlap ranges were 21 to 85% and 11 to 87%. As for GTV_t, there were no significant differences between the degrees of overlap using skin markers and bony landmarks.
The degree of overlap was thought to be dependent of the GTV size, since small non-overlapping volume would influence the degree of overlap more for a small GTV than for a large GTV. We found a tendency towards this correlation for scans matched using bony landmarks and comparing scan_C with scan_A. The correlation coefficient (r2) was 0.6 for GTV_t and 0.7 for GTV_l.
Discussion
The findings from the present study show a trend toward the benefit of on-line image guidance using bony landmarks. We also showed that, even with the use of gating, interfractional changes in tumour position, and shape were present. The latter finding questions the potential of margin reduction, especially without on-line image guidance of the target position. We found that the target volumes decreased significantly during a course of radiotherapy, the mean GTV_t shrinkage was 19% and the GTV_l shrank 34%. We showed that if the intrafraction breathing motion was minimized with gating, the median CoV of the GTV_t varied 8 mm over the treatment course, if the set-up strategy was based on room lasers and skin tattoos and that the variation could be reduced to approximately 5 mm, if the set-up strategy was based on line imaging of bony anatomy. Some unknown residual motion of the tumour in the gating window was present and would account for approximately 1.5 mm of the measured change in CoV Citation[9]. Some of the measured difference could be explained by the delineation differences, according to other studies this would account for approximately 1 mm Citation[12]. Another factor that could explain the change in CoV is the correlation between the external marker motion and the internal target motion. If this correlation is not re-established on a daily basis a systematic change in tumour baseline position and motion can occur. The overlap of target volumes, between the different scans, was low (less than 50%) for some of the patients, independent of matching method. This could potentially lead to inadequate dose coverage of the tumour periphery (marginal miss) for some of the patients, but this point needs more investigation. The lack of significance difference between the matching based on bone versus skin the GTV_t and the GTV_l overlap could be due to the limited number of patients eligible for the comparative test. The strengths of the present study are that 3D information on the variations was gathered for both the primary tumour and the lymph node metastases in the mediastinum, since most lung cancer patients eligible for radiotherapy have locally advanced disease, and that the patients were followed over a full 6 week course of radiotherapy, describing interfractional changes. Another strength was that the CT-scans were performed with respiratory gating, mimicking a respiratory gated treatment, to minimize the respiratory induced tumour motion. The patient population was homogenous and unselected, making generalizations possible. In the present study we found general GTV_t shrinkage and GTV_l shrinkage. Others have reported on changes in lung tumour volume over a treatment course Citation[12–16]. The findings from these studies are generally comparable to our findings, with a tendency to tumour shrinkage over the treatment time. Recently Bosmans et al. measured the volumetric variations in lymph nodes during a treatment course Citation[17]. In their study no clear reduction in volume was found. The reason for the discrepancy in our findings may relate to different fractionation schedules.
We found a CoV 3D displacement of 5 mm in the present study, in situations where matching was performed using bony landmarks. Our findings are in concordance with other studies Citation[12], Citation[16], Citation[18–22]. In these studies tumour position have been found to vary up to 5–10 mm in any direction, even with set-up performed using bony landmarks. Sonke et al. have evaluated both the tumour baseline shift and the tumour trajectory on repeated 4D CBCT scans Citation[23] and they found that baseline variations were more important for the margin definition than the tumour trajectory. This is in concordance with our finding, we do not measure the trajectory, but instead we try to minimize it with the use of gating and we still found variation in CoV.
We expected that matching using bony landmarks would be significantly better than matching using skin tattoos in regard to target position, as have been found earlier by Erridge et al. and Borst et al. Citation[2], Citation[24]. This was true for GTV_t, but not for GTV_l. There is no clear reason for this finding, but it could be based on poor statistics due to the low number of patients with nodal disease in this study.
The variations in volume, CoV position, and target overlap in different situations could impair dose coverage to the target. Especially in situations were the GTV_t and GTV_l displace in different directions as we demonstrated. These variations should be included in the CTV to PTV margin when dose planning is performed. This study is to small and contain to few measure points to estimate margin requirements, but it emphasizes the need for margin, especially when target contains both a GTV_t and a GTV_l. The dosimetric consequences have not been evaluated in this study due to the complexity in the CTV definition for stage III lung cancer. The area needs further investigation especially since we saw different 3D mobility vectors for the GTV_l and for the GTV_t in this study. Further investigations concerning the dosimetric consequences and even the potential of adaptive planning are warranted.
Conclusion
We demonstrated general tumour shrinkage during a full course of radiotherapy, both for primary lung tumours and metastatic lymph nodes. The findings from the present study show that even with respiratory gating and an image guided set-up protocol based on bony landmarks; margins are still needed to cover different tumour position, tumour volume and other variations. Apart from the variations in tumour position we found that the target volumes were not covered by the initial GTV definition. The implication of this lack of overlap needs further investigation. Declaration of interest: The authors report no conflicts of interest. The authors alone are responsible for the content and writing of the paper.
References
- Ford EC, Mageras GS, Yorke E, Rosenzweig KE, Wagman R, Ling CC. Evaluation of respiratory movement during gated radiotherapy using film and electronic portal imaging. Int J Radiat Oncol Biol Phys 2002; 52: 522–31
- Erridge SC, Seppenwoolde Y, Muller SH, van Herk M, De Jaeger K, Belderbos JS, et al. Portal imaging to assess set-up errors, tumor motion and tumor shrinkage during conformal radiotherapy of non-small cell lung cancer. Radiother Oncol 2003; 66: 75–85
- de Boer HC, van Sornsen de Koste JR, Senan S, Visser AG, Heijmen BJ. Analysis and reduction of 3D systematic and random setup errors during the simulation and treatment of lung cancer patients with CT-based external beam radiotherapy dose planning. Int J Radiat Oncol Biol Phys 2001; 49: 857–68
- Wilson EM, Williams FJ, Lyn BE, Wong JW, Aird EG. Validation of active breathing control in patients with non-small-cell lung cancer to be treated with CHARTWEL. Int J Radiat Oncol Biol Phys 2003; 57: 864–74
- Keall P, Vedam S, George R, Bartee C, Siebers J, Lerma F, et al. The clinical implementation of respiratory-gated intensity-modulated radiotherapy. Med Dosim 2006; 31: 152–62
- Giraud P, Yorke E, Ford EC, Wagman R, Mageras GS, Amols H, et al. Reduction of organ motion in lung tumors with respiratory gating. Lung Cancer 2006; 51: 41–51
- Juhler Nottrup T, Korreman SS, Pedersen AN, Aarup LR, Nystrom H, Olsen M, et al. Intra- and interfraction breathing variations during curative radiotherapy for lung cancer. Radiother Oncol 2007; 84: 40–8
- Berbeco RI, Nishioka S, Shirato H, Chen GT, Jiang SB. Residual motion of lung tumours in gated radiotherapy with external respiratory surrogates. Phys Med Biol 2005; 50: 3655–67
- Spoelstra FOB, van Sornsen de Koste J, Cuijpers JP, Lagerwaard FJ, Slotman BJ, Senan S. Analysis of reproducibility of respiration-triggered gated radiotherapy for lung tumors. Radiother Oncology 2008; 87: 59–64
- Korreman SS, Pedersen AN, Nottrup TJ, Specht L, Nystrom H. Breathing adapted radiotherapy for breast cancer: Comparison of free breathing gating with the breath-hold technique. Radiother Oncol 2005; 76: 311–8
- CERR: A Computational Environment for Radiotherapy Research [homepage on the Internet]. Computer software from J. O. Deasy and Washington University, St Louis. Avaible from: http://radium.wustl.edu/CERR/about.php.
- Chang J, Mageras GS, Yorke E, De Arruda F, Sillanpaa J, Rosenzweig KE, et al. Observation of interfractional variations in lung tumor position using respiratory gated and ungated megavoltage cone-beam computed tomography. Int J Radiat Oncol Biol Phys 2007; 67: 1548–58
- Kupelian PA, Ramsey C, Meeks SL, Willoughby TR, Forbes A, Wagner TH, et al. Serial megavoltage CT imaging during external beam radiotherapy for non-small-cell lung cancer: Observations on tumor regression during treatment. Int J Radiat Oncol Biol Phys 2005; 63: 1024–8
- Siker ML, Tome WA, Mehta MP. Tumor volume changes on serial imaging with megavoltage CT for non-small-cell lung cancer during intensity-modulated radiotherapy: How reliable, consistent, and meaningful is the effect?. Int J Radiat Oncol Biol Phys 2006; 66: 135–41
- Bosmans G, van BA, Dekker A, Ollers M, Boersma L, Minken A, et al. Intra-patient variability of tumor volume and tumor motion during conventionally fractionated radiotherapy for locally advanced non-small-cell lung cancer: A prospective clinical study. Int J Radiat Oncol Biol Phys 2006; 66: 748–53
- Underberg RW, Lagerwaard FJ, van TH, Cuijpers JP, Slotman BJ, Senan S. Time trends in target volumes for stage I non-small-cell lung cancer after stereotactic radiotherapy. Int J Radiat Oncol Biol Phys 2006; 64: 1221–8
- Bosmans G, van Baardwijk A, Dekker A, Íllers M, Wanders S, Boersma L, et al. Time trends in nodal volumes and motion during radiotherapy for patients with stage III non-small-cell lung cancer. Int J Radiat Oncol Biol Phys 2008; 71: 139–44
- Cheung PC, Sixel KE, Tirona R, Ung YC. Reproducibility of lung tumor position and reduction of lung mass within the planning target volume using active breathing control (ABC). Int J Radiat Oncol Biol Phys 2003; 57: 1437–42
- Koshani R, Balter JM, Hayman JA, Henning GT, van HM. Short-term and long-term reproducibility of lung tumor position using active breathing control (ABC). Int J Radiat Oncol Biol Phys 2006; 65: 1553–9
- Panakis N, McNair HA, Christian JA, Mendes R, Symonds-Tayler JR, Knowles C, et al. Defining the margins in the radical radiotherapy of non-small cell lung cancer (NSCLC) with active breathing control (ABC) and the effect on physical lung parameters. Radiother Oncol 2008; 87: 65–73
- Purdie TG, Bissonnette JP, Franks K, Bezjak A, Payne D, Sie F, et al. Cone-beam computed tomography for on-line image guidance of lung stereotactic radiotherapy: Localization, verification, and intrafraction tumor position. Int J Radiat Oncol Biol Phys 2007; 68: 243–52
- Nelson C, Starkschall G, Balter P, Morice RC, Stevens CW, Chang JY. Assessment of lung tumor motion and setup uncertainties using implanted fiducials. Int J Radiat Oncol Biol Phys 2007; 67: 915–23
- Sonke JJ, Lebesque J, van Herk M. Variability of four-dimensional computed tomography patient models. Int J Radiat Oncol Biol Phys 2008; 70: 590–8
- Borst GR, Sonke JJ, Betgen A, Remeijer P, van Herk M, Lebesque JV. Kilo-voltage cone-beam computed tomography setup measurements for lung cancer patients; first clinical results and comparison with electronic portal-imaging device. Int J Radiat Oncol Biol Phys 2007; 68: 555–61