Abstract
Background. Head and neck cancer continues to be one of the most common tumor entities worldwide. Within this group of malignancies, tonsillar squamous cell carcinoma represent approximately 15–20% of all intraoral and oropharyngeal carcinomas in the United States. Accurate and early stage diagnosis still remains a major challenge, as patients are often presented at an advanced stage of disease, causing a low overall survival rate. Thus, new diagnostic markers are highly desirable and could allow for a more reliable diagnosis, with further insights into carcinogenesis and tumor biology. Furthermore, these markers could be the basis for new therapeutic targets and early disease detection. To address these issues, we decided to use a global proteomic approach to characterize tonsillar squamous cell carcinoma. Materials and methods. A total of 19 tonsillar carcinoma samples and 12 benign controls acquired from the corresponding normal epithelium were analyzed by 2-D gel electrophoresis. 2-DE gels were silver stained and analyzed using the PDQuest analysis software (BioRad). Tumor specific spots were detected and identified by consecutive MALDI-TOF-MS or MS/MS polypeptide identification. Results. In total, 70 proteins showed significant quantitative differences in protein expression, with 50 polypeptides accessible for identification. Of those 50 polypeptides, we were able to identify a total of 27 proteins and protein isoforms, significantly up- or down-regulated in tonsillar cancer samples. In addition to previously reported polypeptides in head and neck cancers, we were able to identify several new potential marker proteins in this study. Conclusion. Our results show that a combination of tonsillar cancer specific proteins can be used for histopathological diagnosis and may serve as a basis for discovering further biomarkers for early detection and prediction of response to treatment in the future.
Head and neck cancer is the 6th most common cancer in the Western world with approximately 1 000 new cases each year in Sweden. The overall survival rate is low and has not improved over the last 20 years. In Sweden, the incidence of tonsillar cancer is increasing dramatically as opposed to other intraoral tumors Citation[1].
Tonsillar cancer is rarely diagnosed at an early stage. Quite commonly, patients present with neck node metastasis, whereafter the primary is discovered. Occasionally, the primary cancer is even only recognized microscopically. In patients presenting with neck node metastasis of “unknown primary”, they are later on frequently diagnosed with tonsillar cancer. Treatment can be a difficult balance between appropriate therapy, sufficient enough to cure the patient, while avoiding unnecessary interventions with subsequent sequels for the patient (e.g. disability to swallow, xerostomy and loss of taste). Although important advances have been made in understanding different carcinoma types in terms of effective treatment Citation[2], Citation[3], the molecular pathways triggering the onset of carcinogenesis in head and neck/tonsillar cancer are still unknown. In this context, biomedical research has advanced rapidly in recent years with the availability of technologies such as protein expression profiling. Protein fingerprinting, combined with statistical analysis, allows the distinction between healthy individuals and cancer patients with a high level of sensitivity and specificity Citation[4], Citation[5].
However, unfavorable prognosis, high morbidity and deteriorating quality of life associated with current surgical and adjuvant treatment regimes of tonsillar cancer patients emphasize the need for new biomarkers. Proteomic based markers could thus lead to a more accurate and reliable diagnosis, response prediction to therapy and – in the future – to early diagnosis. As a first step, we compared the polypeptide expression of tonsillar cancer to corresponding normal epithelium in order to define biological markers that may characterize tonsillar cancer.
Materials and methods
Patients and surgical specimens
We included 19 patients diagnosed with tonsillar squamous cell carcinoma at the Department of Oto-Rhino-Laryngology and Head and Neck Surgery, Karolinska University Hospital, Stockholm. Samples were collected between February 2000 and March 2003. All patients underwent panendoscopy and samples were taken to get the histological diagnosis. The representativity of each sample was assessed by a pathologist, by comparing routine histology (H&E section) with a Giemsa stained smear of the filtrated cells. Only those samples that contained more than 95% tumor cells per smear after enrichment were considered for 2-DE evaluation.
All patients were assigned a TNM classification. In addition to the 19 tonsillar squamous cell carcinomas, 12 benign samples, harvested from the corresponding normal tonsillar squamous cell epithelium were analyzed. Sample processing and handling as well as quality-check by routine histology and Giemsa smears were performed as described for the cancer samples. Patient biographic data are presented in .
Table I. Biographic data and tumor classification.
The project has been approved by the local ethical committee (Dnr 02-099).
Sample preparation and cell enrichment
Tonsils were surgically removed, snap-frozen and immediately transferred to the lab after resection. Cells were harvested from the surface of the tumor and the normal epithelium by scalpel scraping. The exact handling was carried out as described earlier by our group Citation[5–7]. After preparation, each sample was quality checked by comparison of Giemsa-stained smears with histological slides. Only samples with more than 95% tumor cells were used.
Thereafter, the samples were stored in −80°C until they were used for 2-DE sample preparation. Prior to 2-DE, the dissected tonsillar epithelial cells were homogenized and solubilized in lysis buffer containing 7 M urea (BioRad), 2 M thiourea (Ridel-de Haen), 65 mM dithiothreitol, DDT (BioRad), 1 M Titriplex III (Merck), 25 mM CHAPS (Sigma), 5% Resolyte 4–8 (BDH Electran, UK), 0.5% NP-40 (USB, US), 3.5 mM NaOH (Merck), 0.0001% PMSF, phenylmethyl sulfonylfluoride (Merck), 0.01% Benzamidine, 0.01% 2.6-di-tertbutyl-4-methylphenol (Sigma). To antagonize endogenous proteases, protease inhibitors and DNAse/RNAse (Worthington Biochemicals) were added in addition to β-mercaptoethanol (Merck) and sodium dodecylsulfate (BioRad) as reducing and solubilizing agents. The samples were shaken three hours at room temperature followed by 15 minutes centrifugation at 13 400 g (Eppendorf centrifuge 5417R). The solubilized proteins were collected and the protein concentration was determined by Bradford protein assay as described earlier Citation[5].
Characterization of formalin-fixed specimens
Histopathological characterization was carried out using hematoxylin-eosin-stained sections of formalin-fixed and paraffin-embedded specimens. Tumors were characterized according to size, lymph node status and site of metastasis. Histopathological classification followed WHO criteria (TNM classification).
Two dimensional gel electrophoresis (2-DE)
2-D gel electrophoresis was performed as described elsewhere Citation[6]. In brief, 1st and 2nd dimension were performed as follows:
First dimension
Isoelectric Focusing (IEF). The solubilized protein samples were diluted in rehydration buffer containing 7 M urea (BioRad), 2 M thiourea (Ridel-de Haen), 65 mM CHAPS (Sigma), 0.5% Triton X-100 (Merck), 0.5% IPG buffer 4–7 (BioRad), and 18 mM dithiothreitol (BioRad). In total, 75 µg of each sample was diluted in 300 µL rehydration buffer and applied to precast immobilized pH gradient strips, IPG 4–7 linear, 17 cm (BioRad). The isoelectric focusing ran at 20°C in a Protean IEF cell (BioRad), reaching approximately 52 900 volt hours. The separation was performed stepwise starting at 500 volt and increasing to 8 000 volt during 10.5 hours.
Second dimension
Sodium Dodecyl Sulfate Polyacrylamide Gel Electrophoresis (SDS-PAGE). Before application to the second dimension, the IPG strips were equilibrated 2×15 minutes in 10 mL freshly made equilibration buffer [50 mM Tris-HCl, pH 8.8, 6 M urea (BioRad), 30% glycerol (Merck), 2% SDS (BioRad)]. 1% dithiothreitol was added to the first 15 minutes of equilibration and exchanged to fresh buffer with an addition of 2.5% iodoacetamide (Sigma) and few grains of bromphenolblue BFB (Merck) to the second 15 minutes incubation. The gel size was 500 cm2, 1.5 mm thick. The acrylamide concentration was a linear gradient between 10–13%. The electrophoresis running buffers consisted of 25 mM Tris, 192 mM glycine, 0.1% SDS (BioRad).The equilibrated IPG strips were carefully placed on top of the slab gels and fixed in position by sealing with 0.5% agarose dissolved in running buffer solution. The SDS-PAGE ran at 100 volt at 12°C for 19 hours.
Silver stain
Having a protocol for mass spectrometry compatible silver staining, we used the silver staining based on its simple handling, robustness and high sensitivity compared to e.g. coomassie. Thus, after 2-DE separation, gels were transferred into fixation buffer [30% ethanol (Kemetyl), 10% acetic acid (Sigma) in Milli-Q water], and incubated three times for 30 minutes each. This was followed by sensitization over night [0.5 M potassium acetate (Sigma), 20% ethanol, 8.3 M potassium tetrathionate (Merck) in Milli-Q water]. In the next step, gels were thoroughly rinsed with Milli-Q water six times for 20 minutes, followed by 2 hours exposure to silver stain [(0.2% silver nitrate (Merck), 5 mM HEPES (J T Baker) 0.026% formaldehyde (Riedel-de Haen) in Milli-Q water)]. The gels were quickly rinsed two times with Milli-Q water, followed by the development of the gels [(0.22 M potassium carbonate (Merck), 0.05 mM sodium thiosulfate (Merck) 0.009% formaldehyde (Riedel-de Haen) in Milli-Q water)]. Development was stopped by 5% acetic acid.
Data evaluation and statistical analysis
Silver stained gels were scanned by a flatbed scanner (GS 710, BioRad) and further analyzed by PDQuest 2-DE analysis software (BioRad, version 8.0). The analysis included protein spot detection, background subtraction and quantification Citation[8]. Individual polypeptides were quantified as parts per million of the total integrated optical density. Each spot sustained an individual identification number (SSP). Gel comparison was performed using the semi-automated gel to gel algorithm provided by the PDQuest software. Matching results were controlled manually for each spot in order to avoid and correct automated matching errors. Individual quantifications of resolved proteins were normalized according to the total intensity of valid spots. Regulation differences were detected using Student t-test at a significance level of 99%. All spots selected for identification showed at least a 3 fold change between the tumor and normal controls combined with statistical significance (p < 0.01). This analysis revealed 70 spots that were selected for identification. Based on limited protein spot size, we had no access to 20 of the 70 polypeptides. Of those 50 spots transferred to mass spectrometry, a total of 27 were successfully identified. These included 14 different protein entities. Several proteins (e.g. PACAP) occurred twice. The remaining 13 identified spots may represent specific isoforms showing different mobility based on posttranslational modification. The selection of the 14 identified proteins is demonstrated in .
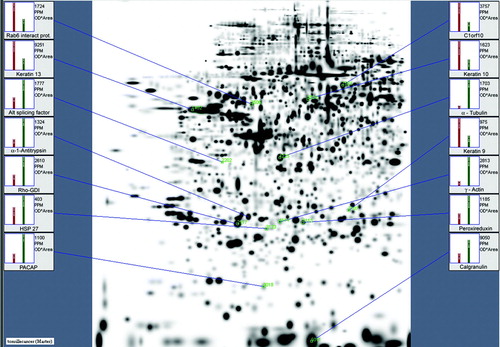
Figure 1. Mastergel with identified protein spots and the corresponding histograms (average protein expression and standard deviation)
Trypsin digestion and mass spectrometry
The proteins of interest were excised manually from the gels under sterile conditions in a hood to avoid contamination. In-gel digestion was performed after destaining of the silver, essentially as described Citation[9], using porcine, modified trypsin of sequence grade (Promega, Madison, WI, USA). Identification of proteins by peptide mass fingerprinting was performed on an Ultraflex MALDI TOF/TOF (Bruker Daltonics, Bremen, Germany). The instrument was optimized for analytes up to a mass of 4000 Da, and alfa cyano 4-hydroxy cinnamic acid was the matrix used. Search for protein identities was performed via the engine ProFound against the current version of the NCBInr sequence database (http://.prawl.rockefeller.edu), using a mass tolerance obtained from internal calibration with autodigestion peptides from trypsin.
Results
A total of 19 cancer samples and 12 corresponding benign controls were run with 2-DE. Gel scans were analyzed creating a matchset, consisting of 32 consecutive 2-DE gels (31 samples + 1 mastergel). Using PDQuest software, we were able to separate an average of 1616 protein spots within each single gel (a). In order to define the inter-tumor and inter-benign heterogeneity, correlation coefficients were calculated. The mean correlation between tumor samples was r = 0.675 while the normal controls showed a higher correlation of r = 0.717. Statistical analysis revealed 70 proteins differentially expressed between the tonsillar cancer samples and the benign control group. These proteins were at least 3 fold up- or down-regulated within the cancer samples. Of those 70 dysregulated proteins, we were able to excise a total of 50. We succeeded in identifying 27 proteins and protein isoforms. Of those 27 proteins and protein isoforms, several occurred twice. Therefore, shows the 14 remaining protein entities. This may reflect different isoform mobility due to posttranslational modification. As a representative example, b-d demonstrates the sequential expression changes of a protein (Rho-GDI) in the tumor samples and the normal controls. Mass spectrometry data with the identified proteins are presented in .
Figure 2. (a) Two representative 2-DE gels, pH 4-7 of a normal and a tumor sample. Close-up areas showing the Rho-GDI protein spot (arrow). (b). Representative PDQuest screenshot showing six segments of “normal gels” and five of “tumor gels”. The Rho-GDI spot is marked with a yellow square throughout all members. The master gel shows the corresponding histograms with the tumor sample marked in green and the normal sample marked in red. (c). Multi-channel view of the same gel-segments (Rho-GDI) visualizing the overexpressed protein in the tumor sample (blue) and the normal control (red). (d). 3-D rendered close-up segments confirming the Rho-GDI over expression in the tumor samples (arrows).
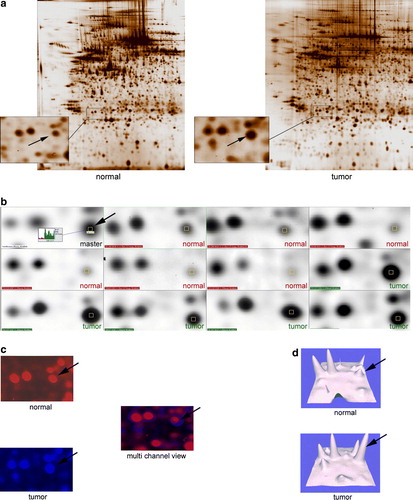
Table II. Identified proteins using MALDI-TOF and Swiss Prot/ Expasy database.
The identified deviating proteins could be assigned to different functional groups. Among differentially expressed proteins were structural proteins (cytokeratins), cytoskeletal proteins involved in cell-growth and cell-division (α-tubulin, γ-actin), proteins acting in post-translational regulation (ASF) as well as stress related proteins of the heat-shock family (HSP 27).
Discussion
In the present study, we focused on significant differences between protein profiles in tonsillar cancer and its corresponding normal squamous cell epithelium.
Evaluation with a 2-DE approach showed 70 proteins with significant expression differences between the tumor and its normal epithelium. Of those, 50 proteins were accessible for mass spectrometry and a total of 27 proteins and protein isoforms were identified.
The 27 polypeptides identified could be related to different functional groups.
Structural proteins like keratins, actins, and tubulins are parts of the cytoskeleton and cytoplasm. Keratins are members of the superfamily of intermediate filament (IF) proteins. They represent the most abundant proteins in epithelial cells and are encoded by two groups of genes, type I (K9–K20) and type II (K1–K8). In tonsillar cancer we found keratins 9, 10, and 13 to be down-regulated. Regauer and colleagues found similar down-regulation in cancer of the Waldeyer's ring Citation[10]. This fits to data published by Neugebauer et al., who used tonsillar epithelium as a routine source for oropharyngeal normal keratinocytes. They dissected peritonsillar strips of normal mucosa and found keratin 13 to be indicative for normal differentiated tonsillar mucosa Citation[11]. Kainuma and coworkers performed a c-DNA microarray study on head and neck cancers squamous cell carcinomas (HNSCC), comparing gene expression of normal tissue and cancer samples. Hierarchical cluster analysis of the array data of 17 HNSCC patients confirmed keratin 13 down-regulation on the mRNA level Citation[12]. Baker et al. performed a proteomic study on HNSCC using laser-capture microdissection combined with LC-MS/MS in order to identify tumor specific proteins. They found a much lower keratin 13 expression in neoplastic cells compared to the normal controls Citation[13]. Many cellular events are mediated through their association with the actin-cytoskeletal network. Annexin 5 is known to be an important modulator of the immune response against apoptotic cells, necrotic cells, and certain viruses. Weernink et al. found an interaction of phospholipase D with actin-microfilaments regulating cell proliferation Citation[14]. We were able to identify gamma-actin as significantly up-regulated in the tumor samples. How the overexpression of gamma-actin in our study is to be interpreted requires further evaluation.
Three distinct tubulin proteins are essential for microtubule function: α-, β-, and γ-tubulin. Those proteins are key-players during the cell cycle as they are part of the spindle apparatus. We observed an up-regulation within the tumor group, which may indicate a higher proliferation rate. Alpha-tubulin is already used as a predictive marker for chemoresistance in different human malignancies (e.g. breast cancer) Citation[15]. It is known that high expression of tubulins in tumor cells is associated with poor response to chemotherapy and a shorter progression-free survival Citation[16]. To date, proteomics-based studies in head and neck cancer did not report expression changes in these proteins Citation[2], Citation[3], Citation[17], Citation[18].
We were able to detect a second group with altered protein expression. This group consists of proteins involved in cellular transcription and translation, like Calgranulin B and the alternative splicing factor (ASF).
Calgranulin B (Calprotectin or S100A9) is a member of the S100 calcium binding protein family. Predominantly expressed in granulocytes and epithelial cells, its function comprises of the intracellular inhibition of casein kinase II, which results in the regulation of cellular transcription and translation Citation[19]. It is known that S100A9 activates MAP-kinase and the NF-κB signalling pathways in human prostate cancer Citation[20]. We found an up-regulated pattern of this protein in tonsillar cancer, a pattern that is well in line with previous publications, stating that this protein is up-regulated in tongue cancer Citation[17]. In contrast, Roesch-Ely and coworkers published a down-regulation of S100A9 in HNSCC Citation[21]. Melle et al. investigated a series of head and neck tumors using a classical proteomic approach combined with protein-chip technology. This study revealed a decrease of S100A9 expression as well. The authors state that the reason for this discrepancy may be based on the differences in the tumor entities investigated Citation[22]. This is in contrast to our data and several other studies on cancer tissue, showing increased expression levels of S100A9. To clarify these contradictory findings, further investigations will be necessary.
An additional protein that is up-regulated in tonsillar cancer is the alternative splicing factor (ASF). Alternative splicing modulates the expression of oncogenes and tumor suppressor genes. Karni et al. showed that ASF controls the alternative splicing of the tumor suppressor BIN 1 and the kinases MNK 2 and S6K 1. The resulting BIN 1 isoforms loses their tumor suppressor activity. This implies that ASF can act as an oncoprotein and that it might be a potential target for tonsillar cancer therapy Citation[23].
Upregulation of heatshock protein 27 (HSP 27) has previously been described as a potential marker for primary carcinomas of the vagina Citation[24]. This member of the heatshock family, which was upregulated in our tumor samples, is considered a putative biomarker for malignancy and reflects structural and metabolic disintegrity of cells. Muzio et al. suggested that HSP 27 overexpression may be useful in order to identify cases of oral squamous cell cancer with more aggressive and invasive phenotypes Citation[25]. Furthermore, Muzio and coworkers postulated that a reduced expression of HSP 27 is an early marker of poor prognosis and useful in identifying aggressive biological behaviour in oral squamous cell cancer Citation[26]. It has been implicated that down-regulation of HSP 27 may confer to chemo-resistance associated with cellular growth delay Citation[27]. Consistent with our findings of up-regulated HSP 27 in tonsillar cancer, other investigations on oral cancer have found a similar expression pattern of this protein Citation[3], Citation[17], Citation[18].
A fourth group includes proteins which are involved especially in apoptosis, like Rho-GDI and PACAP.
The Rho small G protein family, which includes the Rho, Rac and Cdc42 subfamilies, is implicated in various cell functions such as apoptosis, cell shape change, cell motility and cytokinesis, through the reorganization of actin filaments. Rho-GDI is frequently over expressed in human tumors and in chemo-resistant cancer cell lines, implying that Rho-GDI may play an important role in the development of drug resistance by protecting cancer cells from apoptosis. Rho-GDI was also found to be overexpressed in oral squamous cell cancer Citation[18]. This coincides with our data of up-regulated Rho-GDI in tonsillar cancer.
The pituitary adenylate cyclase-activating polypeptide (PACAP) superfamily includes nine hormones that are related by structure, distribution (brain and gut), function and receptors (a subset of seven-transmembrane receptors).
The diverse functions of PACAP include regulation of proliferation, differentiation, and apoptosis. Expression patterns of this protein in different tumor types suggests that it has a paracrine/autocrine effect on malignant transformation Citation[28]. However, we found an increased synthesis of PACAP in tonsillar cancer.
Rab6 is an ubiquitous ras-like GTP-binding protein associated with the membranes of the Golgi complex Citation[29]. Rab6 protein is involved in the retrograde transport from the endosomal recycling compartment to the Golgi, and from there to the endoplasmatic reticulum. This process is not fully understood and identification of more Rab6 partners may help in understanding how complex pathways of intracellular trafficking are modulated. Shan et al. correlated Rab6 with multidrug resistance. In a semi quantitative reverse transcriptase PCR, they showed that members of the Rab6 gene family were significantly down regulated in the MCF7 breast cancer cell line Citation[30]. Roelofs et al. demonstrated that a selective inhibition of prenylation induces apoptosis but not s-phase arrest Citation[31]. Down-regulation of this protein was also found in our tonsillar cancer samples.
Apoptosis is known to be induced by direct oxidative damage due to oxygen free radicals or hydrogen peroxide. Peroxireduxin (Prx), which we found to be significantly up-regulated in our tumor specimens, plays an important role in elimination of peroxides generated during metabolism. Thioredoxin peroxidases have been shown to be overexpressed in several tumor types and may play an important role in resistance to chemo- and/or radiotherapy in oropharyngeal cancer Citation[32]. Furthermore, a high expression level of thioredoxin peroxidase correlates with advanced tumor stages and high recurrence rate. Over expression of Prx was used as a predictor for lymph node metastasis Citation[32]. Our findings and the data of the current literature suggest that Prx acts as an inhibitor of apoptosis, thus promoting uncontrolled tumor proliferation Citation[33].
Alpha-1-antitrypsin (A1AT) is a 52 kDa glycoprotein produced mainly by hepatocytes. The main function of A1AT is to inhibit the action of neutrophilic elastase, a serine protease that hydrolyzes elastin fibers in the lungs. Trachte and colleagues were able to detect increased A1AT-levels in pancreatic adenocarcinomas Citation[34]. In a comparative analysis of breast cancer and adjacent normal breast cancer tissue, Deng and colleagues showed an increased level of A1AT in breast cancer samples Citation[35]. We found A1AT to be up-regulated in tonsillar cancer.
A recently identified protein encoded by the C1orf10-gene is the so called tumor related protein or cornulin, which was described to be esophageal specific and a marker for cancer development. Xu et al. suggested its presence to be unique in esophageal cells, but Contzler and coworkers detected the structure to be similar to features of the “fused gene” family combining sequences and structural similarities of both the S100 proteins and precursor proteins of the cornified cell envelope as in profilaggrin, trichohyalin, and repetin Citation[36], Citation[37]. Induction of C1orf10 expression results in a significant decline of cell proliferation and in an arrest of the G-1 phase of the cell cycle. It induces downregulation of cyclin D1 expression. Our results suggest that the downregulation of C1orf10 found in tonsillar cancer plays a key role in carcinogenesis.
Conclusion
Tonsillar cancer incidence has increased dramatically over the last decades. This cancer entity is frequently a challenge to diagnose, treat and follow up. There is however, intense interest in applying proteomic technologies in developing biomarkers for early detection and diagnosis of malignancies. In this study we used 2-DE based proteomics and mass spectrometry combined with multivariate analysis to define 27 polypeptides that characterizes tonsillar cancer. Even though these promising results have to be further validated, the polypeptides found may act as a basis for a biomarker panel in the future.
Acknowledgements
Grants from the Cancer Society Stockholm, the Laryngeal Foundation, Karolinska Institutet, Stockholm are gratefully acknowledged. There is no conflict of interest.
References
- Hammarstedt L, Lindquist D, Dahlstrand H, Romanitan M, Dahlgren LO, Joneberg J, et al. Human papillomavirus as a risk factor for the increase in incidence of tonsillar cancer. Int J Cancer 2006; 119: 2620–3
- Nagpal JK, Das BR. Oral cancer: Reviewing the present understanding of its molecular mechanism and exploring the future directions for its effective management. Oral Oncol 2003; 39: 213–21
- Turhani D, Krapfenbauer K, Thurnher D, Langen H, Fountoulakis M. Identification of differentially expressed, tumor-associated proteins in oral squamous cell carcinoma by proteomic analysis. Electrophoresis 2006; 27: 1417–23
- Petricoin EF, Ardekani AM, Hitt BA, Levine PJ, Fusaro VA, Steinberg SM, et al. Use of proteomic patterns in serum to identify ovarian cancer. Lancet 2002; 359(9306)572–7
- Roblick UJ, Hirschberg D, Habermann JK, Palmberg C, Becker S, Kruger S, et al. Sequential proteome alterations during genesis and progression of colon cancer. Cell Mol Life Sci 2004; 61: 1246–55
- Franzen B, Linder S, Okuzawa K, Kato H, Auer G. Nonenzymatic extraction of cells from clinical tumor material for analysis of gene expression by two-dimensional polyacrylamide gel electrophoresis. Electrophoresis 1993; 14: 1045–53
- Lexander H, Franzen B, Hirschberg D, Becker S, Hellstrom M, Bergman T, et al. Differential protein expression in anatomical zones of the prostate. Proteomics 2005; 5: 2570–6
- Garrels JI. The QUEST system for quantitative analysis of two-dimensional gels. J Biol Chem 1989; 264: 5269–82
- Hellman U. Sample preparation by SDS/PAGE and in-gel digestion. Exs 2000; 88: 43–54
- Regauer S, Beham A, Mannweiler S. CK7 expression in carcinomas of the Waldeyer's ring area. Hum Pathol 2000; 31: 1096–101
- Neugebauer P, Bonnekoh B, Wevers A, Michel O, Mahrle G, Krieg T, et al. Human keratinocyte culture from the peritonsillar mucosa. Eur Arch Otorhinolaryngol 1996; 253: 245–51
- Kainuma K, Katsuno S, Hashimoto S, Oguchi T, Suzuki N, Asamura K, et al. Differences in the expression of genes between normal tissue and squamous cell carcinomas of head and neck using cancer-related gene cDNA microarray. Acta Otolaryngol 2006; 126: 967–74
- Baker H, Patel V, Molinolo AA, Shillitoe EJ, Ensley JF, Yoo GH, et al. Proteome-wide analysis of head and neck squamous cell carcinomas using laser-capture microdissection and tandem mass spectrometry. Oral Oncol 2005; 41: 183–99
- Oude Weernink PA, Lopez de Jesus M, Schmidt M. Phospholipase D signaling: Orchestration by PIP(2) and small GTPases. Naunyn Schmiedebergs Arch Pharmacol 2007; 374: 399–411
- Bernard-Marty C, Treilleux I, Dumontet C, Cardoso F, Fellous A, Gancberg D, et al. Microtubule-associated parameters as predictive markers of docetaxel activity in advanced breast cancer patients: Results of a pilot study. Clin Breast Cancer 2002; 3: 341–5
- Seve P, Dumontet C. Chemoresistance in non-small cell lung cancer. Curr Med Chem Anticancer Agents 2005; 5: 73–88
- He QY, Chen J, Kung HF, Yuen AP, Chiu JF. Identification of tumor-associated proteins in oral tongue squamous cell carcinoma by proteomics. Proteomics 2004; 4: 271–8
- Lo WY, Tsai MH, Tsai Y, Hua CH, Tsai FJ, Huang SY, et al. Identification of over-expressed proteins in oral squamous cell carcinoma (OSCC) patients by clinical proteomic analysis. Clin Chim Acta 2007; 376: 101–7
- Hessian PA, Edgeworth J, Hogg N. MRP-8 and MRP-14, two abundant Ca(2 + )-binding proteins of neutrophils and monocytes. J Leukoc Biol 1993; 53: 197–204
- Hermani A, De Servi B, Medunjanin S, Tessier PA, Mayer D. S100A8 and S100A9 activate MAP kinase and NF-kappaB signaling pathways and trigger translocation of RAGE in human prostate cancer cells. Exp Cell Res 2006; 312: 184–97
- Roesch-Ely M, Nees M, Karsai S, Ruess A, Bogumil R, Warnken U, et al. Proteomic analysis reveals successive aberrations in protein expression from healthy mucosa to invasive head and neck cancer. Oncogene 2007; 26: 54–64
- Melle C, Ernst G, Schimmel B, Bleul A, Koscielny S, Wiesner A, et al. A technical triade for proteomic identification and characterization of cancer biomarkers. Cancer Res 2004; 64: 4099–104
- Karni R, de Stanchina E, Lowe SW, Sinha R, Mu D, Krainer AR. The gene encoding the splicing factor SF2/ASF is a proto-oncogene. Nat Struct Mol Biol 2007; 14: 185–93
- Hellman K, Alaiya AA, Schedvins K, Steinberg W, Hellstrom AC, Auer G. Protein expression patterns in primary carcinoma of the vagina. Br J Cancer 2004; 91: 319–26
- Lo Muzio L, Leonardi R, Mariggio MA, Mignogna MD, Rubini C, Vinella A, et al. HSP 27 as possible prognostic factor in patients with oral squamous cell carcinoma. Histol Histopathol 2004; 19: 119–28
- Lo Muzio L, Campisi G, Farina A, Rubini C, Ferrari F, Falaschini S, et al. Prognostic value of HSP27 in head and neck squamous cell carcinoma: A retrospective analysis of 57 tumours. Anticancer Res 2006; 26: 1343–9
- Lee JH, Sun D, Cho KJ, Kim MS, Hong MH, Kim IK, et al. Overexpression of human 27 kDa heat shock protein in laryngeal cancer cells confers chemoresistance associated with cell growth delay. J Cancer Res Clin Oncol 2007; 133: 37–46
- Li M, Cortez S, Nakamachi T, Batuman V, Arimura A. Pituitary adenylate cyclase-activating polypeptide is a potent inhibitor of the growth of light chain-secreting human multiple myeloma cells. Cancer Res 2006; 66: 8796–803
- Goud B, Zahraoui A, Tavitian A, Saraste J. Small GTP-binding protein associated with Golgi cisternae. Nature 1990; 345(6275)553–6
- Shan J, Mason JM, Yuan L, Barcia M, Porti D, Calabro A, et al. Rab6c, a new member of the rab gene family, is involved in drug resistance in MCF7/AdrR cells. Gene 2000; 257: 67–75
- Roelofs AJ, Hulley PA, Meijer A, Ebetino FH, Russell RG, Shipman CM. Selective inhibition of Rab prenylation by a phosphonocarboxylate analogue of risedronate induces apoptosis, but not S–phase arrest, in human myeloma cells. Int J Cancer 2006; 119: 1254–61
- Yanagawa T, Iwasa S, Ishii T, Tabuchi K, Yusa H, Onizawa K, et al. Peroxiredoxin I expression in oral cancer: A potential new tumor marker. Cancer Lett 2000; 156: 27–35
- Bae JY, Ahn SJ, Han W, Noh DY. Peroxiredoxin I and II inhibit H(2)O(2)-induced cell death in MCF-7 cell lines. J Cell Biochem 2007.
- Trachte AL, Suthers SE, Lerner MR, Hanas JS, Jupe ER, Sienko AE, et al. Increased expression of alpha-1-antitrypsin, glutathione S-transferase pi and vascular endothelial growth factor in human pancreatic adenocarcinoma. Am J Surg 2002;184:642–7; Discussion 7–8.
- Deng SS, Xing TY, Zhou HY, Xiong RH, Lu YG, Wen B, et al. Comparative proteome analysis of breast cancer and adjacent normal breast tissues in human. Genom Proteom Bioinform 2006; 4: 165–72
- Contzler R, Favre B, Huber M, Hohl D. Cornulin, a new member of the “fused gene” family, is expressed during epidermal differentiation. J Invest Dermatol 2005; 124: 990–7
- Xu Z, Wang MR, Xu X, Cai Y, Han YL, Wu KM, et al. Novel human esophagus-specific gene c1orf10: cDNA cloning, gene structure, and frequent loss of expression in esophageal cancer. Genomics 2000; 69: 322–30