Abstract
Introduction. The Nordic Occupational Cancer study (NOCCA) is a cohort study based on employed populations in one or more censuses in Denmark, Finland, Iceland, Norway and Sweden. The large size of the cohort allows us to study rare cancers and to identify even small risks by occupation and by specific occupational exposures. This paper describes principles and experiences of the construction of job-exposure matrices (JEMs), an instrument to transform the history of occupational titles into quantitative estimates of exposure to potential carcinogenic substances. Material and methods. For each Nordic country, a national JEM was constructed by a team of experts on the basis of the Finnish matrix (FINJEM) that has been used in similar national studies since the mid-1990s. Results. The structure of the Nordic JEMs is three-dimensional (over 300 occupations, over 20 agents, 4 periods covering 1945–1994). Exposure is characterised by estimates of the prevalence and level of exposure. Important differences between the Nordic countries were observed for several exposures. Discussion. The selection of priority agent-occupation combinations and the adoption of general principles in the beginning of the work were necessary because of the high number of estimates to be evaluated (over 50 000/country). The selective modification of an existing JEM for use in other countries was a feasible, albeit challenging task, because exposure data and information about the use of chemicals in the past was scanty. As compared to the use of FINJEM for all Nordic countries, the modification process will probably increase the validity of dose-response and risk estimates of occupational cancer which is to be expected soon as the main outcome of the NOCCA project.
Epidemiological studies based on entire national populations are potentially a powerful tool in the detection of occupational risks. Population censuses have been used to study the incidence of cancer in different occupations, e.g., in Nordic countries Citation[1], Citation[2] and Switzerland Citation[3]. This approach has not yet systematically addressed exposure to chemical agents or other factors causing cancer. The identification of etiologic factors requires in this context that information on occupational titles can be converted to information on exposures to potential carcinogens and other risk factors. In large census-based studies a generic job-exposure matrix (JEM) covering all occupations in a national classification is often the only practical option to perform the required conversion. If the JEM is valid, the epidemiological study may be able to identify agents causing the risk, and to estimate dose-response relationships for these exposures and thereby add substantially information which is useful in the prevention of occupational cancers.
Generic JEMs for large epidemiological studies or other purposes have been constructed, e.g., in the United States Citation[4–6], the United Kingdom Citation[7], France Citation[8], Citation[9], Sweden Citation[10] and Finland Citation[11]. Although generic JEMs have been designed primarily for national use, they have also been used outside their country of origin. For instance, the UK matrix has been used in Finland Citation[12] and the Finnish JEM in Australia Citation[13–15], Germany Citation[16–18], Spain Citation[19–21] and Sweden Citation[22]. Directly using an existing JEM as such is the simplest and cheapest solution, but the use of a JEM designed for other studies raises doubts about the validity. Particularly when a JEM from another country is considered to be used, the differences between countries in occupational exposures should be taken into consideration.
An alternative for use of a foreign matrix as such would be to create an entirely new national JEM, or to modify an existing JEM to correspond to national work conditions. Because constructing a new JEM requires a substantial amount of resources, time and expertise, the modification of an existing JEM to correspond better to the exposure circumstances of the country of application becomes a conceivable option. The modification may increase the validity of the resulting JEM as compared to the direct use of an existing JEM, and to save resources as compared to the construction of an entirely new JEM. To our knowledge the present article is the first one in epidemiological literature, which describes the modification process of a JEM. Our experiences and solutions may be helpful for other research groups planning to use a similar approach.
The Nordic occupational cancer study (NOCCA) aims to identify occupations and etiologic factors associated with cancer risks. It is a very large cohort study based on the follow-up of working populations in one or more censuses in Denmark, Finland, Iceland, Norway and Sweden. The total number of workers in the follow-up is 15 million and the number of cancer cases diagnosed after the earliest census 2.8 million. Standardised incidence ratios (SIR) have been calculated to 54 occupational categories as regards over 70 different cancers or histological subtypes of cancer Citation[2].
NOCCA aims to go beyond occupational titles by converting them to quantitative exposure estimates of 28 agents with the help of national JEMs. These analyses will include a possibility to control confounding due to occupational co-exposures by JEMs and due to life-style confounders (smoking, alcohol, obesity, physical exercise, parity etc) derived from other available datasets. The large size of NOCCA allows for the study of associations between a wide range of risk factors/occupations and cancer sites/cell types, including rare ones.
The objective of the work reported in this article was to construct generic JEMs on the basis of one existing JEM for use in NOCCA study. The resulting NOCCA-JEMs for Denmark, Finland, Iceland, Norway and Sweden are called hereafter NOCCA-DANJEM, NOCCA-FINJEM, NOCCA-ICEJEM, NOCCA-NORJEM and NOCCA-SWEJEM. We also tried to assess the costs (work time taken) and benefits of the JEM modification process. This paper describes NOCCA-JEMs and their construction process. Two other articles in the present issue are closely related to this article. One of them Citation[2] reports the results of occupation-based analyses of the NOCCA study, and another Citation[23] discusses the possible biases which may be generated when using quantitative job-exposure matrices, such as NOCCA-JEMs. The results of epidemiological studies by applying the constructed NOCCA-JEMs will be reported elsewhere.
Material and methods
The epidemiologists of the NOCCA study (NOCCA-EPI team) decided to adopt the JEM approach based on the modification of the Finnish job-exposure matrix (FINJEM). A team of exposure experts was selected from five Nordic countries (NOCCA-JEM team). This team consisted of two Finnish (TK, PH), two Norwegian (TW, KL), one Swedish (NP), one Danish (JH) and one Icelandic (VK) expert. One epidemiologist (EP) participated in the meetings of the NOCCA-JEM team, and one exposure expert (TK) participated in the meetings of the NOCCA-EPI team to guarantee efficient communication between the teams.
Materials used in the construction of NOCCA-JEMs
The Finnish job-exposure matrix (FINJEM) was used as a base matrix to construct NOCCA-JEMs for Denmark, Iceland, Norway and Sweden. It was constructed in the 1990s to be used in census-based Finnish epidemiological studies on occupational cancer Citation[11]. The FINJEM has three dimensions: agents, occupations, and exposure periods. The agent-dimension of FINJEM currently includes over 80 chemical, physical, microbiological, ergonomic and psychosocial factors. The occupational dimension covers all occupations (311 categories) of the longitudinal occupational classification used in Finnish censuses. The time-dimension covers the periods 1945–1959, 1960–1984, 1985–1994, 1995–1997, 1998–2000 and 2001–2003. The cells of this 3-dimensional matrix characterise occupational exposure in an occupation by two measures: the proportion of exposed (P) and the mean level of exposure (L). The minimum level of exposure included is defined agent by agent. For chemical agents, the minimum criterion is usually occupational inhalatory exposure to a level exceeding the specified background level originating from non-occupational exposure. The level of exposure is expressed as long-term (one-year average during working hours) concentration of the agent in workroom air among the exposed workers. The FINJEM database also includes documentation on the grounds of estimates, definitions of agents, and measurement/survey data.
The NOCCA-EPI team selected exposures of interest (). Twenty of them were included in the background matrix (FINJEM). In its work the NOCCA-JEM team used two Excel files derived from the original FINJEM database called ‘the FINJEM estimate file’ and ‘the FINJEM documentation file’. The FINJEM estimate file provided the Finnish exposure estimates (P and L) for 20 NOCCA-agents by occupation and period. The file also included the definitions of the agents, and the sizes of the occupations (numbers of the employed) in the Finnish Census 1970. The FINJEM documentation file contained the specification of the exposed groups or subgroups, information on the source of exposure, and estimates of continuity/intermittency of exposure in the 1980s. This file made visible the components which were used to calculate the P and L in FINJEM. The FINJEM estimates were copied in the first phase of the modification process as default values for other countries within the FINJEM estimate file.
Table I. Agents included and time periods covered by the job-exposure matrices (NOCCA-JEMs) of Denmark, Finland, Iceland, Norway and Sweden.
Information on exposed occupations and exposure prevalences in the Nordic countries were based on the knowledge of the national experts in the exposure team, on the FINJEM default estimates, and on the Finnish cross-tabulation of the numbers of employed by occupation and industry in 1995 in Finland. Information on exposure levels was obtained, in addition to FINJEM and its documentation file, from exposure measurement data available in the Nordic countries. FINJEM database itself includes the averages and ranges of over 4 000 measurement sets based on tens of thousands of samples.
Totally new exposure estimates were given by the team for eight chemical agents that were not included in FINJEM (see ). These new estimates were based mainly on existing air measurement data of these agents, and on information about the structure and substructure of industries in different Nordic countries. Thousands of exposure measurements by job tasks were available for quartz dust (crystalline silica) in Sweden from 1970–1990. These data, together with measurement results from Finland and Norway, were used to reassess quartz exposure levels for the NOCCA-JEMs. Swedish data by Lewne and co-workers Citation[24] were extensively used to modify diesel exhaust estimates. Exposure level estimations for the new organic solvents were based on Danish, Finnish and Norwegian measurement data (results from several thousand samples), originating mainly from the respective national measurement databases Citation[25], Citation[26].
The exposure periods assessed were 1945–1959, 1960–1974, 1975–1984 and 1985–1994. The FINJEM period 1960–1984 was split into two because exposure levels and agents used may have changed essentially in the 1970s. The periods since 1995 were not assessed because their relevance for the epidemiological analyses was considered small due to the long latency period usually required for the occurrence of cancer. Also exceptional cut-off years between periods were allowed because some exposures may have changed rapidly during a short period (e.g., due to the prohibition of asbestos). To keep the assessment methods and exposure definitions consistent and comparable, Ps and Ls for all countries were first estimated to the Finnish occupational titles (FINJEM occupations) which were later converted into the corresponding national classifications of occupations.
The construction process of NOCCA-JEMs
Because the number of P and L estimates to be checked or produced was very large (over 50 000/country), it was necessary to adopt general principles and to set priorities. The general principles of the modification agreed upon were as follows:
The FINJEM estimates, as reviewed and modified by the team, were also used for other countries if there was no credible reason to believe that exposure (P or L of an occupation) was essentially different. The difference was considered important if P or L was assessed to be <50% or >150% of the corresponding FINJEM estimate. However, some smaller differences were accepted, provided that there was good supportive data available.
Chemical exposures whose P in an occupation was below 5% during all periods were not included. The assessment threshold of non-chemical agents was 10%, i.e., exposures whose P was below 10% were excluded. The Ps and Ls of non-chemical agents were estimated for the period 1985–1994 only, because no reliable data were available for other periods.
The emphasis of the assessment was in large occupations (the number of exposed workers high) with substantial exposure (P*L high or moderate). A reasonable ranking of occupations was considered more important than finding the most correct values for P and L.
The reasons to modify the FINJEM estimate were documented by national experts. The documentation was partially incomplete, often consisting of just one sentence in the Remarks column of the estimate file.
The need to use different estimates for men and women within the same occupation was studied. However, only in farming occupations was evidence that exposures of men and women differed substantially. Some other differences were identified during the work, but they were not considered to be important enough to require different estimates for men and women.
In the end of the modification process, the exposure estimates for Denmark, Iceland, Norway and Sweden, originally created for categories of occupations in the Finnish Census, were converted to national classifications to be used in the other parts of NOCCA study (cancer tabulation and tabulation of life-style confounders). For each occupation of the national classification, the estimates of the best proxy FINJEM occupation (as to occupational exposure) were generally used.
The priority agent-occupation combinations were identified (N = 74) based on the prevalence and level of exposure and the numbers of employed (see Principle 3 above and ). The possibility of marked exposure differences in the Nordic countries (see Principle 1) was discussed agent by agent, and new P and L values were proposed whenever such differences were probable. A flow chart was designed to guideline exposure assessment (). The key issues in the use of measurement data were the representativeness of measurement data and the annual duration of exposure. If ‘worst case’ measurements, problematic workplaces or only workers with heavy exposure were included in the dataset, data could not be directly used to estimate the annual mean level of exposure. Random variation also disqualified many available datasets, because the number of measurements for a specified JEM-occupation was often low.
Figure 1. Selection of priority occupations and estimation of the level of exposure in the job-exposure matrices of the Nordic countries (NOCCA-JEMs) when external exposure data were available.
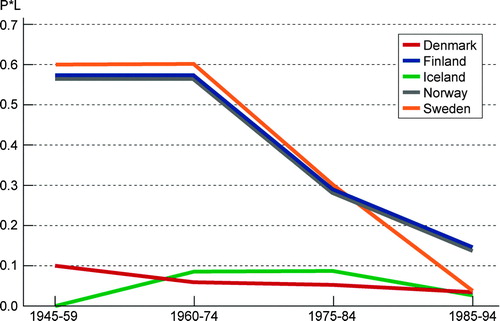
Only scanty measurement data were available from the early periods (1945–1959 and 1960–1974), and they often represented ‘worst case’ scenarios. For some agents there was evidence of decreasing levels over time. A higher (or sometimes lower) exposure was assigned to an occupation for early periods only if there was a credible reason to do so. Graphical presentations based on the product of the prevalence and level (P*L) were used to check the exposure ranking of occupations, exposure differences by country, and exposure trends over time. Two examples of the types of graphs used are presented in and . shows that the highest exposure to silica in 1960–1974 was estimated to occur among stone cutters, foundry workers and miners/quarrymen, but that exposure in Iceland and Denmark was substantially lower than in Finland, Norway and Sweden. The reason for this is that domestic stone materials in Iceland and Denmark include significantly less crystalline silica than in other Nordic countries. According to the exposure of foundry workers in Finland, Sweden and Norway was estimated to drop after the period 1960–1974.
Figure 2. Occupations with highest exposure to crystalline silica on the basis of the product of the prevalence and level of exposure (P*L) in the Nordic countries in 1960-1974.
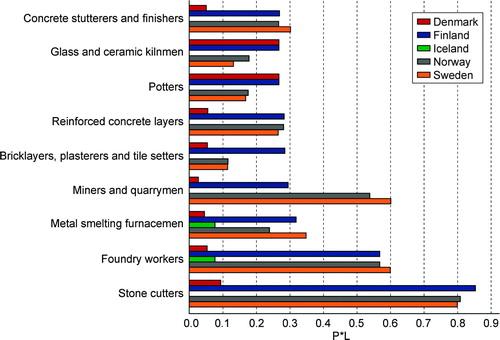
Figure 3. Time trend of the product of prevalence and level of exposure (P*L) to crystalline silica among foundry workers in the Nordic countries in 1945-1994.
Bystander exposures such as ‘passive exposure’ to welding fumes could not be taken into account. The difficulty was that the occupations of the bystanders were often unknown or unspecific (e.g., unskilled worker with multiple tasks) which made the assignment of exposures challenging or impossible.
The NOCCA-JEM team also modified the original FINJEM estimates, thus creating a specific NOCCA-FINJEM. Changes were made to the estimates of 140 of 6 220 agent-occupation combinations of the original FINJEM. They concerned mainly combinations which were originally considered as exposed (118 of 282). Some originally unexposed combinations were also considered as exposed (22 of 5 938). Altogether 101 exposed and 2378 unexposed combinations were added to all NOCCA-JEMs due to eight new agents which were not covered by the original FINJEM.
All estimates (P and L) of ultraviolet (UV) radiation were re-estimated by an expert at FIOH (Dr. Maila Hietanen), and the levels were modified by country-specific multipliers in order to allow for the varying intensity of exposure by the geographic location of the country. The coefficients for the countries were: Finland 1, Denmark 1.25, Iceland 0.8, Norway 1.1, and Sweden 1.2. The correction factors originated from a review on UV exposure by latitude Citation[27].
After reviewing and modifying the estimates, they were converted to the national occupational classifications which will be used in the actual exposure estimations in NOCCA dose-response analyses. The basic principle was to select the best proxy (as to occupational exposure) for each national occupational class from the Finnish classification of occupations (see Principle 6). This was straightforward when the national occupational class was identical or very similar to the Finnish one. There were many occupations with no exposure to any of the NOCCA agents, and all P and L values could therefore be set directly to zero. Sometimes the national occupational class consisted of two or more FINJEM classes, which required combining the estimates of these occupational classes. The P and L values were calculated in such cases as weighted averages from the values of these‘component’ occupations taking into account their sizes. There were also special cases where the national classification was more specific (e.g., battery workers in Sweden) than in the original (FINJEM) classification. In those cases P and L values were assessed separately by the national expert.
Results
The basic structure of the resulting NOCCA-JEMs is presented in . The NOCCA-JEMs are three dimensional (agents, occupations, periods) and occupational exposure is characterised in the cells by two metrics: the prevalence of exposure (% of exposed among the employed, P) and the annual mean level of exposure among the exposed (in agent-specific units, L). The number of agents in NOCCA-JEMs is 28 (). The number of occupational classes is 492 for men and 447 for women in Denmark, 311 in Finland, 374 in Iceland, 322 in Norway, and 296 in Sweden. The periods included in NOCCA-JEMs are 1945–1959, 1960–1974, 1975–1984 and 1985–1994 for all chemical agents, and 1985–1994 for all non-chemical agents. One element of NOCCA-JEMs (agent-occupation-period-specific estimates of P and L for different countries) is presented in .
Figure 4. The structure of the job-exposure matrices (NOCCA-JEMs) of Denmark, Finland, Iceland, Norway and Sweden. P is the prevalence of exposure (%), and L the average level of exposure among the exposed (in concentration units).
Table II. One example element of NOCCA-JEMs. The estimates of the prevelence of exposure (%) and the level of exposure (mg/m3) for crystalline silica among miners in the period 1960-1974.
The exposure estimates for Iceland differed sometimes markedly from other Nordic countries, because the structure of Icelandic industry and the materials used in manufacturing are different from those in other countries. Examples of major differences by agent are presented in .
Table III. Examples of major differences of occupational exposure in similar occupations between five Nordic countries.
The total workload of this modification process, as reported by the NOCCA-JEM-team, was 133 work-weeks. Out of that, planning took 10 weeks (8%), data collection 46 weeks (35%), exposure assessments 54 weeks (40%), technical tasks 6 weeks (5%), occupational conversions 12 weeks (9%) and other tasks 5 weeks (4%). These figures do not yet include the time which will be needed to make the program which links NOCCA-JEMs with epidemiological NOCCA data. The workload varied by country, being highest in countries where industrial hygiene data were collected and analysed for this project. Altogether four 2-day meetings of the NOCCA-JEM team, ten teleconferences and three 1–2-day meetings of individual team members were arranged during the project.
Discussion
The NOCCA-JEMs are based on available data and expert opinions which are likely to add to their validity. We found no way to directly test the validity of the NOCCA-JEMs, because there were no alternative estimates from the Nordic countries available to compare with. Limited indirect evidence of the validity of the base JEM (FINJEM) exists. When applied to Finnish census-based cancer data, FINJEM was able to replicate the established connection and exposure-response relationship between occupational exposure to silica dust and lung cancer Citation[28]. Several cancer studies using this approach have also passed the peer-review process of scientific journals Citation[29–32]. Although individual estimates of these JEMs may be‘incorrect’, we are confident that they are accurate enough to rank occupations correctly by the external dose of occupational exposure (as expressed by P*L).
An argument against the use of generic JEMs is that they misclassify exposures of individuals and thereby tend to mask the actual risks in epidemiological studies Citation[33], Citation[34]. This feature is inherent to generic JEMs because the prevalence of exposure is rarely 100%. The level of exposure also varies between individuals holding the same occupation. In certain occupations, such as several woodwork occupations or stone cutters, exposure pattern is probably homogenous, whereas e.g. the job title “chemical process workers” includes subgroups from different industries (paint manufacturing, oil refining, pharmaceutical industry and others), resulting in a heterogeneous exposure pattern within this occupation.
Cumulative exposure (CE) is considered often to be the preferable exposure metric for chronic diseases, whereas high peak exposures are thought to generate mainly acute effects. If peak exposures are judged to be relevant, they can also be addressed by JEMs. The prevalence and level (e.g., expressed as frequency) of exposure to peaks may be assessed as a separate entity (‘peak exposure to agent X’) in the JEM. Another crude way to study effects of peak exposures is to assign only such occupations exposed whose mean exposure level according to the JEM exceeds a set threshold level. However, we did not include peak exposures in our NOCCA-JEMs, because cancer is a chronic disease likely to be associated more closely to CE than peak exposures. When using cumulative exposure (i.e., P*L multiplied by the number of years in the respective occupation) all individuals holding the same occupation for the same number of years are classified similarly as to exposure, irrespective of their true exposure status or level. For example, if the true P = 50% and L = 10 ppm in an occupation, half of the workers are exposed to an average of 10 ppm per annum and half of them are unexposed. In a cohort study, all those workers are treated as exposed to 5 ppm (=P*L) because the actually exposed and unexposed individuals can not be distinguished from each other. Many of them will therefore be misclassified as exposed, both in qualitative and quantitative sense. Provided that P and L are correct, P*L estimates correctly the average amount of the annual exposure in the occupation (at the group level, at the aggregate level). However, due to the use of aggregate data, there will always be misclassification between exposure categories which may bias the observed exposure-response relationship. The issue is further complicated by the misclassification of confounding factors. The possible biases and their effects under different within-category exposure assumptions are discussed in more detail in the context of the NOCCA study in a separate statistical paper Citation[23].
One aim of the present study was to identify important exposure differences between the Nordic countries. Most exposures could be considered fairly similar in the Nordic countries, and only a few major differences were identified (see ). Over 60% of occupations, including most‘white-collar’ occupations, did not entail exposure to any chemical agents of the NOCCA study in any of the Nordic countries. The adopted procedure was mainly designed to detect substantial differences and was focused on large occupations experiencing high or moderate exposure (see Principle 3). The Nordic countries are rather homogenous by economic structures, and there are probably large differences in exposures between the Nordic countries and, e.g., the developing countries. Small differences in occupational exposure between countries are likely to be very common, but they could not be identified in the present study with reasonable effort. Our view is that it is important to identify at least qualitative (yes/no) exposure differences in major occupations so that exposures will not be incorrectly assigned to totally unexposed occupations. Some examples of big (yes/no) differences leading to the correction of occupation-specific estimates are presented in .
There were many major challenges during the work. Hardly any measurement data were available for the earliest period (1945–1959), and information on the use of chemicals in different processes and occupations was scanty. The estimates for this period should therefore be considered mainly as ‘educated guesses’. Further, if measurements were available, they often concerned industries and tasks rather than specific occupations which were used in the Census data. Another challenge was in the use of available measurement data. The assessment of the representativeness and reliability of data was often not possible due to the lack of accurate documentation. The third difficulty was estimating the prevalence of exposures. There were hardly any data or accurate documentation available on prevalence, and most of them had to be assessed based on the experience and knowledge of national experts. The prevalence estimates are also highly sensitive to the minimum criteria of exposure (definition of being exposed). The fourth problem was the organic solvents. The aggregated solvent groups of FINJEM could not be assessed as to exposure similarity between countries because the aggregate exposure estimates were generated in a complex way summing over several individual solvents. They were therefore left unchecked, and new estimates were generated to selected individual solvents. This also turned out to be time-consuming and difficult because the historical use patterns of individual solvents in different countries were poorly available from the sources known to the team. The fifth challenge was the rater-dependence of estimates. Although the exposure definitions and the base for the estimates were uniform, and we discussed controversial issues in meetings, the final estimates are likely to be partially dependent on the views of the national expert. Finally, the different occupational classifications required conversions, both when national measurement data needed to be compared with FINJEM estimates, and when the modified final estimates needed to be applied to the epidemiological cohort data which were classified according to national nomenclature of Census classification.
Priority setting and adoption of general principles in the beginning of the work guided the modification process and probably saved plenty of time. The workload taken by this kind of process depends largely on the level of ambition. Our ambition level was relatively high because NOCCA is a unique study in regard to its huge size and quality of variables derived from various registers. Therefore we spent rather much time in collecting new exposure data, and we also generated estimates for some new agents (e.g., individual solvents). The total time taken to modify the FINJEM-estimates of NOCCA-agents (N = 28, see ) to estimates relevant for all five Nordic countries was about 30 person-months (on average 6 months/country, range <2–12 months). Without the collection of additional industrial hygiene data, the time to modify FINJEM for another country was 4 months on average.
In we have compared three basic alternatives of the JEM approach: direct use of an existing JEM, modification of an existing JEM, and construction of a new JEM. Out of these alternatives, a totally new JEM tailored for the occupational classification of the epidemiological study is often the most valid alternative, but it is also by far the most time-consuming and requires the most skill in exposure assessment. For example, the construction of the basic FINJEM required 2–3 person-years of work, and about 20 occupational hygienists or other exposure experts were involved in the assessment. The direct use of an existing JEM is the least laborious and least skill-requiring alternative. It may be a valid procedure, particularly if the JEM used is of good quality, and if exposure to agents of interest does not differ essentially between the country under study and the JEM-country. The direct application of JEM may take only a few weeks of working time. The validity of the results is the major concern of this procedure. If the foreign JEM classifies unexposed occupations as exposed, the true risks may be masked. The relative easiness of the procedure may also encourage the study of the whole range of agents available from the JEM, and the probability of false positive findings increases.
Table IV. Working time taken by different tasks when the job-exposure matrix (JEM) approach is used in census-based cohort studies.
The JEM modification procedure adopted in the NOCCA project falls between the direct use and the construction of a new JEM, both with regard to the validity and effort taken. We learned that a brief review of JEM by one or several exposure experts may increase the validity (and further credibility of the results based on the JEM) significantly if it is focused on exposures and occupations which drive the results of the epidemiological study (i.e. large occupations with substantial exposure). Also adding new exposures to NOCCA-JEMs will not be laborious provided that suitable base estimates from FINJEM or other sources are available. On the other hand, the modification effort may also be excessive. The collection, analysis and interpretation of additional exposure data of rare occupations or occupations experiencing only low exposure may take ample time but increase validity only marginally.
We conclude that the modification of an existing JEM for use in census-based studies in other countries is a feasible procedure. It may increase the validity and credibility of epidemiological results and may require only limited effort of exposure experts. From the efficacy point of view, it is crucial that the agent-occupation combinations most relevant for the epidemiological study are identified, their exposure estimates are checked and, if necessary, corrected to be accurate for the country where JEM is being applied.
The authors of this article may be contacted on issues concerning the availability of NOCCA-JEMs for research and other purposes. The availability outside the NOCCA project will be decided in the team, and it generally requires the participation of one or more team members as collaborators.
Acknowledgements
The authors gratefully acknowledge Gun Nise and Gunilla Klingspetz for data collection and exposure assessment work, and Maila Hietanen for estimating UV radiation exposures. This work was financially supported by the Nordic Cancer Union.
Declaration of interest: The authors report no conflicts of interest. The authors alone are responsible for the content and writing of the paper.
References
- Andersen A, Barlow L, Engeland A, Kjaerheim K, Lynge E, Pukkala E. Work-related cancer in the Nordic countries. Scand J Work Environ Health 1999; 25(Suppl 2)1–116
- Pukkala E, Martinsen J, Lynge E, Gunnarsdottir H, Sparén P, Tryggvadottir L, et al. Occupation and cancer. Follow-up of 15 million people in five Nordic Countries. 2009; 48: 646–790
- Bouchardy C, Schüler G, Minder C, Hotz P, Bousquet A, Levi F, et al. Cancer risk by occupation and socioeconomic group among men – a study by The Association of Swiss Cancer Registries. Scand J Work Environ Health 2002; 28(Suppl 1)1–88
- Hoar SK, Morrison AS, Cole P, Silverman DT. An occupation and exposure linkage system for the study of occupational carcinogenesis. J Occup Med 1980; 22: 722–6
- Gomez M, Cocco P, Dosemeci M, Stewart P. Occupational exposure to chlorinated aliphatic hydrocarbons: Job exposure matrix. Am J Indust Med 1994; 26: 171–83
- Sieber WK, Sundin DS, Frazier TM, Robinson CF. Development, use, and availability of a job exposure matrix based on national occupational hazard survey data. Am J Indust Med 1991; 20: 163–74
- Pannett B, Coggon D, Acheson ED. A job-exposure matrix for use in population based studies in England and Wales. Br J Ind Med 1985; 42: 777–83
- Févotte J, Luce D, Arslan M, Dananché B, Delabre L, Ducamp S, et al. Surveillance des expositions d‘origine professionelle en population générale: Le programme Matgéné Bull Epidemiol Hebd 2006; 46–47: 362–5
- Guéguen A, Goldberg M, Bonenfant S, Martin J. Using a representative sample of workers for constructing the SUMEX French general population based job-exposure matrix. Occup Environ Med 2004; 61: 586–93
- Plato N, Steineck G. Methodology and utility of a job-exposure matrix. Am J Ind Med 1993; 23: 491–502
- Kauppinen T, Toikkanen J, Pukkala E. From cross-tabulations to multipurpose exposure information system: A new job-exposure matrix. Am J Ind Med 1998; 33: 409–17
- Kauppinen T, Mutanen P, Seitsamo J. Magnitude of misclassification bias when using a job-exposure matrix. Scand J Work Environ Health 1992; 18: 105–12
- Benke G, Sim M, Fritschi L, Aldred G, Forbes A, Kauppinen T. Comparison of occupational exposure using three different methods: Hygiene panel, job exposure matrix (JEM) and self reports. Appl Occup Environ Hyg 2001; 16: 84–91
- Karipidis K, Benke G, Sim M, Kauppinen T, Kricker A, Hughes A, et al. Occupational exposure to ionizing and non-ionizing radiation and risk of non-Hodgkin lymphoma. Int Arch Occup Environ Health 2007; 60: 663–70
- Karipidis K, Benke G, Sim M, Kauppinen T, Giles G. Occupational exposure to ionizing and non-ionizing radiation and risk of glioma. Occup Med 2007; 57: 518–24
- Heiskel H, Gunzenhäuser D, Seidler A, Volk S, Pflug B, Kauppinen T, et al. Sleep apnea and occupational exposure to solvents. Scand J Work Environ Health 2002; 28: 249–55
- Seidler A, Nienhaus A, Bernhardt T, Kauppinen T, Elo A, Frölich L. Psychosocial work factors and dementia. Occup Environ Med 2004; 61: 962–71
- Seidler A, Geller P, Nienhaus A, Bernhardt T, Ruppe I, Eggert S, et al. Occupational exposure to low frequency magnetic fields and dementia: A case-control study. Occup Environ Med 2007; 64: 108–14
- Alguacil J, Kauppinen T, Porta M, Partanen T, Malats N, Kogevinas M, et al. Risk of pancreatic cancer and occupational exposures. Ann Occup Hyg 2000; 44: 391–403
- Alguacil J, Porta M, Malats N, Kauppinen T, Kogevinas M, Benavides F, et al. A for the PANCRAS II Study Group. Occupational exposure to organic solvents and K-ras mutations in exocrine pancreatic cancer. Carcinogenesis 2002; 23: 101–6
- Alguacil J, Porta M, Kauppinen T, Malats N, Kogevinas M, Carrato A, et al. Occupational exposures to dyes, metals, polycyclic aromatic hydrocarbons and other agents and K-ras activation in human exocrine pancreatic cancer. Int J Cancer 2003; 107: 635–41
- Dryver E, Brandt L, Kauppinen T, Olsson H. Occupational exposures and non-Hodgkin's lymphoma in Southern Sweden. Int J Occup Environ Health 2004; 10: 13–21
- Läärä E. Acta Oncol 2009 (in this issue).
- Lewne M, Plato N, Gustavsson P. Exposure to particles, elemental carbon and nitrogen dioxide in workers exposed to motor exhaust. Ann Occup Hyg 2007; 51: 693–702
- Rajan B, Alesbury R, Carton B, Gerin M, Litske H, Marquart H, et al. European proposal for core information for the storage and exchange of workplace exposure measurements on chemical agents. Appl Occup Environ Hyg 1997; 12: 31–9
- Heikkilä P, Saalo A. Measurements of air contaminants in workplaces in 1994–2003 (In Finnish) Työympäristötutkimuksen raporttisarja 12. Finnish Institute of Occupational Health, Helsinki; 2005.
- Godar D. UV doses worldwide. Photochem Photobiol 2005; 81: 736–49
- Pukkala E, Guo J, Kyyrönen P, Lindbohm M-L, Sallmén M, Kauppinen T. National job-exposure matrix in analyses of census-based estimates of occupational cancer risk. Scand J Work Environ Health 2005; 31: 97–107
- Guo J, Kauppinen T, Kyyrönen P, Heikkilä P, Lindbohm M, Pukkala E. Risk of esophageal, ovarian, testicular, kidney and bladder cancers and leukemia among Finnish workers exposed to diesel or gasoline engine exhaust. Int J Cancer 2004; 111: 286–92
- Guo J, Kauppinen T, Kyyrönen P, Lindbohm M, Heikkilä P, Pukkala E. Occupational exposure to diesel and gasoline engine exhausts and risk of lung cancer among Finnish workers. Am J Ind Med 2004; 45: 483–90
- Guo J, Pukkala E, Kyyrönen P, Lindbohm M-L, Heikkilä P, Kauppinen T. Testicular cancer, occupation and exposure to chemical agents among Finnish men in 1971-95. Cancer Causes Control 2005; 16: 97–103
- Laakkonen A, Kyyrönen P, Kauppinen T, Pukkala E. Occupational exposure to eight organic dusts and respiratory cancer among Finns. Occup Environ Med 2006; 63: 726–33
- Teschke K, Olshan A, Daniels J, et al. Occupational exposure assessment in case-control studies: Opportunities for improvement. Occup Environ Med 2002; 59: 575–94
- Siemiatycki J. Exposure assessment in community-based studies of occupational cancer. Occup Hyg 1996; 3: 41–58