
Abstract
Background: To investigate descriptive characteristics and dose metric (DM) parameters associated with development of pleural effusions (PlEf) in non-small cell lung cancer (NSCLC) treated with definitive chemoradiation therapy (CRT).
Materials and methods: We retrospectively assessed treatment records and follow-up imaging of 66 NSCLC patients to identify PlEf formation after CRT. PlEf association between mean heart dose (MHD), mean lung dose (MLD), heart V5–V60 (HV), and lung V5–V60 (LV) were evaluated using Cox Proportional Hazard Models.
Results: A total of 52% (34 of 66 patients) of our population developed PlEf and the actuarial rates at 6 months, 12 months, and 18 months were 7%, 30%, and 42%, respectively. Median time to diagnosis was five months (range 0.06–27 months). The majority of PlEfs were grade one (67%) and developed at a median of four (0.06–13) months, followed by grade two (15%) at a median 11 (5–12) months, and grade three (18%) at a median of 11 (3–27) months. On multivariate analysis, increasing HV5–HV50, LV5–LV50, MHD, and MLD were associated with greater risk of PlEf. Higher grade PlEf was also associated with higher doses of radiation to the heart, while lung DM parameters were not significantly associated with higher PlEf grades. At five-months post-CRT, MHD of 25 Gy was associated with a 100% chance of grade one PlEf, an 82% risk of grade two PlEf, and a 19% risk of grade three PlEf.
Conclusions: Post-CRT PlEf is common in NSCLC with the majority being grade one. Increasing heart and lung irradiation was associated with increased risk of PlEf. Increasing heart irradiation also correlated with development of increasing grades of PlEf. The impact of potential cardiopulmonary toxicity and resultant PlEfs after CRT requires additional study.
Introduction
Although combined chemoradiation therapy (CRT) affords a chance of cure for stage III non-small cell lung cancer (NSCLC), toxicities of this treatment can be significant [Citation1]. Pleural effusion (PlEf) is a frequent, though poorly studied toxicity that may occur after CRT for NSCLC. Despite the observation that post-CRT PlEf commonly occurs, little has been published about this toxicity. To date, the exact mechanism of post-CRT PlEf remains unknown. Animal models and observational studies of Hodgkin’s disease treated with RT suggest that the acute occurrence of PlEf is associated with pneumonitis, whereas the chronic occurrence is related to thoracic lymphatic fibrosis [Citation2]. Currently, post-CRT PlEf has been best studied in esophageal cancer, where it is also a common toxicity of treatment and may be related to cardiac dysfunction from increasing radiation doses administered to cardiac tissues [Citation3,Citation4].
While there is a growing body of evidence to support cardiac toxicity as the etiology of PlEf, this may not explain all observed PlEfs. For example, malignant PlEf may be caused by direct pleural injury resulting in increased vascular permeability and lymphatic obstruction by the tumor [Citation5]. Additionally, post-RT PlEf in breast cancer occurs simultaneously with radiation-induced parenchymal infiltrates of the lung [Citation6]. Therefore, it is possible that pulmonary factors may also play a role in PlEf formation after CRT. Given that the majority of the clinical literature has previously focused on PlEfs occurring after RT for Hodgkin’s disease and esophageal cancer [Citation3,Citation7], the lack of knowledge about PlEf following CRT in NSCLC remains a limitation in the attempt to avoid this possible toxicity [Citation8]. Therefore, we sought to elucidate characteristics and dose metric (DM) criteria of post-CRT PlEf in NSCLC.
Material and methods
Patient population
We identified a cohort of 174 patients with histologically confirmed NSCLC who received definitive CRT between January 2003 and September 2012, and reviewed their records under an Institutional Review Board (IRB)-approved protocol. In total, 108 patients were excluded due to baseline PlEf before CRT (n = 40), RT alone (n = 12), or palliative RT (n = 7). Also, patients with intrathoracic recurrence (n = 30), radiation pneumonitis (n = 8) or pneumonia (n = 1) within a 90-day window before or after PlEf were excluded. Finally, patients with malignant PlEf (n = 2) or who developed PlEf before CRT completion (n = 8) were removed. Patients with inoperable (due to medical comorbidities) stage I (n = 5) and II (n = 4) NSCLC who were treated with definitive CRT were included. Patients with stage IV oligometastatic NSCLC (n = 10), defined as a solitary extrathoracic metastasis, were included as these patients may achieve long-term survival rates comparable to stage III NSCLC [Citation9]. Clinical staging was defined using the American Joint Committee on Cancer 6th edition criteria [Citation10].
Treatment planning
RT was delivered through anteroposterior fields first to 40 Gy in 1.8 or 2 Gy per fraction per day followed by oblique fields to avoid the spinal cord for an additional 20–26 Gy for a typical total RT dose of 60–66 Gy. Varian Eclipse (Palo Alto, CA, USA) treatment planning version 11.4 of the analytic anisotropic algorithm was employed with tissue inhomogeneity corrections, with six- or 15-MV photons used to deliver the RT. A mixture of both three-dimensional conformal and intensity modulated radiation therapy was used. Radiation doses were prescribed to the planning target volume (PTV). The gross tumor volume (GTV) was defined as the primary tumor and any regionally involved nodes on computed tomography (CT) or pre-treatment positron emission tomography (PET) scan. PTVs were 0.5 cm beyond the clinical target volume (CTV) for patients treated with four-dimensional computed tomography (4DCT) and image guidance radiation therapy. For patients not treated with 4DCT or image guidance radiation therapy, PTV was one cm beyond the CTV. The radiation dose for the spinal cord was <50 Gy. The mean lung dose (MLD) was <20 Gy, Lung V5 <60–70% and Lung V20 <37%.
The typical chemotherapy regimen consisted of intravenous infusional drug delivery consisting of weekly paclitaxel (45 mg/m2) plus carboplatin (AUC = 2) or etoposide Day 1–5 and 29–33 (50 mg/m2) plus cisplatin Day 1, 8, 29, and 36 (50 mg/m2). RT was delivered after the administration of chemotherapy on days when both therapies were given.
Evaluation
After completion of CRT, patients were assessed at follow-up with chest CT scans, which were used to evaluate their tumor response, and for this study, to assess for the development of PlEfs. Chest CT scans were performed every three months for the first year, then every four months during years 2–3, and then every six months from years 3–5. PlEfs were retrospectively scored using the Common Terminology Criteria for Adverse Events version 4.0 (CTCAEv4.0). Grade one PlEf was defined as asymptomatic, identified by clinical or diagnostic observations only, and did not require intervention. Grade two PlEf was defined as symptomatic and required intervention (e.g. diuretics or limited therapeutic thoracentesis). Grade three PlEf was defined as symptomatic with respiratory distress and hypoxia and required surgical intervention including chest tube or pleurodesis. Patients with grade two and three PlEf who underwent diagnostic thoracentesis and cytology samples were examined for malignancy. Patients who received the same intervention multiple times (i.e. thoracentesis) were only counted once for the purposes of our analysis. However, patients who underwent multiple different interventions (i.e. thoracentesis and chest tube) were each counted individually. PlEf was classified based on the patient’s highest CTCAE score. The heart and lungs were contoured and delineated based on the RTOG guidelines put together by Kong et al. [Citation11]. The heart was contoured to include the pericardium and the superior aspect was initiated at the bifurcation of the pulmonary trunk into the pulmonary arteries. Lungs were contoured to include all lung tissue minus the GTV. Most of the older (before 2006) plans had to be recalculated using fixed monitor units so that the dose-volume histograms could be viewed. Fraction sizes for the two phases were corrected separately using the biologically equivalent dose formula with an α/β ratio of three and subsequently summed prior to calculation of organ at risk DM parameters [Citation12].
A DM parameter of Vx was the percentage of the total organ volume exceeding × radiation dose. DM parameters were collected in increasing increments of 10 for heart V10–V60 (HV), and lung V10–V60 (LV), in addition to HV5, LV5, mean heart dose (MHD), and MLD. Baseline CT scans were retrospectively reviewed to identify tumors involving the pleura or chest wall [Citation13].
Statistical analysis
Population and PlEf characteristics of patients were summarized using frequencies and proportions. The primary end point was time to development of PlEf. Time was measured from the end of CRT to development of PlEf or last known follow-up. Patients lost to follow-up or who did not develop PlEf were censored. Univariate analyses to identify predictors associated with PlEf were conducted using Cox Proportional Hazard Models. Multivariate models were then built based on one DM variable, and the most significant clinical variables on univariate analysis [tumor volume (TVol) and pleural involvement of the tumor (PI)]. Estimation of hazard ratio (HR) was reported along with 95% confidence intervals. Proportional hazard assumptions were checked by plotting Schoenfeld residuals. The secondary end point was time to development of different grades of PlEf. For that, we used a marginal approach proposed by Wei, Lin and Weissfeld (WLW) [Citation14] to fit models to study an association of PlEf grade with each of the DM parameters to handle recurrent events in patients. To address correlations in times among different grades of PlEf, inferences were based on the robust sandwich variance estimate. The dose-response functions were drawn based on the fitted models using the WLW approach. We calculated the probability of developing different grade of PlEfs for varying values of DM at 5 and 10 months after CRT (these were median times to development of grade one, two and three PlEf). All analyses were conducted using SAS v9.4 (SAS Institute, Cary, NC) and p < 0.05 was considered statistically significant.
Results
Baseline characteristics of all 66 patients are shown in . Median follow-up time was 13 months (range 0.2–73). Median age at diagnosis was 67 years. The majority of patients were male (56%), caucasian (80%), and had stage III disease (70%). Median TVol was 95 cm3. Median RT dose was 63 Gy and, when corrected for fraction size, 74 Gy.
Table 1. Baseline characteristics of patients.
In this population, 52% (34 of 66) of patients developed PlEf. The actuarial rates of PlEf at 6, 12 and 18 months were 7%, 30%, and 42%, respectively. Median time to diagnosis of PlEf was five months (range 0.06–27 months). Grade one, two, and three PlEf occurred after CRT at a median of four months (0.06–13 months), 11 months (5–12 months), and 11 months (3–27 months), respectively. Descriptive characteristics of PlEfs are seen in . Most PlEfs were CTCAE grade one (67%, n = 23), ipsilateral to the primary tumor volume (79%, n = 27), and not loculated (88%, n = 30). Median TVol did not differ between grade one (138.6 cm3), grade two (91.3 cm3) and grade three (91.5 cm3) PlEf (p = 0.86). Only six patients who developed PlEf experienced new symptoms before diagnosis. Five patients experienced shortness of breath and one had cough. Symptoms were more common with larger PlEf. For example, three of the five patients who complained of shortness of breath had grade three PlEf while one had grade two PlEf. The patient with cough also had grade three PlEf.
Table 2. Descriptive characteristics of 36 patients who developed pleural effusion.
Thoracentesis was performed in 26% (n = 9) of patients. Of those with available cytology, three PlEfs were exudative and two were transudative. For grade ≥ two PlEfs, interventions included PleurX catheter placement (6%, n = 2) at a median time of 16 months (14–18 months), chest tube placement (14%, n = 5) at a median time of 11 months (3–27 months), and chest tube pleurodesis (1.5%, n = 1) or VATS pleurodesis (1.5%, n = 1) at seven and three months, respectively. Four of the nine patients who underwent a thoracentesis did not have any further intervention. Two patients who underwent chest tube placement did not initially have a thoracentesis, and one patient who received a PleurX catheter did not initially have a thoracentesis.
On univariate analysis, factors significantly associated with increased risk of PlEf were HV5,–HV60, LV5–LV50, MHD, and MLD (Supplemental Table, available online at http://www.informahealthcare.com). PI [HR 1.82; 95% CI (0.88–3.74); p = 0.10] trended towards significance.
On multivariate analysis (), HV5 –HV50, LV5–LV50, MHD and MLD were all associated with increased risk of PlEf when adjusted for PI and TVol. For most models including a lung DM parameter, PI was also associated with increased risk of PlEf. For example, in the model containing LV20, PI had a HR of 4.37 (95% CI 1.68–11.35; p = 0.002).
Table 3. Multivariate analysis of adjusted risk for PlEf development by dose metric parameter.
To identify DM parameters associated with different grades of PlEf, we used a marginal model to treat development of different grades of PlEf as different events. On univariate analysis, LV5–LV30 was associated with grade one PlEf, but not grade two or three PlEf. DM parameters greater than LV30 did not correlate with any grade PlEf. However, HV5–HV60 and well as MHD were associated with development of grade one, two and three PlEf (). We also calculated the risk of developing PlEf at a certain fixed time point. At 5-months post-CRT (median time to development of PlEf), MHD of 25 Gy was associated with a 100% chance of grade one PlEf, an 82% risk of grade two PlEf, and a 19% risk of grade three PlEf. At 10-months post-CRT (median time to development of grade two and three PlEf), MHD of 25 Gy was associated with 100% chance of grade one or two PlEf and an 18% chance of grade three PlEf. Risk of developing PlEf at other DM values can be seen in .
Figure 1. Risk of PlEf by grade based on Mean Heart Dose. (A) 5-months post-chemoradiation. (B) 10-months post-chemoradiation. Median mean heart dose: 16 Gy; Minimum mean heart dose: 0 Gy; Maximum mean heart dose: 48.7 Gy. CRT: chemoradiation therapy; Gr: grade; Gy: gray.
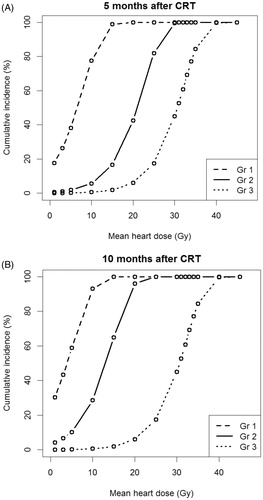
Figure 2. Risk of PlEf by grade based on Heart V5. (A) 5-months post-chemoradiation. (B) 10-months post-chemoradiation. Median heart V5: 44.5%; minimum heart V5: 0%; maximum heart V5: 100%. CRT: chemoradiation therapy; Gr: grade; Gy: gray.
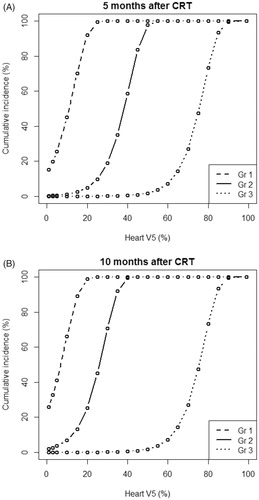
Figure 3. Risk of PlEf by grade based on Heart V30. (A) 5-months post-chemoradiation. (B) 10-months post-chemoradiation. Median heart V30: 20.6%; minimum heart V30: 0%; maximum heart V30: 92.6%. CRT: chemoradiation therapy; Gr: grade; Gy: gray.
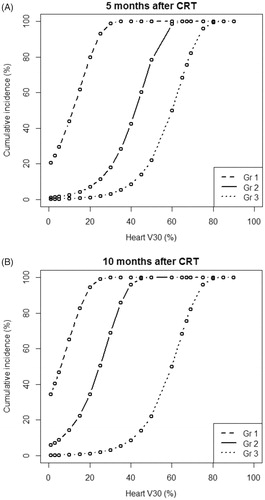
Table 4. Risk of developing PlEf at 5- and 10-months post-CRT.
Discussion
Here we demonstrate that 52% of our patient population treated with CRT for NSCLC experienced PlEf at a median of 5 months after CRT. We also demonstrate that increasing doses of radiation to the heart and lungs during CRT were associated with development of PlEf after therapy. Higher grade PlEf was also associated with higher doses of radiation to the heart, unlike lung DM parameters. In total 67% of PlEfs were CTCAE grade one and 79% developed ipsilateral to the primary tumor volume. We were also able to calculate the probability of developing different grade PlEf based on radiation dose to the heart.
The etiology of PlEf is likely related to cardiopulmonary toxicity as demonstrated by the relationships between dose to the heart and lungs and the risk of PlEf. Given that cardiac dysfunction tends to cause transudative PlEfs and pulmonary injury tends to cause exudative PlEfs [Citation15], the observation that our population experienced a mix of exudative and transudative PlEfs suggests that both pulmonary and cardiac factors could have played a role in PlEf development. From a pathological standpoint, irradiation of cardiac tissue can result in long-term injury including accelerated atherosclerosis, pericardial and myocardial fibrosis, conduction abnormalities, injury to cardiac valves, and possibly radiation pneumonitis [Citation16–18]. Also, lung irradiation can cause pneumonitis, fibrosis, and vascular remodeling leading to pulmonary hypertension and cardiopulmonary dysfunction [Citation19].
Hatakenaka et al. [Citation20] demonstrated that CRT in esophageal cancer is associated with acute cardiac toxicity before treatment completion. Distal esophageal cancers demonstrated the greatest cardiac dysfunction through 40 Gy of treatment, possibly due to higher radiation dose to the left ventricle. Even though proximal tumors received lower doses of radiation to the left ventricle, they also demonstrated cardiac dysfunction before CRT completion. Furthermore, Gomez et al. studied esophageal cancer patients and found that brain natriuretic peptide, which is released in response to excessive stretching of heart muscle cells, increased from pre-treatment values at the end of CRT and first follow-up period [Citation21]. Shirai et al. reported 35% of esophageal cancer patients who were treated with RT developed PlEf and correlated the occurrence of PlEf to HV5–HV60, LV50, LV60, and MHD. They also found that while only one third of patients had distal esophageal cancers, two thirds of PlEfs occurred in distal tumors, suggesting that cardiac rather than pulmonary parenchyma irradiation is the source of PlEf. Additionally, preexisting cardiac disease and co-irradiation of the heart may increase the risk of radiation-induced lung toxicity and PlEf formation [Citation22]. Taken together, these findings provide support for a likely cardiopulmonary etiology of radiation-induced PlEf formation.
In our patient population, the proportion of patients with NSCLC receiving CRT who developed PlEf was 52%, most of which were grade one (67%). Our proportion appears elevated compared to other reports; however, all patients with malignant or infectious etiology of their PlEf were excluded, as were those who developed PlEf during CRT. Kwint et al. [Citation23] reported PlEf to occur in 14% of lung cancer patients receiving RT. However, inclusion criteria for this study were total tumor dose ≥44 Gy. Their study also contained a mixture of CRT and RT alone compared to our study, which included only CRT. Additionally, patient follow-up time was only six weeks after RT. However, our study demonstrated PlEf formation up to 27 months after CRT, indicating the need for longer-term follow-up to determine the true incidence of PlEf.
In our study 21%, 41%, 14%, and 18% of patients had diabetes, hypertension, coronary artery disease, and hypercholesterolemia, respectively. In this population of NSCLC, 87% of patients were smokers, which could contribute to an underestimation of underlying cardiac disease. Such unidentified underlying cardiac disease could predispose patients to added cardiac toxicity with even lower doses of radiation. Finally, PI of the tumor was a borderline risk factor for PlEf development in our study and may support the previously proposed notion that pleural injury can be caused by increased vascular permeability and lymphatic blockage by tumor [Citation5]. Along with underlying cardiac morbidities in our patients, these factors may help to explain the higher proportion of PlEf we observed in this study.
One weakness of this study is that the majority of patients did not undergo thoracentesis because most PlEfs were grade one. Therefore, the exact cytological composition of most of our patients’ PlEfs is unknown. Additionally, the sensitivity of diagnosing malignant PlEf through a single thoracentesis ranges from 40% to 87% [Citation24,Citation25], so cytological evaluation of PlEf carries a risk for false negativity. Therefore, it is possible some malignant PlEf were included in our analysis.
Our results show that increasing radiation doses to the cardiac tissue and lung parenchyma are associated with higher risk of developing PlEf in NSCLC patients after definitive CRT. Based on our findings, continued efforts to reduce RT doses to the cardiac and pulmonary tissue are warranted in an attempt to reduce the incidence of PlEf. Additional studies evaluating functional outcomes of the heart and lungs after CRT in relation to their radiation doses are necessary.
model_for_appendix.docx
Download MS Word (12.6 KB)supplemental_table.docx
Download MS Word (13.9 KB)Figure_3_3.21.16.pdf
Download PDF (83.4 KB)Figure_2_3.21.16.pdf
Download PDF (82.8 KB)Disclosure statement
The authors report no conflicts of interest. The authors alone are responsible for the content and writing of the paper.
Related Research Data
References
- Curran WJ Jr., Choy H. Optimizing chemoradiation in locally advanced non-small-cell lung cancer. Oncology (Williston Park, N.Y.) 2001;15:43–5.
- Down JD, Easton DF, Steel GG. Repair in the mouse lung during low dose-rate irradiation. Radiother Oncol 1986;6:29–42.
- Shirai K, Tamaki Y, Kitamoto Y, Murata K, Satoh Y, Higuchi K, et al. Dose-volume histogram parameters and clinical factors associated with pleural effusion after chemoradiotherapy in esophageal cancer patients. Int J Radiat Oncol Biol Phys 2011;80:1002–7.
- Morota M, Gomi K, Kozuka T, Chin K, Matsuura M, Oguchi M, et al. Late toxicity after definitive concurrent chemoradiotherapy for thoracic esophageal carcinoma. Int J Radiat Oncol Biol Phys 2009;75:122–8.
- Jiang WG. In-vitro models of cancer invasion and metastasis: recent developments. Eur J Surg Oncol 1994;20:493–9.
- Hietala SO, Hahn P. Pulmonary radiation reaction in the treatment of carcinoma of the breast. Radiography 1976;42:225–30.
- Whitcomb ME, Schwarz MI. Pleural effusion complicating intensive mediastinal radiation therapy. Am Rev Respir Dis 1971;103:100–7.
- Kumar R, Patel G, Kichenadasse G, Sukumaran S, Roy A, Koczwara B, et al. Delayed onset of benign pleural effusion following concurrent chemoradiotherapy for inoperable non-small-cell lung cancer. Intern Med J 2015;45:218–21.
- Jabbour SK, Daroui P, Moore D, Licitra E, Gabel M, Aisner J. A novel paradigm in the treatment of oligometastatic non-small cell lung cancer. J Thorac Dis 2011;3:4–9.
- Lababede O, Meziane MA, Rice TW. TNM staging of lung cancer: a quick reference chart. Chest 1999;115:233–5.
- Kong FM, Ritter T, Quint DJ, Senan S, Gaspar LE, Komaki RU, et al. Consideration of dose limits for organs at risk of thoracic radiotherapy: atlas for lung, proximal bronchial tree, esophagus, spinal cord, ribs, and brachial plexus. Int J Radiat Oncol Biol Phys 2011;81:1442–57.
- Park S, Urm S, Cho H. Analysis of biologically equivalent dose of stereotactic body radiotherapy for primary and metastatic lung tumors. Cancer Res Treat 2014;46:403–10.
- Glazer HS, Duncan-Meyer J, Aronberg DJ, Moran JF, Levitt RG, Sagel SS. Pleural and chest wall invasion in bronchogenic carcinoma: CT evaluation. Radiology 1985;157:191–4.
- Wei L, Lin D,LW. Regression Analysis of Multivariate Incomplete Failure Time Data by Modeling Marginal Distributions. J Am Stat Assoc 1989;84:1065–73.
- McGrath EE, Anderson PB. Diagnosis of pleural effusion: a systematic approach. Am J Crit Care 2011;20:119–27; quiz 28.
- Huang EX, Hope AJ, Lindsay PE, Trovo M, El Naqa I, Deasy JO, et al. Heart irradiation as a risk factor for radiation pneumonitis. Acta Oncol 2011;50:51–60.
- Deasy JO, Muren LP. Advancing our quantitative understanding of radiotherapy normal tissue morbidity. Acta Oncol 2014;53:577–9.
- Tucker SL, Liao Z, Dinh J, Bian SX, Mohan R, Martel MK, et al. Is there an impact of heart exposure on the incidence of radiation pneumonitis? Analysis of data from a large clinical cohort. Acta Oncol 2014;53:590–6.
- Heidenreich PA, Kapoor JR. Radiation induced heart disease: systemic disorders in heart disease. Heart 2009;95:252–8.
- Hatakenaka M, Yonezawa M, Nonoshita T, Nakamura K, Yabuuchi H, Shioyama Y, et al. Acute cardiac impairment associated with concurrent chemoradiotherapy for esophageal cancer: magnetic resonance evaluation. Int J Radiat Oncol Biol Phys 2012;83:e67–73.
- Gomez DR, Yusuf SW, Munsell MF, Welsh JW, Liao Z, Lin SH, et al. Prospective exploratory analysis of cardiac biomarkers and electrocardiogram abnormalities in patients receiving thoracic radiation therapy with high-dose heart exposure. J Thorac Oncol 2014;9:1554–60.
- Nalbantov G, Kietselaer B, Vandecasteele K, Oberije C, Berbee M, Troost E, et al. Cardiac comorbidity is an independent risk factor for radiation-induced lung toxicity in lung cancer patients. Radiother Oncol 2013;109:100–6.
- Kwint M, Conijn S, Schaake E, Knegjens J, Rossi M, Remeijer P, et al. Intra thoracic anatomical changes in lung cancer patients during the course of radiotherapy. Radiother Oncol 2014;113:392–7.
- Lim MH, Garrettc J, Mowlem L, Yap E. Diagnosing malignant pleural effusions: how do we compare? N Z Med J 2013;126:42–8.
- Ong KC, Indumathi V, Poh WT, Ong YY. The diagnostic yield of pleural fluid cytology in malignant pleural effusions. Singapore Med J 2000;41:19–23.