
Introduction
Small treatment fields are increasingly used with modern radiotherapy (RT) techniques, such as in stereotactic radiotherapy (SRT) [Citation1]. The use of small fields enables more precise treatment, but with the cost of increased uncertainty in dosimetry because the reference conditions based on conventional Codes of Practice cannot be fully established [Citation2]. Monte Carlo (MC) calculation methods provide an efficient way to investigate dosimetry in RT under non-reference conditions and they are considered to be the most accurate methods [Citation3,Citation4].
In this study, dose calculations performed with two user codes of the EGSnrc software package were compared: DOSRZnrc and egs_chamber [Citation5]. With the DOSRZnrc, the dose is scored in a cylindrical geometry, while the more recent egs_chamber provides a versatile geometry library. To our knowledge, these two user codes have not been compared earlier. In many studies [Citation6–8], MC codes have been compared, but not user codes of the same package. Moreover, the studies, which have used both DOSRZnrc and egs_chamber codes [Citation9–11] in dose calculations have not compared the results in the same geometries. Similar results for both codes would encourage the use of the egs_chamber over the traditional DOSRZnrc considering the versatility of simulation geometries with the egs_chamber. Accuracy of the MC volume calculations, percentage depth dose (PDD) curves and profile calculations was verified through comparison with measurements performed with a micro-ionization chamber.
Material and methods
Calculations were performed with the EGSnrc code package (National Research Council Canada) version 2016, which is a software toolkit for modeling the transport of electrons and photons through matter [Citation5]. The dose calculations were compared between two EGSnrc-based user codes, which both use the same radiation transport physics in dose calculation, but differ in calculation geometry definitions: the DOSRZnrc is a Fortran-based code, which simulates the track of particles in a cylindrical geometry, while the more recent C++-based egs_chamber uses versatile geometries. This geometry library consists of elementary geometries, e.g. planes and cylinders, which can be used to build up more complex composite geometries [Citation12].
A photon beam with nominal energy of 6 MV from a Varian Clinac iX linear accelerator (Varian Medical Systems Inc., Palo Alto, CA) was modeled with the BEAMnrc code [Citation13–17]. The phase space (phsp) files were generated for beams collimated with Novalis conical collimators (CC) (Brainlab AG, Munich, Germany) of 4, 7.5, 20 and 40 mm in diameter (CC4, CC7.5, CC20 and CC40) at source-to-surface distances (SSDs) of 80 and 90 cm (SSD80 and SSD90). The phsp files were used as particle sources for calculations in a large water phantom with a radius of 30 cm and a height of 40 cm. Since the calculation geometries were chosen to be realizable with both user codes, all the geometries were chosen to be cylindrical.
The first example applications comprehended dose calculations in single volumes. Calculations were performed with CC4, CC7.5, CC20 and CC40 in three different geometries: a thin water cylinder, an air cylinder, and an ionization chamber (IC). The single volume calculations were performed at depths of 10 and 20 cm, i.e., at SSD90 and SSD80, respectively. The second example applications included PDD curve and profile calculations, which were performed at SSD90 with CC20 and CC7.5. Profiles were compared through global difference (at high dose and out-of-field regions), distance-to-agreement (DTA) (at high dose gradient region) and gamma comparison with the acceptance criteria of 1%/1 mm for all data [Citation18]. The PDD curves were evaluated with global difference at depths larger than the depth of dose maximum (dmax) and with DTA at depths lower than dmax, as well as with gamma values with the acceptance criteria of 1%/1 mm for all data. The detailed calculation geometries are described in Supplementary material.
The PDD and profile measurements were performed in water using 6 MV photon beam from Varian Clinac iX at SSD90 only for the CC20. This was chosen to avoid large uncertainties related to measurements with smaller fields. An IBA CC01 IC (IBA Dosimetry GmbH, Schwarzenbruck, Germany), which is a detector commonly chosen for small-field dosimetry, was used. The detector was placed perpendicular to the beam axis. A PTW Semiflex chamber Type 31010 IC (PTW-Freiburg GmbH, Freiburg, Germany) was used as a reference detector. The results of the calculations and measurements were compared through global difference, DTA, and gamma values.
Results
In single volume calculations, the maximum difference of 0.24% was found in a thin water cylinder with CC4, while the mean difference in all geometries was 0.05%. Overall, the largest and mean statistical uncertainties were 0.21% and 0.09%, respectively. The most of the computed individual differences were within the cone-specific mean statistical uncertainties. The differences in single volume dose calculations are summarized in Supplementary Table I.
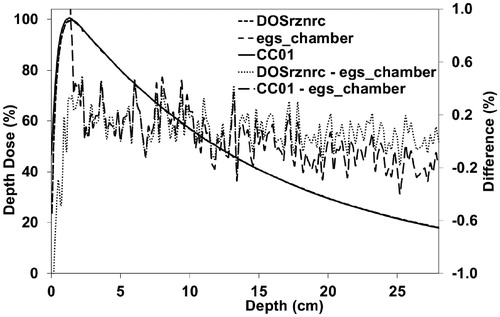
The maximum difference between PDD curves calculated with CC20 () was 0.49% (at depths larger than dmax) and the maximum DTA was 0.64 mm (at depths lower than dmax). The maximum and mean gamma values were 0.79 and 0.10, respectively. The maximum difference between the measurements and the calculations was 0.90% (at depths larger than dmax) and the maximum DTA was 1.50 mm (at depths lower than dmax). The maximum and mean gamma values were 1.34 and 0.20, respectively. With CC7.5 (Supplementary Figure II) the maximum difference between the calculations at depths larger than dmax was 0.31% and the maximum DTA at depths lower than dmax was 0.50 mm. The maximum and mean gamma values were 0.33 and 0.06, respectively.
Figure 1. PDD curves for CC20 calculated with the DOSRZnrc and the egs_chamber user codes and measured with the CC01 IC. The global difference is calculated with 1-mm-intervals from the interpolated data. PDD: percentage depth dose; CC: conical collimator; IC: ionization chamber.
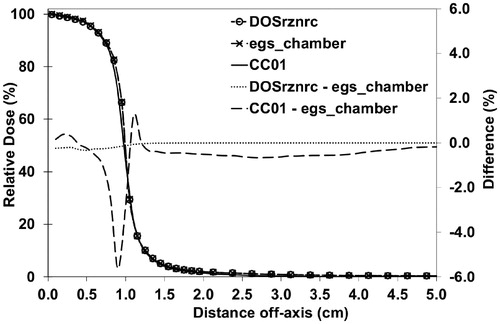
The maximum difference between profiles calculated with CC20 () was 0.34% at high dose region (dose from 100% to 80%) and out-of-field region (dose below 20%) and the DTA values were less than 0.10 mm at penumbra region (dose from 80% to 20%). The maximum and mean gamma values were 0.31 and 0.01, respectively. The maximum difference between the measurements and the calculations at high-dose region and out-of-field region was 0.98% and the DTA values were below 0.30 mm at penumbra region. The maximum and mean gamma values were 0.67 and 0.23, respectively. With CC7.5 (Supplementary Figure III) the maximum difference between the calculations at high dose and out-of-field regions was 0.23% and the DTA values at penumbra region were less than 0.10 mm. The maximum and mean gamma values were 0.04 and 0.00, respectively.
Figure 2. Half profiles for CC20 calculated with the DOSRZnrc and the egs_chamber user codes and measured with the CC01 IC. The global difference is calculated with 1-mm-intervals from the interpolated data. Calculated points of the DOSRZnrc and the egs_chamber are presented with circle and cross symbols, respectively. CC: conical collimator; IC: ionization chamber.
Discussion
The dose calculations with two user codes, DOSRZnrc and egs_chamber, were compared through following application examples: (1) single volume and (2) PDD curve and profile calculations. The single volume calculations were consistent (Supplementary Table I) and most of the calculation results were within the mean statistical uncertainties. With the egs_chamber the more complicated simulation geometries may be created, which makes it useful for the simulation of ionization chambers. However, the DOSRZnrc is convenient e.g. in air kerma calculations, which was applied, e.g., in the study of Fulkerson et al. [Citation11].
The PDD curve calculations were in good agreement with each other (). The difference in the PDD curves between the calculations and the measurements increased slightly with depth, which may result from inaccuracy of the movement mechanism of the water phantom. This can be caused by the detector movement away from beam central axis with increasing depth. Another possible reason could be minor differences between the energy spectra of the modeled and measured beams. Nevertheless, the largest differences between the measured and the calculated results are observed at the surface (), which was observed also in the study of Chibani et al. [Citation6]. Moreover, large differences between the calculation results are seen at the surface. Possible reason for the discrepancies between the MC results could be related to how these codes manage the interplay between the radiation transport, especially boundary crossing modeling, and the simulation geometry, which is the key difference between these codes. However, further investigations are needed – especially at medium interfaces – but they were out of the scope of this study. These differences are clinically important at lung-tumour interfaces because volumes of dose build-up regions are relatively large in small lung tumors.
At distances outside the high dose gradient regions, the difference between the calculated profiles was less than 0.1% showing excellent agreement (). The small differences between the measurements and the calculations in the out-of-field regions were most likely related to (1) the inability of the MC model to simulate correctly the scattered radiation propagating through and originating from beam collimators and shielding, (2) the change in the detector response to the scattered radiation in out-of-field region, or (3) the combination of these. In , the broadening of beam penumbra obtained with the CC01 IC can be seen. This is due to the dose averaging effect in the measurements because of relatively large diameter of the detector compared with the width of the penumbra of the radiation field [Citation1].
As a conclusion, the results were in good agreement, being within statistical uncertainties and showed that dose calculations obtained with the DOSRZnrc and the egs_chamber are comparable with each other. This is important information and encourages the use of the egs_chamber over the traditional DOSRZnrc in dose calculations, considering the versatility of the geometry library of the egs_chamber, which is not restricted to a cylindrical geometry only.
IONC_1292048_supplemental_material.pdf
Download PDF (449.6 KB)Disclosure statement
The authors report no conflicts of interest. The authors alone are responsible for the content and writing of this article.
Additional information
Funding
Related Research Data
References
- Taylor ML, Kron T, Franich RD. A contemporary review of stereotactic radiotherapy: inherent dosimetric complexities and the potential for detriment. Acta Oncol. 2011;50:483–508.
- Alfonso R, Andreo P, Capote R, et al. A new formalism for reference dosimetry of small and nonstandard fields. Med Phys. 2008;35:5179–5186.
- Das IJ, Ding GX, Ahnesjö A. Small fields: nonequilibrium radiation dosimetry. Med Phys. 2008;35:206–215.
- Chetty IJ, Curran B, Cygler JE, et al. Report of the AAPM Task Group No. 105: Issues associated with clinical implementation of Monte Carlo-based photon and electron external beam treatment planning. Med Phys. 2007;34:4818–4853.
- Kawrakow I, Mainegra-Hing E, Rogers DWO, et al. The EGSnrc Code System: Monte Carlo Simulation of Electron and Photon Transport. Ottawa, Canada: National Research Council of Canada. Report PIRS-701; 2016.
- Chibani O, Li XA. Monte Carlo dose calculations in homogeneous media and at interfaces: a comparison between GEPTS, EGSnrc, MCNP, and measurements. Med Phys. 2002;29:835–847.
- Vilches M, García-Pareja S, Guerrero R, et al. Monte Carlo simulation of the electron transport through air slabs: a comparative study of PENELOPE, GEANT3, Geant4, and EGSnrc Monte Carlo codes. IEEE Trans Nucl Sci. 2008;55:710–716.
- Archambault JP, Mainegra-Hing E. Comparison between EGSnrc, Geant4, MCNP5 and Penelope for mono-energetic electron beams. Phys Med Biol. 2015;60:4951–4962.
- Pimpinella M, Caporali C, Stravato A, et al. Monte Carlo calculation of correction factors for dosimetry in radiotherapy using the correlated sampling method. Rom Rep in Phys 2014;66:109–119.
- Sutherland JGH, Rogers DWO. Monte Carlo calculated absorbed-dose energy dependence of EBT and EBT2 film. Med Phys. 2010;37:1110–11116.
- Fulkerson RK, Micka JA, DeWerd LA. Dosimetric characterization and output verification for conical brachytherapy surface applicators. Part I. Electronic brachytherapy source. Med Phys. 2014;41:022103
- Kawrakow I, Mainegra-Hing E, Tessier F, et al. The EGSnrc C++ class library. Ottawa, Canada: National Research Council of Canada. Report PIRS-898; 2009.
- Ojala J, Monte Carlo simulations in quality assurance of dosimetry and clinical dose calculations in radiotherapy, Vol. 1225. Tampere: Tampere University of Technology. Publication; 2014.
- Ojala J, Hyödynmaa S, Barańczyk R, et al. Performance of two commercial electron beam algorithms over regions close to the lung–mediastinum interface, against Monte Carlo simulation and point dosimetry in virtual and anthropomorphic phantoms. Phys Med.2014;30:147–154.
- Ojala J, Hyödynmaa S, Pitkänen M, BEAMnrc Monte Carlo modelling of linear accelerator using parallel computing grid – validation of a common, fixed geometry model for photon and electron beams. Proceedings of XVIth ICCR, Amsterdam, The Netherlands, 2010.
- Ojala JJ, Kapanen MK, Hyödynmaa SJ, et al. Performance of dose calculation algorithms from three generations in lung SBRT: comparison with full Monte Carlo-based dose distributions. J Appl Clin Med Phys. 2014;15:4662
- Ojala J, Kapanen M, Sipilä P, Hyödynmaa S, Pitkänen M. The accuracy of Acuros XB algorithm for radiation beams traversing a metallic hip implant – comparison with measurements and Monte Carlo calculations. J Appl Clin Med Phys. 2014;15:4912.
- Low DA, Harms WB, Mutic S, et al. A technique for the quantitative evaluation of dose distributions. Med Phys. 1998;25:656–661.