
Abstract
Purpose: Xerostomia is a common side effect of radiotherapy resulting from excessive irradiation of salivary glands. Typically, xerostomia is modeled by the mean dose-response characteristic of parotid glands and prevented by mean dose constraints to either contralateral or both parotid glands. The aim of this study was to investigate whether normal tissue complication probability (NTCP) models based on the mean radiation dose to parotid glands are suitable for the prediction of xerostomia in a highly conformal low-dose regime of modern intensity-modulated radiotherapy (IMRT) techniques.
Material and methods: We present a retrospective analysis of 153 head and neck cancer patients treated with radiotherapy. The Lyman Kutcher Burman (LKB) model was used to evaluate predictive power of the parotid gland mean dose with respect to xerostomia at 6 and 12 months after the treatment. The predictive performance of the model was evaluated by receiver operating characteristic (ROC) curves and precision-recall (PR) curves.
Results: Average mean doses to ipsilateral and contralateral parotid glands were 25.4 Gy and 18.7 Gy, respectively. QUANTEC constraints were met in 74% of patients. Mild to severe (G1+) xerostomia prevalence at both 6 and 12 months was 67%. Moderate to severe (G2+) xerostomia prevalence at 6 and 12 months was 20% and 15%, respectively. G1 + xerostomia was predicted reasonably well with area under the ROC curve ranging from 0.69 to 0.76. The LKB model failed to provide reliable G2 + xerostomia predictions at both time points.
Conclusions: Reduction of the mean dose to parotid glands below QUANTEC guidelines resulted in low G2 + xerostomia rates. In this dose domain, the mean dose models predicted G1 + xerostomia fairly well, however, failed to recognize patients at risk of G2 + xerostomia. There is a need for the development of more flexible models able to capture complexity of dose response in this dose regime.
Introduction
Radiotherapy is a main treatment for head and neck cancer patients [Citation1,Citation2]. During the treatment, however, ionizing radiation can impair salivary glands function leading to xerostomia, that is, reduced saliva flow. Xerostomia causes speaking, chewing and swallowing difficulties as well as general dental health deterioration severely reducing quality of life [Citation3].
Current clinical guidelines formulated in 2010 by Quantitative Analyses of Normal Tissue Effects in the Clinic (QUANTEC) group state that severe xerostomia ‘can usually be avoided’, if at least one parotid gland receives a mean dose lower than 20 Gy or both parotid glands are spared to a mean dose less than 25 Gy [Citation4].
Since introduction of QUANTEC recommendations, IMRT techniques improved on conformity of target dose coverage and allow achieving step-like dose gradients between target and organs at risk. As a result, current treatment plans often spare both parotid glands to 20–25 Gy [Citation5,Citation6], whereas a typical mean dose to parotid glands of a head and neck cancer patient in 1996–2007 was closer to 30–40 Gy range [Citation7,Citation8].
Here, we investigated parotid gland mean doses delivered to head and neck cancer patients in our center and whether the mean dose is a reliable predictor of xerostomia for modern IMRT treatments. For this purpose, we estimated parameters and evaluated the predictive performance of the Lyman Kutcher Burman (LKB) model [Citation9,Citation10] at 6 and 12 months after the treatment.
Material and methods
Patients
This retrospective study comprised 153 head and neck cancer patients treated in Heidelberg University Hospital in years 2010–2015. Patient exclusion criteria were: nonzero baseline xerostomia, replanning during the treatment, tumor in the parotid gland, second irradiation or chemotherapy, proton or ion beam boost. Patient and tumor characteristics are listed in . The study was approved by the Ethics Committee of Heidelberg University.
Table 1. Patient and tumor characteristics.
Endpoints
Routine follow-up reports at Heidelberg University Hospital are usually collected at three-month intervals, starting from the first radiotherapy treatment fraction (). Due to slight variations in the follow-up schedule of individual patients, we defined two late toxicity time intervals: 6 ± 3 months and 12 ± 3 months.
Figure 1. Frequency of the follow-up reports.
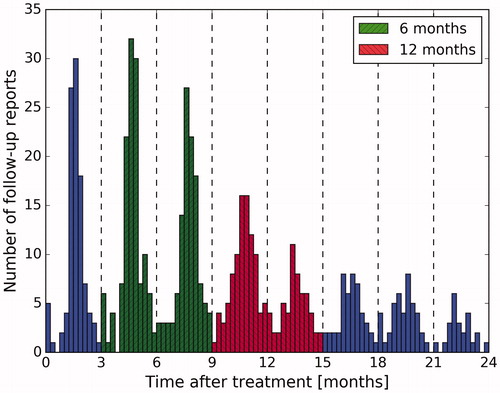
Of 693 available xerostomia toxicity follow-up reports, 516 (74%) used Common Terminology Criteria for Adverse Effects (CTCAE) grading scale [Citation11]. Either CTCAE v3.0 or v4.03 was used, but this did not introduce any inconsistency in grading, as dry mouth (xerostomia) definitions are identical in both versions. In case no score was provided but descriptive toxicity information was available, appropriate CTCAE scores were assigned after consulting clinicians. To ensure coherence in translation from qualitative descriptive terms to toxicity scores, a set of rules in the form of a dictionary was developed. If a patient received more than one xerostomia evaluation in a certain time interval, a final toxicity score was calculated as an arithmetic mean rounded to the nearest whole number. Furthermore, variability of the scores was measured as an average percentage of reports with xerostomia grades different than the final grade.
In this study, we aimed to model two clinical endpoints: (1) moderate to severe xerostomia quantified by grades 2 and higher (G2+) and (2) mild to severe xerostomia quantified by grades 1 and higher (G1+).
Normal tissue complication probability model
The Lyman Kutcher Burman model is an example of a generalized linear model with the probit link function. In the study, we applied a formulation proposed by Mohan [Citation12].
(1)
(2)
In EquationEquation (2)(2) , di represents the dose deposited to the relative volume vi of an organ of interest. The n parameter controls strength of the volume effect. Values of n close to zero describe serial structures, in which toxicity is dominated by the maximum dose, whereas n close to one characterize parallel structures, in which toxicity can be controlled by partial sparing of an organ. The d50 parameter represents the equivalent uniform dose deud with a 50% complication probability (NTCP = 0.5). The m parameter characterizes a slope of the decision function in a way that a product of m and d50 is equal to a standard deviation of a tolerance dose distribution in the sample, under the assumption that the tolerance dose value is normally distributed.
In this study, we assumed parallel structure of parotid glands (n = 1) which is commonly done in studies on xerostomia toxicity [Citation4]. With this parameterization, deud is simply a mean dose. Due to a low number of observations in a near zero-dose region, a zero-dose correction was applied [Citation13]. Thus, for every LKB model artificial zero-dose dose-volume histograms were added to ensure maximal NTCP of 5% for a zero dose.
Statistical analysis
Barnard’s test was used to investigate whether there was a difference in xerostomia rates between IMRT and tomotherapy patients.
To estimate the expected xerostomia rate in our data set based on a published NTCP model, the complication probability was calculated for each patient and then averaged over all cases.
(3)
The predictive performance of the trained model (model training described in Appendix A) was measured with ROC curves. ROC curves show a tradeoff between sensitivity and specificity (Appendix B), allowing for an informed decision threshold selection. Intuitively, the area under a ROC curve (AUC) can be interpreted as a probability that a randomly chosen patient from the positive group will be assigned (correctly) higher score than a randomly chosen patient from the negative group (AUC=p(score(x+))>score(x-)). Statistical significance of the AUC estimates was calculated by integration of the left-tail of the U distribution [Citation14]. Confidence intervals of the AUCs and the statistical significance of the difference between the AUCs were estimated using DeLong’s method [Citation15,Citation16].
Additionally, we present precision-recall (PR) plots which demonstrate interdependence of precision and recall (Appendix B) on a decision threshold. Similarly to a ROC curve, a PR plot allows for a model-wide evaluation. However, it can expose differences between models that are not apparent in a ROC plot [Citation17]. Whereas a ROC curve shows a model’s ability to recognize positive (sensitivity) and negative (specificity) cases, a PR curve informs how high sensitivity of a model affects reliability of positive predictions (precision) and vice versa.
Results
QUANTEC constraint of <20 Gy to a contralateral parotid gland was met in 52% of patients and <25 Gy to both parotid glands in 72% of patients. At least one QUANTEC constraint was satisfied in 74% of patients (). The observed xerostomia toxicity rates and variability of the toxicity scores are shown in and , respectively.
Figure 2. Scatterplot of mean doses to parotid glands and corresponding xerostomia grades at 12 months after the treatment.
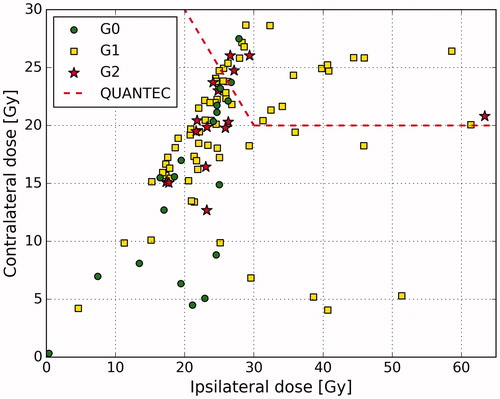
Table 2. Variability of xerostomia grades.
There was no difference in terms of xerostomia prevalence between IMRT and tomotherapy groups. We compared G0 vs. G1, G0 vs. G2 and G0-1 vs. G2 at 6 and 12 months after the treatment but no test was significant at the significance level α=0.05.
Xerostomia prevalence and the dosimetric characteristic of our cohort were compared to the results of the PARSPORT clinical trial [Citation18,Citation19]. The average mean dose to the contralateral glands in our patient group was lower than in the PARSPORT cohort (18.7 Gy vs. 24.9 Gy). The difference in the average mean dose to the ipsilateral glands was even more pronounced (25.4 Gy vs. 45.7 Gy). presents in more detail the dose distributions in both cohorts. The prevalence of LENT-SOMA G2 + xerostomia at 12 months in the PARSPORT cohort was reported to be 38%. To investigate what xerostomia prevalence was predicted in our cohort, we used the LKB model trained on the PARSPORT data (d50 = 28.7 Gy, m = 0.20, n = 1). The expected LENT-SOMA G2 + prevalence at 12 months turned out to be 11% in comparison to observed 15% CTCAE G2+. presents a LENT-SOMA G2 + xerostomia probability curve from the PARSPORT trial and the observations from our cohort.
Figure 3. Comparison of parotid glands mean dose distributions between our (HD) and the PARPSORT (PAR) data sets. Outliers, that is, observations further than 1.5 interquartile range (IQR) from the first or the third quartile, are marked with ‘+’.
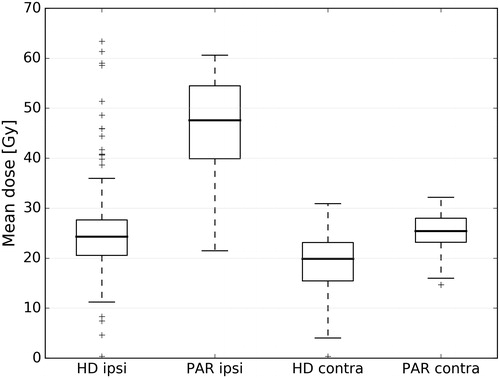
Figure 4. NTCP function for G2 + xerostomia at 12 months based on the data from the PARSPORT clinical trial ([Citation19]) with observations from our cohort.
![Figure 4. NTCP function for G2 + xerostomia at 12 months based on the data from the PARSPORT clinical trial ([Citation19]) with observations from our cohort.](/cms/asset/29075b51-707c-4651-88c4-06fc1edcff44/ionc_a_1324209_f0004_c.jpg)
To estimate the parameters and evaluate the predictive performance of the LKB model on our data, we fitted the model to predict G1 + and G2 + toxicity at 6 and 12 months after the treatment based on either the mean dose to contralateral or to both parotid glands. This setting resulted in eight LKB models. The models' parameters together with 95% confidence intervals are presented in . For G1 + xerostomia modeled by the mean dose to the contralateral gland, the d50 increased slightly from 10.7 Gy to 12.0 Gy when moving from 6 to 12 months time point. The LKB fits for G1+ toxicity based on the mean dose to both parotid glands exhibited a similar time point-dependent shift of d50, namely from 12.2 Gy at 6 months to 13.6 Gy at 12 months. The m parameter stayed at 0.61 for all G1+ models. The NTCP curves for G1 + xerostomia are shown in . The d50 parameters for G2 + xerostomia models ranged from 42.8 Gy to 64.8 Gy depending on the time point and the analyzed gland; however, huge confidence intervals reveal that the models failed to fit to the data.
Figure 5. NTCP and performance curves for G1 + xerostomia. (a) NTCP functions at 6 months, (b) NTCP functions at 12 months, (c) ROC curves at 6 months, (d) ROC curves at 12 months, (e) Precision-recall curves at 6 months, (f) Precision-recall curves at 12 months.
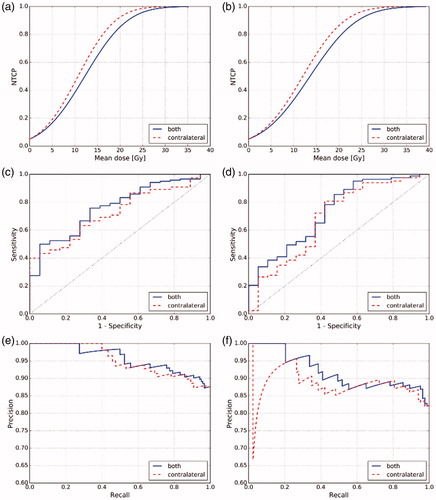
Table 3. The parameters and performance of the LKB models with 95% confidence intervals.
Predictive performance of the LKB models ranged from AUC = 0.69 to 0.76 for G1 + xerostomia. The G1 + models based on the mean dose to both parotid glands scored higher than contralateral mean dose models for both analyzed time points. The difference, however, was not significant at the significance level α=0.05. The PR curves also did not reveal any substantial advantage of one predictor over the other. shows the ROC and PR curves for the LKB G1 + models. The predictive performance of all G2 + LKB models was close to a random classifier, that is, AUC = 0.50 and not significant at the significance level α=0.05. The AUCs with confidence intervals and corresponding p values of all models are summarized in .
Discussion
In recent years, considerable attention was given to the validation of QUANTEC guidelines to avoid severe and moderate to severe radiation induced xerostomia [Citation20,Citation21]. These studies supported QUANTEC recommendations; nevertheless, the common conclusion was that further dose reduction was advisable.
In the PARSPORT clinical trial, median doses of 46 Gy and 25 Gy to ipsi- and contralateral parotid glands, respectively, corresponded to 38% LENT-SOMA subjective G2 + xerostomia prevalence at 12 months. Beetz et al. [Citation22] reported a similar moderate to severe xerostomia rate measured by patient-based EORTC QLQ-H&N35 questionnaires with the average mean dose to parotid glands of 30 Gy. Leung et al. [Citation5] showed that sparing ipsi- and contralateral parotid glands to mean doses of 22 Gy and 20 Gy, respectively, resulted in RTOG/EORTC G2 + xerostomia in only two patients (3%). However, it must be noted that the RTOG/EORTC scores can underestimate the severity of xerostomia [Citation4,Citation23]. Nevertheless, in 2015 Lee et al. [Citation6] presented a patient cohort with ipsi- and contralateral parotid gland mean doses of 23 Gy and 22 Gy, respectively, and only 24% EORTC QLQ-H&N35 moderate to severe xerostomia prevalence at 6 months after the treatment.
A comparison of toxicity scores coming from different grading systems is not straightforward, as concordance between the assigned grades can be low. Quantitative evaluations, such as saliva flow measurements, are highly variable and often translate poorly to patient’s quality of life [Citation4]. Also, purely observer-based systems, for example, the RTOG/EORTC, suffer from misinterpretation and omission errors [Citation24] and can underestimate patient’s subjective xerostomia [Citation4,Citation23]. The common notion is that patient-reported scores should be used for xerostomia assessment as a solely measure [Citation23,Citation25] or as a supplementary data at least [Citation4,Citation24]. Ho et al. [Citation25] compared two such patient-based scoring systems, namely EORTC QLQ-HN35 with the LENT-SOMA subjective, and found good agreement between them. This finding likely extends to the CTCAE system because the LENT-SOMA items were incorporated into the CTCAE v. 3.0 (National Cancer Institute (NCI), Rockville, MD, USA).
Our results seem to be in accordance with the dose-response pattern emerging from the recently published studies. That is, sparing of both parotid glands to a mean dose as low as possible resulted in low G2 + xerostomia prevalence at 6 and 12 months after the treatment.
The LKB model proved to be unsuitable for G2 + xerostomia prediction in our patient cohort. The widths of d50 CI.95 are in range of hundreds of grays showing that the model failed to fit the data. The lack of predictive power was supported by both low AUC values and no statistical significance thereof. Because of the close correspondence between AUC and Mann–Whitney U-test, nonsignificant p values are a hallmark of weak class separation with respect to the predictor. Therefore, our results show that neither the mean dose to both parotid glands, nor the mean dose to the contralateral parotid gland differentiate well the patients at risk of G2 + xerostomia in our data set. Furthermore, even though all G2 + xerostomia patients from our cohort are in the low-risk region of the curve (), for some cases, the probability of complication was not negligible being in range of 20–30%.
The G1 + xerostomia was described fairly well by the LKB model. AUC values exceeding 0.70 indicate a clear dose dependence of mild xerostomia. It is important to note that the steepest part of the NTCP curve of the LKB model corresponds to the doses close to d50; hence, a mean dose reduction in this region will have relatively the largest effect on a complication probability reduction. Since d50 estimates in our cohort are in range of 11–14 Gy, we conclude that the mean dose to parotid glands should be kept as low as possible, even in the sub-20 Gy mean dose region, to reduce incidence of G1 + xerostomia.
We want to emphasize that the data in this study was collected retrospectively and, as such, represents inferior quality compared to clinical data from prospective studies. For instance, 26% of the follow-up reports contained qualitative descriptive terms with no CTCAE grade. Although we strove to diligently translate these terms to toxicity scores, there is a degree of uncertainty to how our grades may differ from those that could have been assigned by clinicians at the time of patient evaluation. Furthermore, the number of follow-up reports per time point interval varied from patient to patient. Thus, one could argue that a patient who was evaluated several times in a certain time interval was a more accurate data point than a patient who was evaluated only once. Moreover, we observed higher variations of assigned toxicity grades in G2 xerostomia patients compared to G1 or no xerostomia patients at both 6 and 12 months time points, as many patients oscillated between G1 and G2 toxicity.
It was commonly reported in the literature that the LKB model well discriminated patients at risk of moderate to severe xerostomia when patients received doses of radiation clearly exceeding QUANTEC guidelines [Citation20,Citation22,Citation26]. Nowadays, however, due to efficient parotid sparing techniques, the prevalence of G3 + is rare. Furthermore, patients at risk of G2 xerostomia are not recognized by mean dose models in a low-dose domain. Several studies emphasized the importance of the submandibular gland function as a potential factor in xerostomia prediction, as it is responsible for 20–30% saliva secretion [Citation4,Citation6]. Information about surgical resection or the radiation dose to this gland may be a significant component in future studies on xerostomia toxicity modeling in a low-risk dose domain. Additionally, it could be beneficial to explore classification algorithms exploiting more complex dosimetric and organ-shaped features [Citation27,Citation28]. Such models may provide clinical guidelines for treatment planning in cases where a reduction of the mean dose to parotid glands is not attainable.
Conclusions
Our results show that parotid gland sparing satisfying QUANTEC constraints was feasible for almost three-fourths of patients included in the study. The mean dose to parotid glands proved to be a fair predictor of G1 + xerostomia confirming the notion that even a low dose impairs parotid gland function. On the other hand, the mean dose to parotid glands failed to recognize patients at risk of G2 + xerostomia. We therefore conclude that there is a need for the development of new NTCP models relying on more complex features, better suited for dose-response modeling of salivary glands in a low-dose domain, that is, a mean dose close to or beyond QUANTEC recommendations.
Acknowledgments
We would like to thank (in alphabetical order) Jürgen Debus, Alexander Emig, Sebastian Klüter, Henning Mescher, Dieter Ötzel and Kai Schubert for invaluable help and support during the clinical data extraction.
Disclosure statement
The authors report no conflicts of interest. The authors alone are responsible for the content and writing of the paper.
Related Research Data
References
- Setton J, Caria N, Romanyshyn J, et al. Intensity-modulated radiotherapy in the treatment of oropharyngeal cancer: an update of the memorial Sloan-Kettering Cancer Center experience. Int J Radiat Oncol Biol Phys. 2012;82:291–298.
- Peng G, Wang T, Yang KY, et al. A prospective, randomized study comparing outcomes and toxicities of intensity-modulated radiotherapy vs. conventional two-dimensional radiotherapy for the treatment of nasopharyngeal carcinoma. Radiother Oncol. 2012;104:286–293.
- Wijers OB, Levendag PC, Braaksma MMJ, et al. Patients with head and neck cancer cured by radiation therapy: a survey of the dry mouth syndrome in long-term survivors. Head Neck. 2002;24:737–747.
- Deasy JO, Moiseenko V, Marks L, et al. Radiotherapy dose-volume effects on salivary gland function. Int J Radiat Oncol Biol Phys. 2010;76:S58–S63.
- Leung SW, Lee TF. Treatment of nasopharyngeal carcinoma by tomotherapy: five-year experience. Radiat Oncol. 2013;8:107.
- Lee TF, Liou MH, Ting HM, et al. Patient- and therapy-related factors associated with the incidence of xerostomia in nasopharyngeal carcinoma patients receiving parotid-sparing helical tomotherapy. Sci Rep. 2015;5:13165.
- Braam PM, Terhaard CHJ, Roesink JM, et al. Intensity-modulated radiotherapy significantly reduces xerostomia compared with conventional radiotherapy. Int J Radiat Oncol Biol Phys. 2006;66:975–980.
- Dijkema T, Terhaard CHJ, Roesink JM, et al. Large cohort dose-volume response analysis of parotid gland function after radiotherapy: intensity-modulated versus conventional radiotherapy. Int J Radiat Oncol Biol Phys. 2008;72:1101–1109.
- Lyman JT. Complication probability as assessed form dose-volume histograms. Radiat Res. 1985;104:S13–S19.
- Kutcher GJ, Burman C. Calculation of complication probability factors for non-uniform normal tissue irradiation: the effective volume method. Int J Radiat Oncol Biol Phys. 1989;16:1623–1630.
- US Department of Health and Human Services. Common terminology Criteria for Adverse Events (CTCAE) Version 4.03. National Cancer Institute. 2010.
- Mohan R. Clinically relevant optimization of 3-D conformal treatments. Med Phys. 1992;19:933–944.
- Braam PM, Roesink JM, Moerland MA, et al. Long-term parotid gland function after radiotherapy. Int J Radiat Oncol Biol Phys. 2005;62:659–664.
- Mason SJ, Graham NE. Areas beneath the relative operating characteristics (ROC) and relative operating levels (ROL) curves: statistical significance and interpretation. Q J R Meteorol Soc. 2002;128:2145–2166.
- DeLong ER, DeLong DM, Clarke-Pearson DL. Comparing the areas under two or more correlated receiver operating characteristic curves: a nonparametric approach. Biometrics. 1988;44:837–845.
- Robin X, Turck N, Hainard A, et al. pROC: an open-source package for R and S + to analyze and compare ROC curves. BMC Bioinformatics. 2011;12:77.
- Davis J, Goadrich M. The relationship between Precision-Recall and ROC curves. Proceedings of the 23rd international conference on Machine learning; 2006 Jun 25–29; Pittsburgh, PA. New York (NY): ACM; 2006. p. 233–240.
- Nutting CM, Morden JP, Harrington KJ, et al. Parotid-sparing intensity modulated versus conventional radiotherapy in head and neck cancer (PARSPORT): a phase 3 multicentre randomised controlled trial. Lancet Oncol. 2011;12:127–136.
- Miah AB, Gulliford SL, Clark CH, et al. Dose-response analysis of parotid gland function: What is the best measure of xerostomia?. Radiother Oncol. 2013;106:341–345.
- Lee TF, Fang FM. Quantitative analysis of normal tissue effects in the clinic (QUANTEC) guideline validation using quality of life questionnaire datasets for parotid gland constraints to avoid causing xerostomia during head-and-neck radiotherapy. Radiother Oncol. 2013;106:352–358.
- Beetz I, Steenbakkers RJHM, Chouvalova O, et al. The QUANTEC criteria for parotid gland dose and their efficacy to prevent moderate to severe patient-rated xerostomia. Acta Oncol. 2014;53:597–604.
- Beetz I, Schilstra C, Burlage FR, et al. Development of NTCP models for head and neck cancer patients treated with three-dimensional conformal radiotherapy for xerostomia and sticky saliva: the role of dosimetric and clinical factors. Radiother Oncol. 2012;105:86–93.
- Meirovitz A, Murdoch-Kinch CA, Schipper M, et al. Grading xerostomia by physicians or by patients after intensity-modulated radiotherapy of head-and-neck cancer. Int J Radiat Oncol Biol Phys. 2006;66:445–453.
- Trotti A, Colevas AD, Setser A, et al. Patient-reported outcomes and the evolution of adverse event reporting in oncology. J Clin Oncol. 2007;25:5121–5127.
- Ho KF, Farnell DJJ, Routledge JA, et al. Comparison of patient-reported late treatment toxicity (LENT-SOMA) with quality of life (EORTC QLQ-C30 and QLQ-H&N35) assessment after head and neck radiotherapy. Radiother Oncol. 2010;97:270–275.
- Houweling AC, Philippens MEP, Dijkema T, et al. A comparison of dose-response models for the parotid gland in a large group of head-and-neck cancer patients. Int J Radiat Oncol Biol Phys. 2010;76:1259–1265.
- Buettner F, Miah AB, Gulliford SL, et al. Novel approaches to improve the therapeutic index of head and neck radiotherapy: an analysis of data from the PARSPORT randomised phase III trial. Radiother Oncol. 2012;103:82–87.
- Dean JA, Wong KH, Gay H, et al. Functional data analysis applied to modeling of severe acute mucositis and dysphagia resulting from head and neck radiation therapy. Int J Radiat Oncol Biol Phys. 2016;96:820–831.
Appendix A
Model training
The LKB model parameters were fitted using maximum likelihood estimation (MLE) with Newton-Raphson optimization.
(A1)
(A2)
Typically, maximum-likelihood estimates are asymptotically normally distributed. Therefore, 95% confidence intervals (CI.95) of the LKB parameters were calculated from quantiles of Normal probability distribution parameterized by the estimates’ values and their standard errors (SE) EquationEquation (A3(3) ). In MLE, standard errors of parameters are given by square roots of diagonal elements of an asymptotic covariance matrix calculated by taking an inverse Hessian of a negative log-likelihood function EquationEquation (A4
(A1) –EquationA5
(A2) ).
(A3)
(A4)
(A5)
Appendix B
Table A1. Confusion matrix.