
Abstract
Introduction: The cost of cancer and outcomes of cancer care has been much debated, since cancer represents 3–6% of total healthcare costs. The objective of this study was to analyse the development of the costs and outcomes in Finland between 2004 and 2014.
Material and methods: The national cost, episodes and outcomes data were obtained from the national register databases. Two hospitals were used to validate the costs of care. The outcome measures included relative survival rate, mortality, sick leave days per patient and number of new disability pensions.
Results: The total cost of cancer in 2014 was 927 million €. The real costs increased by 1.7% per year over the period studied, while the cost per new cancer patient decreased. The relative survival rate was enhanced by 7%, and the number of sick leave days and new disability pensions per cancer patient was reduced. The share occupied by cancer treatment in total healthcare costs decreased slightly from 3.7% to 3.6%, indicating that cancer care has not become more expensive compared to the treatment of other diseases.
Conclusions: This is the first survey to analyse the change in actual cancer costs and outcomes in the population-level within a 10-year period. Since cancer care outcomes in Finland have been among the best in Europe, the progress in terms of the costs and the conversions in the cost distributions across categories are significant and valuable sources for international comparisons.
Introduction
In 2009, Europe’s cancer treatment costs were 51 billion euros, representing 3–6% of total healthcare costs in European countries [Citation1]. With an aging population, the number of new cancer patients is increasing and this is expected to continue in the future [Citation2–4]. In addition, new and expensive medicines are being introduced in cancer care. Hence, there is increasing concern over whether we will be able to provide affordable cancer care to all in the future [Citation5].
There are several studies on the cost of cancer, covering most high-income countries [e.g., Citation1,Citation6–11]. However, the methodologies and cost data used vary across studies and countries, making the results difficult to compare. There have been efforts to develop frameworks for the estimation of cancer-related costs and to understand the drivers of cost [Citation5,Citation12,Citation13], but this is still far from perfect. For instance, there is wide variation in the cost items included in the calculations. The ‘cost of illness’ (COI) approach, which includes treatment costs, lost productivity from premature deaths and decreased ability to work, as well as the costs of informal care, is fairly popular. In the ‘health economics’ approach, the cost of deaths is replaced by a measurement of health-related quality of life. However, in practice, the data availability has determined the cost elements included in the previous calculations; also, in addition to the expenditures for different components of cancer care, cancer treatment has to be considered in terms of what benefits it yields for patients [Citation5]. There are several studies on cancer treatment outcomes in terms of survival rates, and comparisons across countries have been made [Citation14–17].
There are fewer studies that have reported the development in cancer costs over time or that have made forecasts for future development. Historical changes in cancer treatment costs have been reported by Torkki et al. [Citation18], Tangka et al. [Citation9], NHS England [Citation19] and the Dutch Ministerie van Volksgezondheid, Welzijn en Sport [Citation20]. In addition, studies that have considered both the development of costs and the outcomes on a system level are limited. To address this, the objective of this economic evaluation study is to analyse the changes in cost of cancer and outcomes of cancer treatment in Finland from 2004 to 2014. The actual development of costs over this period is compared to previous predictions [Citation8] and to international studies.
Methods
Cost framework
We evaluated the costs of cancer on a population level, including treatment and indirect costs. Cost categories included in the study follow those of Mäklin and Rissanen [Citation8] to allow for national comparisons. Costs were estimated for two years: 2009 and 2014. All costs are expressed in 2014 prices, adjusted using the healthcare price index [Citation21]. All treatment costs are reported as gross costs; i.e., including both the public expenditure and the patients’ co-payment or deductible.
Treatment costs include the costs of primary and secondary care, as well as the cost of cancer screening. However, the costs of prevention or health promotion were not included, due to lack of data. Indirect costs include both sick leave (exceeding 10 working days) and disability pensions. The cost of these factors was defined as the amount of benefits paid to patients in the form of compensations or pensions. This approach was used in order to quantify the amount of public funds used to pay for the social benefits, rather than to estimate the value of lost productivity to the employers or society as a whole. Mortality was not included in the indirect costs, as lost productivity due to mortality is questionable when the unemployment rate is above natural unemployment, among other limitations [Citation5].
The cost of care was obtained by multiplying the number of inpatient episodes and visits by respective unit costs. The unit costs of the inpatient episodes and outpatient visits for each speciality, as well as for primary care in 2011, were based on the national price list documented in a publication by the National Institute for Health and Welfare [Citation22]. These costs include all costs of production such as doctors’ salaries, nursing, inpatient medication, materials, facilities and equipment costs. We used patient-level activity-based costing (ABC) data from the largest university hospital and central hospital in Finland to calculate the percentage changes in the unit costs of care between 2009 and 2014. These estimates were applied to the national price list data from 2011 to correct the unit costs for 2009 and 2014.
The travelling costs of the patients were estimated from the number of visits and inpatient episodes, while the average distances travelled were based on the location model analysis of Venesmaa [Citation23]. The cost per kilometre was defined using the compensation level approved by the Finnish Tax Administration [Citation24].
The total cost per patient was estimated by dividing the annual total costs by number of new cancer patients, since we did not have the patient-level costs and the length of care episodes is often more than one year.
The forecasts for the development of cancer costs between 2004 and 2014 were estimated by Mäklin and Rissanen [Citation8]. The actual costs in 2009 and 2014 obtained in this study were compared to the estimated costs. The real costs were calculated based on changes in the consumer price index between 2004 and 2014 [Citation21].
Cancer registration and statistics in Finland
Cancer-related data in Finland are stored mainly in three registries: the Finnish Cancer Registry (data on cancer patients and screening), the registry of the National Institute for Health and Welfare (data on primary and secondary care visits, procedures and inpatient episodes) and the registry of the National Social Insurance Institution (SII) (data on reimbursements and benefits paid by insurance, such as medication, sick leave and pensions).
Cancer was defined for this study using the WHO International Classification of Diseases, 10th revision (ICD-10) codes C00-97 [Citation25]. All data were collected based on this definition, except for outpatient medication data, in which the inclusion criteria were based on the reimbursement codes used in the National SII. These are either disease-specific (most medicines) or medicine-specific (new, expensive medicines). The national inpatient and outpatient episode data were obtained from the national discharge register (HILMO) maintained by the National Institute for Health and Welfare [Citation22]. The data included the number of episodes and length of stay of all inpatient episodes related to cancer care from all specialties in secondary care, primary care and private hospitals and hospices, as well as the number of outpatient visits in secondary, primary care and private care. We combined the inpatient days in primary and private care in the analysis, since most private inpatient care is publicly funded and provided in private hospices.
The costs of rehabilitation, disability pensions and sick leave compensations were collected from the registers of SII.
The number of people screened annually for breast, cervical and colorectal cancer was obtained from the Mass Screening Registry of the Finnish Cancer Registry. While breast and cervical screening is statutory in Finland, screening for colorectal cancer has been a limited intervention, covering approximately 23% of the population in 2014.
Cancer treatment in Finland
The Finnish healthcare system is primarily publicly funded (75.6% of costs in 2014) [Citation22] and provided by publicly owned hospitals and primary care centres. Cancer treatment is primarily provided in secondary care, but primary care may offer supplementary follow-up visits and palliative inpatient care. In addition, the role of the private sector in cancer care is marginal, as the private sector in Finland mainly provides primary care, occupational healthcare and selected elective procedures. Medicines administered in the hospitals (IV or other injections) are included in the visit or episode price. Oral medications are on prescription and dispensed through private pharmacies, reimbursed by the SII. There were no major changes in the Finnish healthcare system between 2004 and 2014.
Outcomes of cancer care in Finland
In Finland, the five-year survival rates of ovarian and prostate cancer were the highest among all European countries, while the breast cancer survival rate was the second highest from 2005 to 2009 [Citation14]. According to the EUROCARE study, the five-year survival rates were above the European mean in all cancer sites in 2000–2007 except for lung and kidney cancer [Citation15].
We estimated the effectiveness of cancer care using relative survival rate, age-adjusted mortality, the number of disability pensions and the number of sick leave days as outcome measures. Relative survival rates indicate the proportion of patients who stay alive for a certain interval (such as one year or five years) after cancer diagnosis, compared to the proportion of people of the same age in the same area who stay alive during the same interval. The relative survival ratio can be interpreted as an estimation of expected survival probability in a situation in which the patient’s cancer is the only possible cause of death. The reason for also using age-adjusted mortality was the possibility of improved screening and diagnostics. Earlier diagnosis may increase the short-term survival rates, even if the long-term outcome would be similar. Using both survival and mortality rates decreases uncertainty over the interpretation of results. The relative survival rates, age-adjusted mortality of the cancer patients and the annual number of new cancer patients were obtained from the Finnish Cancer Registry.
The number of new disability pensions per year and the sick leave data obtained from the SII included both number of sick leave episodes and sick leave days. These data complement the survival and mortality rates, being proxy measures for functionality. The cost per new cancer patient was used as the cost measure.
Results
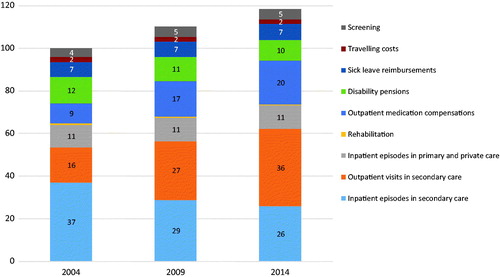
The total cost of cancer in Finland in 2014 was 927 million € (see ). The cost of care (indirect costs and screening excluded) was 736 million € (80% of the total costs). Of this, 52% was allocated to secondary and 48% to primary care. The total costs increased by 44% between 2004 and 2014 (4% per year). The costs of outpatient visits and medications shared the greatest annual growth (10%). The costs of inpatient episodes and disability pensions decreased. Within the study period, the proportion of the costs of inpatient episodes in secondary care decreased from 37% to 22% of the total costs. Correspondingly, the costs of outpatient care increased and already in 2014 represented the largest expenditure by 31%. The number of inpatient days decreased by 3% per year in secondary care and 0.2% in primary care between 2004 and 2014. The total decrease was 149,000 days in secondary and 8000 in primary and private care. The annual increase of outpatient visits was 8% (total 460,000 visits per year).
Table 1. Summary of costs and population level measures (nominal prices) for 2004 and 2014 in Finland.
In real terms, costs increased by 19% (1.7% per year) and the treatment costs rose by 27% (2.4% per year) (see ). The real cost per head of population in Finland was 149 € (in 2014 prices) in 2009 and 169 € in 2014, and the real cost per new cancer patient dropped slightly from 29,100 € (in 2014 prices) per new cancer patient in 2004 to 28,700 € per new patient in 2014.
Figure 1. The deflated costs of cancer by cost drivers for 2004, 2009 and 2014, 2004 = 100.
In an earlier Finnish study [Citation8], three forecasts were made for nominal costs (see ). The forecast given by the regression model proved to be the most accurate, predicting a 55% increase in nominal costs compared to the realised cost increase based on this study (43%).
Figure 2. Actual nominal costs compared to the national estimates made in 2006 [Citation8].
![Figure 2. Actual nominal costs compared to the national estimates made in 2006 [Citation8].](/cms/asset/b5e3596a-501c-4dab-8e78-2d11daacda08/ionc_a_1343495_f0002_c.jpg)
The total healthcare expenditure in real terms increased by 4.7% per year from 2004 to 2014. The share occupied by cancer treatment within total healthcare costs decreased slightly from 3.7 to 3.6% over the same period, indicating that cancer care has not become more expensive compared to the treatment of other diseases.
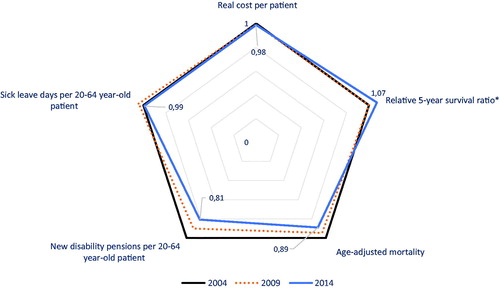
All measured outcomes of cancer care were better in 2014 compared to 2004 (see ). The relative one-year survival rates increased from 79 to 83, while five-year survival rates rose from 64 to 69 between 2004 and 2014. The age-adjusted mortality decreased from 98.6 deaths per 100,000 life years in 2004 to 87.6 deaths per 100,000 life years in 2014. The annual number of new disability pensions per new 20–64-year-old cancer patient was 0.15% in 2004 and 0.12% in 2014, while the number of sick leave days per new patient fell from 80 to 79 days.
Figure 3. The costs of cancer and the outcome measures of care for 2004, 2009 and 2014. 2004 = 1. *Survival ratio year means the observation year.
Discussion
The leading finding of this nationwide population-based survey was that the nominal costs of cancer increased by 3.7% and the real costs by 1.7% per year during 2004–2014. As the annual number of new cancer cases also increased yearly by 1.9%, the real costs per new cancer patient decreased slightly. The annual prevalence data are not available, but since mortality has decreased, prevalence should also be increased by more than the number of new patients. Therefore, the cost per living cancer patient has fallen more than the cost per new patient.
Tangka et al. [Citation9] identified two major trends in the total costs of cancer over the past 20 years: (1) the medical costs of cancer have nearly doubled; (2) cancer costs have shifted away from the inpatient setting. Our results support these findings: the real cost of outpatient medication has approximately doubled (but in 10 years rather than 20) and costs have shifted from inpatient to outpatient care. Mäklin and Rissanen [Citation8] reported an even higher increase in medication costs: 160% in eight years. The same authors also used a regression analysis that deployed historical time series data to estimate the link between the number of cancer patients and the total cost of cancer. The predicted annual increase in costs was 2.6% for 2005–2015, which is higher than what was observed in our study for roughly the same period.
Mariotto et al. [Citation6] used estimates of cancer prevalence in different phases of cancer and phase-specific costs of treatment, which were then projected to 2020 to obtain estimates for future cancer treatment costs. They obtained two projections for cost development: one assuming constant treatment cost (only changes in prevalence) and another assuming a 2% annual increase in phase-specific treatment costs in addition to changes in prevalence. Their prediction of a 2.4% annual increase matches our results. Meanwhile, in the study conducted by IHE [Citation7] projections were made of future treatment and productivity costs of cancer, based on incidence and prevalence and assuming constant treatment costs and treatment technology. The authors’ predictions for the annual growth of costs (2.4–3.0%) were higher than what we have observed (1.7%). In general, the growth observed in this study was less compared to the earlier studies. summarises the results of previous studies and compares them to the results of this study.
Table 2. Summary of cost trends in previous studies of cost of cancer and the results of this study.
The increase in the number of new patients is the essential driver behind the growth of real costs. However, due to the decreases in inpatient care costs and increments in productivity, the growth of total costs was slightly slower than the growth in the number of new patients. The conversions in the cost distribution across categories may reflect the improvements (evolution) in medical care. In secondary care, this manifests in the shift from costly inpatient provision to more cost-beneficial outpatient care, with the same scenario being slightly more visible in primary care.
We did not consider the cost of mortality, since the mortality-cost component of COI has been criticised on a number of different conceptual and methodological grounds [Citation12]. Luengo-Fernandez et al. [Citation1] also included informal care costs, which present with the same kind of uncertainties as the mortality costs. In their study, the estimated costs of mortality were 464 million € and, of informal care, 166 million € in Finland in 2009. Without these costs, the comparable costs were 881 million € in their study and 781 million € in ours. The difference is mainly related to inpatient care costs, for which more detailed data were available in our study.
The outcomes of cancer treatment have been compared between countries using survival rates as an outcome measure [Citation14–17]. In broader terms, the outcomes should also include the degree of health and recovery, disuse of the care or treatment process, sustainability of health or recovery and long-term consequences [Citation26]. However, broadening the scope and adding dimensions to the outcome measurement limit the comparability and access to data from different countries.
The outcomes of cancer care have improved: the relative 5-year survival ratio has been enhanced and age-adjusted mortality has decreased. Cancer care outcomes in Finland have been among the best in Europe [Citation15]. In addition, the number of new disability pensions and sick leave days has decreased, indicating that working-age survivors have better functional ability than previously. Our study was limited to register-based outcome measures, which included neither work-related disabilities nor patient-reported outcomes such as health-related quality of life. Since treatment methods are rapidly developing and changing in the cancer context, it is important to include the patient perspective when assessing the outcomes per cost in future research. However, considering the changes in outcome measures and, at the same time, relatively moderate growth of costs, combined with a decrease in cost per new patient, suggests that the health system’s level of cost-effectiveness has been improving.
This is the first survey to analyse the change in the actual cancer costs within a 10 year period and to extrapolate the results to the outcome of the treatment on population level. Studies are limited, where both outcomes and costs have been considered at the nation level over time. Since the cancer care outcomes in Finland has been among the best in Europe, the progress in the costs and the conversions in the cost distributions across categories are significant and valuable sources for the international comparisons.
Disclosure statement
No potential conflict of interest was reported by the authors.
Additional information
Funding
References
- Luengo-Fernandez R, Leal J, Gray A, et al. Economic burden of cancer across the European Union: a population-based cost analysis. Lancet Oncol. 2013;14:1165–1174.
- Ferlay J, Shin HR, Bray F, et al. Estimates of worldwide burden of cancer in 2008: GLOBOCAN 2008. Int J Cancer. 2010;127:2893–2917.
- Møller H, Fairley L, Coupland V, et al. The future burden of cancer in England: incidence and numbers of new patients in 2020. Br J Cancer. 2007;96:1484–1488.
- Jönsson B, Wilking N. The burden and cost of cancer. Ann Oncol. 2007;18:8–22.
- Sullivan R, Peppercorn J, Sikora K, et al. Delivering affordable cancer care in high-income countries. Lancet Oncol. 2011;12:933–980.
- Mariotto AB, Yabroff KR, Shao Y, et al. Projections of the cost of cancer care in the United States: 2010–2020. J Natl Cancer Inst. 2011;103:117–128.
- IHE – Institutet för Hälso- och Sjukvårdsekonomi. Kostnader för cancer I Sverige idag och år 2040. IHE Rapport; 2016, vol. 1. Available from: http://res.cloudinary.com/cancerfonden/image/upload/v1459776752/documents/ihe-rapport-2016.pdf
- Mäklin S, Rissanen P. Syöpien aiheuttamat kustannukset: Hoito- ja tuottavuuskustannusten kehitys vuosina 1996–2004 ja ennuste niiden muutoksista vuoteen 2015. Suomen Syöpäyhdistyksen Julkaisuja [Cost of cancer 1996–2014 and predictions for year 2015]. Cancer Soc Finland. 2006;67. Finnish.
- Tangka FK, Trogdon JG, Richardson LC, et al. Cancer treatment cost in the United States: has the burden shifted over time? Cancer. 2010;116:3477–3484.
- Bradley CJ, Yabroff KR, Dahman B, et al. Productivity costs of cancer mortality in the United States: 2000–2020. J Natl Cancer Inst. 2008;100:1763–1770.
- Warren JL, Yabroff KR, Meekins A, et al. Evaluation of trends in the cost of initial cancer treatment. J Natl Cancer Inst. 2008;100:888–897.
- Brown ML, Lipscomb J, Snyder C. The burden of illness of cancer: economic cost and quality of life. Annu Rev Public Health. 2001;22:91–113.
- Francisci S, Yabroff KR, Gigli A, et al. Advancing the science of cancer cost measurement: challenges and opportunities. Ann Ist Super Sanita. 2013;49:73–78.
- Allemani C, Weir HK, Carreira H, et al. Global surveillance of cancer survival 1995–2009: analysis of individual data for 25 676 887 patients from 279 population-based registries in 67 countries (CONCORD-2). Lancet. 2015;385:977–1010.
- De Angelis R, Sant M, Coleman MP, et al. Cancer survival in Europe 1999–2007 by country and age: results of EUROCARE-5—a population-based study. Lancet Oncol. 2014;15:23–34.
- Sankaranarayanan R, Swaminathan R, Brenner H, et al. Cancer survival in Africa, Asia, and Central America: a population-based study. Lancet Oncol. 2010;11:165–173.
- Coleman MP, Forman D, Bryant H, et al. Cancer survival in Australia, Canada, Denmark, Norway, Sweden, and the UK, 1995–2007 (the International Cancer Benchmarking Partnership): an analysis of population-based cancer registry data. Lancet. 2011;377:127–138.
- Torkki P, Leskelä RL, Rytkönen A, et al. Syövän hoidon kustannusten kehitys 2008–2013 Keski-Suomen sairaanhoitopiirissä [Cost of cancer treatment 2008–2013 in Central Finland Hospital District]. Duodecim. 2015;24:2367–2373. Finnish.
- NHS England. Programme Budgeting Aggregate PCT Expenditure for all programmes and subcategories for financial years 2003/04 to 2012/13. Available from: https://www.networks.nhs.uk/nhs-networks/health-investment-network/documents/Programme%20Budgeting%20Aggregate%20PCT%20figure%202003-04%20to%202012-13.xls
- Ministerie van Volksgezondheid, Welzijn en Sport. Cost of illness in the Netherlands; 2011. Available from: https://costofillnesstool.volksgezondheidenzorg.info/tool/english/
- Statistics Finland. Available from: http://www.stat.fi/index_en.html
- National Institute for Health and Welfare. Health expenditure and financing; 2014. Available from: http://www.julkari.fi/handle/10024/130783
- Venesmaa J. Organizing a maternity care service network [Licenciate thesis]. Espoo: Aalto University; 2011.
- Finnish Tax Administration. Available from: https://www.vero.fi/en-US
- World Health Organisation. International Classification of Diseases, 10th revision (ICD-10). Geneva: WHO.
- Porter ME. What is value in health care? N Engl J Med. 2010; 363:2477–2481.