
Abstract
Background: Tumour hypoxia is associated with increased radioresistance and poor response to radiotherapy. Pre-treatment assessment of tumour oxygenation could therefore give the possibility to tailor the treatment by calculating the required boost dose needed to overcome the increased radioresistance in hypoxic tumours. This study concerned the derivation of a non-linear conversion function between the uptake of the hypoxia-PET tracer 18F-HX4 and oxygen partial pressure (pO2).
Material and methods: Building on previous experience with FMISO including experimental data on tracer uptake and pO2, tracer-specific model parameters were derived for converting the normalised HX4-uptake at the optimal imaging time point to pO2. The conversion function was implemented in a Python-based computational platform utilising the scripting and the registration modules of the treatment planning system RayStation. Subsequently, the conversion function was applied to determine the pO2 in eight non-small-cell lung cancer (NSCLC) patients imaged with HX4-PET before the start of radiotherapy. Automatic segmentation of hypoxic target volumes (HTVs) was then performed using thresholds around 10 mmHg. The HTVs were compared to sub-volumes segmented based on a tumour-to-blood ratio (TBR) of 1.4 using the aortic arch as the reference oxygenated region. The boost dose required to achieve 95% local control was then calculated based on the calibrated levels of hypoxia, assuming inter-fraction reoxygenation due to changes in acute hypoxia but no overall improvement of the oxygenation status.
Results: Using the developed conversion tool, HTVs could be obtained using pO2 a threshold of 10 mmHg which were in agreement with the TBR segmentation. The dose levels required to the HTVs to achieve local control were feasible, being around 70–80 Gy in 24 fractions.
Conclusions: Non-linear conversion of tracer uptake to pO2 in NSCLC imaged with HX4-PET allows a quantitative determination of the dose-boost needed to achieve a high probability of local control.
Introduction
Tumour hypoxia is well-known as one of the most important microenvironmental factors with respect to radiosensitivity [Citation1]. It has consequently been suggested that pretreatment assessment of tumour oxygenation could improve treatment outcome by targeting the radioresistant regions [Citation2]. This could in theory be achieved by acquiring pretreatment positron emission tomography (PET) images using hypoxia-specific tracers. Such functional imaging could then be used for the purpose of dose-painting, in which sub-volumes in the tumour believed to be more radioresistant are given an escalated dose compared to the rest of the target [Citation3,Citation4]. However, functional imaging could offer more information of relevance than for target definition alone. Thus, if the tumour oxygenation could be quantified based on PET imaging, the dose required to overcome the increased radioresistance in the hypoxic sub-volumes could be calculated, as opposed to empirically escalating the dose within the constraints of normal tissue toxicity [Citation3].
Several PET tracers are currently available for imaging tumour hypoxia, the most used one in the clinic being 18F-FMISO [Citation5]. Alternatives to 18F-FMISO have however been tested, including 18F-HX4 [Citation6], which was proposed to overcome the slow clearance kinetics of 18F-FMISO and was investigated both in preclinical and clinical studies [Citation6–11]. Both these tracers belong to the nitromidazole family, and therefore it is expected that they have similar mechanisms for binding to hypoxic cells. Nevertheless, the relationship between the relative uptake of each tracer and the oxygen partial pressure depends on the chemical composition of the tracer and the biochemical processes through which they bind to the hypoxic cells. This relationship has been the concern for studies investigating the opportunity of targeting hypoxia based on imaging with hypoxic tracers. The relationship for FMISO and FETA has been investigated a few years back [Citation12], but several other tracers have since appeared. A recent study has investigated the general shape of the relationship for F-HX4, but without determining the parameters of the relationship [Citation13].
The aim of this study was therefore to investigate the relationship between the uptake (at the time of optimal imaging with respect to the tracer injection) and oxygen partial pressure (pO2) for the hypoxia tracer 18F-HX4, and to derive the parameters of the mathematical function describing this relationship based on previously performed measurements of nitroimidazole uptake and pO2 [Citation12]. In addition, the automatic segmentation of the hypoxic target based on the conversion of the 18F-HX4 uptake to pO2 was explored. The feasibility of using the pO2 maps derived based on 18F-HX4 PET images for dose-painting was also investigated by calculating the doses to be prescribed for overcoming the hypoxic radioresistance for a group of non-small-cell lung cancer (NSCLC) patients.
Material and methods
Conversion function and derivation of its parameters
A model for converting 18F-FMISO uptake into oxygen partial pressure (pO2) was previously proposed by Toma-Dasu et al. [Citation3,Citation12], assuming a sigmoidal relationship between normalised tracer uptake and pO2. The expression for the sigmoidal function is presented in EquationEquation (1)(1) and was chosen to describe the inhibition of a chemical reaction. This is in line with the uptake mechanism of nitroimidazole, which enters a cell through diffusion and undergoes a first reduction to a potentially reactive species. In the presence of oxygen, the reaction is reversed by reoxidation and the tracer molecule can exit the cell. For low concentrations of oxygen, however, further reduction takes place that leads to the association of the reduced nitroimidazole to intracellular components, effectively trapping the tracer in the hypoxic cell [Citation14]. The selective uptake of nitroimidazoles in hypoxic cells can thus be described as an inhibition of the reoxidation of the tracer molecule. Thus, parameter A in EquationEquation (1)
(1) is related to the speed of the reaction in the absence of the inhibitor (i.e., molecular oxygen), while parameters B and C describe the effect of the inhibition.
(1)
Numerical values have been reported for the parameters A, B and C for 18F-FMISO in particular [Citation12], but the general mathematical expression in EquationEquation (1)(1) would be applicable to any other tracer that is chemically similar to 18F-FMISO with respect to the uptake mechanism. It should be noted that the accumulation of a hypoxic tracer in tumours is seldom given in absolute units, but as accumulation of activity or standardised uptake value (SUV) of the injected tracer and it is usually expressed as tumour to muscle ratio (TMR) after normalising the uptake to that in muscle or a major vessel as a substitute reference with good oxygenation. Hypoxic volumes are then defined in practice using a suitable threshold for the TMR.
18F-HX4 and 18F-FMISO are both 2-nitroimidazole compounds, and therefore the chemical process through which the tracers are metabolised in a cell should be the same, as described by the reduction and oxygen-dependent subsequent reoxidation of the R-NO2 molecule [Citation14]. Consequently, the general expression in EquationEquation (1)(1) describing the normalised tracer uptake as a function of pO2 in the cell should therefore be as applicable to 18F-HX4, as it is to 18F-FMISO. Furthermore, the asymptotic behaviour of the conversion functions should be the same for the two tracers. Since the formation of the radical anion R-NO2−* cannot be reversed in the absence of oxygen, the conversion function for 18F-FMISO and that for 18F-HX4 should result in the same value as the pO2 approaches zero and the uptake in EquationEquation (1)
(1) approaches A. Consequently, the parameter A was assumed to be the same for both tracers. On the other extreme, for very high values of pO2 corresponding to normoxic tissues, EquationEquation (1)
(1) can be simplified to Uptake ≈ A − B under the assumption that pO2 ≫ C, which must also be the same for both tracers. With A and A − B fixed, B is also fixed and the only parameter left to be determined for 18F-HX4 is C.
In EquationEquation (1)(1) , the normalised uptake is defined as:
(2)
where SUVref is the standardised uptake value (SUV) in the well-oxygenated reference region and:
(3)
with pO2(ref) being the oxygen partial pressure in the well-oxygenated reference region.
In the recent study by Lindblom et al. [Citation13], the conversion function in EquationEquation (1)(1) was able to identify hypoxic target volumes (HTVs) of similar shape, size and location as the volumes based on the segmentation method used in the current practice in which a threshold of 1.4 relative to the average SUV in the well-oxygenated reference region is employed. Therefore, assuming pO2(ref)=60 mmHg as in a well-oxygenated tissue, the final parameter for 18F-HX4 can be found by solving:
(4)
for C given that A = 10.9 and B = 10.7 as for 18F-FMISO [Citation12].
Application of the conversion function on NSCLC patient data
The conversion function in EquationEquation (1)(1) with the set of parameters derived for 18F-HX4 was applied on the imaging data of eight non-small-cell lung cancer (NSCLC) patients who have been imaged with 18F-HX4-PET before the start of radiotherapy. Images were acquired four hours after the injection of the tracer in line with pre-clinical [Citation6] and clinical [Citation10] findings of the optimal time point for imaging with respect to the contrast. Further details of the imaging protocol can be found in a previous publication by Even et al. [Citation11].
The construction of the three-dimensional pO2 maps using the new parameters was done for each patient using a scripting module implemented in a research version of RayStation v4.6.100.4. Given the unknown ability of the new conversion function to correctly identify HTVs with respect to both their geometry and level of pO2, a range of pO2 values around 10 mmHg (8–12 mmHg) were considered for the purpose of pO2-based segmentation. These volumes were then compared with uptake-based volumes segmented by considering an uptake threshold of 1.4 relative to a well-oxygenated reference region, representative of the current clinical practice for segmentation in hypoxia-PET images. The well-oxygenated reference region used for the uptake-based segmentation as well as for the conversion to pO2 was the aortic arch, which was delineated by an experienced clinical oncologist. All thresholding and segmentation was performed in RayStation, and only volumes confined to the CTV were considered relevant for the delineation of the HTV.
The HTVs based on the uptake and those based on the conversion to pO2 were compared by calculating the ratio of the intersection and the union of the HTVuptake ≥ 1.4 and the HTVpO2 for a range of pO2 values used for thresholding. The calculations were performed in MATLAB R2016b.
Calculation of boost doses
Using the conversion function of the tracer uptake to pO2 would allow not only the identification of sub-target volumes, but also the subsequent calculation of the boost dose required in order to reach a desired level of tumour control probability [Citation15]. Thus, the HTV for the pO2 threshold resulting in the highest overlap fraction was then used as a target volume for dose-painting, and the uniform boost dose required to achieve 95% tumour control probability was calculated as described by Toma-Dasu et al. [Citation15,Citation16]. According to the model proposed by Toma-Dasu et al., the dose to a voxel at the position r in the target that would ensure a given level of tumour control probability (P) when delivered in n fractions could be calculated as:
(5)
where α(r) and β(r) are parameters describing the cellular radiosensitivity assuming the linear quadratic (LQ) model for cell killing, and ρ is the clonogen density within the target volume V. The α(r) and β(r) parameters depend on the pO2 as suggested in several other publications [Citation12,Citation15]. If the inter-fraction reoxygenation resulting from the fluctuations in acute hypoxia that can be expected to take place between fractions [Citation17] is taken into account, the heterogeneous dose distribution resulting from applying EquationEquation (5)(5) , could be converted into a homogeneous dose boost to the HTV which could counteract the effects of dose and radioresistance heterogeneity [Citation12,Citation15]:
(6)
where D¯ and σD are respectively the average and standard deviation of the heterogeneous dose distribution resulting from applying EquationEquation (5)(5) and γ is the slope of the dose response curve. The following generic parameters were used for calculations: α = 0.35 Gy−1, α/β = 10 Gy, ρ = 109 cm−3, γ = 4 [Citation18,Citation19]. For the purpose of comparison with the results of Even et al. [Citation11], n = 24 fractions was used for the dose calculation, and a uniform density of clonogenic cells was assumed.
Results
Conversion function and derivation of its parameters
Solving EquationEquation (4)(4) leads to two solutions for the C parameter, C = 111.5 mmHg and C = 0.1 mmHg. The larger C value does not fulfil the condition of C ≪ pO2 for high oxygen partial pressures corresponding to normoxia. Furthermore, using this C value will predict a normalised uptake in hypoxic tissues that is at maximum 1.5 times higher than the uptake in the reference region, providing little contrast between hypoxia and normoxia. Hence, using this value for the parameter C will not allow the practical identification of HTVs and C = 111.5 mmHg was discarded. The smaller value of 0.1 mmHg however fulfils C ≪ pO2 and results in a favourable discrimination between uptake values corresponding to hypoxia and normoxia. An illustration of the relationship between the tracer uptake and pO2 described by EquationEquation (1)
(1) using the lower value of the solution for the C parameter (0.1 mmHg) is shown in .
Figure 1. Relationship between tracer uptake and tissue oxygenation for HX4 (green, lower curve), compared with the previously proposed corresponding relationship for FMISO [Citation12] (blue, upper curve).
![Figure 1. Relationship between tracer uptake and tissue oxygenation for HX4 (green, lower curve), compared with the previously proposed corresponding relationship for FMISO [Citation12] (blue, upper curve).](/cms/asset/76cf9823-7309-4464-9e8c-ff7d88acb21b/ionc_a_1400177_f0001_c.jpg)
The smaller C = 0.1 mmHg was hence considered for the conversion of normalised 18F-HX-PET uptake in the patient cohort included in this study.
Application of the conversion function on NSCLC patient data
The parameter set tested on the imaging data of the eight NSCLC patients was thus (A, B, C) = (10.9, 10.7, 0.1 mmHg). With these parameters, HTVs that were in good agreement with target volumes based on an uptake ratio of 1.4 to a well-oxygenated reference region could be identified, with the highest overlap for a threshold of 10 mmHg for all patients ().
Table 1. The relative overlap between hypoxic target volumes based on relative uptake (HTVuptake≥1.4) and on the conversion to oxygen partial pressure (HTVpO2). Numbers in bold refer to the maximum relative overlap found in each patient.
This indicates that by using the conversion function for 18F-HX4 proposed in this paper, HTVs with geometric properties that are almost identical to those of the uptake-derived boost volumes could be defined, as illustrated for patient 3 in . In addition, this method provides a quantification of the pO2 levels within the HTV (), which is crucial for the estimation of the boost dose required in hypoxia-based dose-painting.
Figure 2. 18F-HX4-PET uptake (left) in patient 3, and the oxygen partial pressure map resulting from the conversion function (middle) with the CTV, shown in red. To the right, the GTV is also shown in orange, containing the HTVpO2 (green) obtained with a threshold of 10 mmHg and the HTVuptake (blue). The figure appears in color in the online version of the article.
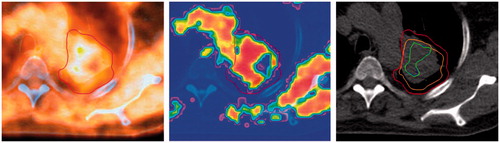
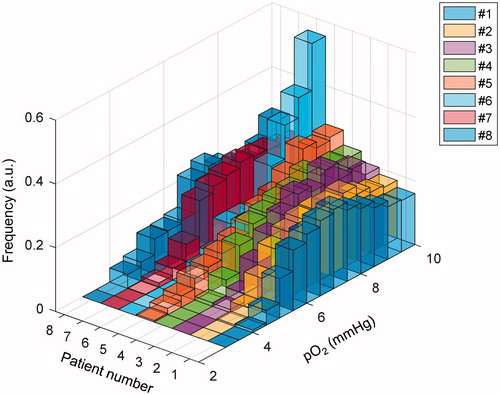
Figure 3. Histograms of the oxygen partial pressure (pO2) in the hypoxic target volumes for all eight patients.
Calculation of boost doses
For the HTVs resulting in the highest relative overlap with the uptake-based volumes, the uniform boost doses in 24 fractions calculated for a level of 95% tumour control probability are displayed in , assuming a uniform clonogen density.
Table 2. The uniform prescribed boost dose in 24 fractions calculated for a tumor control probability (TCP) of 95% according to Toma-Dasu et al. for the HTVs segmented using a threshold of 10 mmHg [Citation15,Citation16].
For all patients, the uniform prescription doses can be regarded as clinically relevant with respect to the feasibility study on dose escalation by Even et al. [Citation11], which was based on the same patient cohort as considered in the present work.
Discussion
In this study, a novel non-linear conversion function between normalised 18F-HX4 uptake and oxygen partial pressure has been proposed. This function was derived independently from the patient data on which it was subsequently applied to identify HTVs for dose-painting.
The underlying assumption was that the same mathematical expression was valid for 18F-HX4 as for 18F-FMISO and was based on the fact that both tracers are 2-nitroimidazoles and hence the molecule (R-NO2) involved in the chemical reaction leading (or not) to the retention is the same [Citation14]. Previous studies have reported similar uptake patterns for 18F-HX4 and 18F-FMISO, supporting the assumption that the two tracers are metabolised in a similar way [Citation6,Citation20]. The hypoxic threshold is often referred to as oxygen partial pressure levels between 2.5 mmHg and 10 mmHg [Citation23]. In the present study, 10 mmHg was assumed to correspond to an uptake ratio of 1.4 between the SUV in the hypoxic volume and the well-oxygenated reference region. The HTVs resulting from the conversion of normalised uptake to pO2 with highest relative overlap with the uptake-based volumes were all found for a threshold of 10 mmHg. For all patients, the relative overlap with the uptake-based volumes was 96% or higher. The good agreement between the uptake-based volumes and the predicted threshold for defining the HTV based on pO2 suggests that the assumptions behind the derivation of the relationship between HX4 and pO2 is reasonable and therefore further clinical validation is warranted.
The advantage of using a segmentation method based on the conversion of the tracer uptake to pO2 instead of the simple one based on a given threshold for the ratio of the uptake in the tumour and in the well-oxygenated reference region lays beyond the definition of the target. Thus, the resulting pO2 distribution and the related radiation sensitivity or resistance could be used for calculating the dose boost needed to be prescribed and subsequently delivered to achieve a certain level of control as reported in . It should be noted that the underlying assumption in this study has been that the clonogen density was the same in all voxels of the target volume, in line with the earlier proposal on the topic [Citation15]. This however might not be the case in all clinical tumours and additional information would be required on clonogen distribution in the tumour. In principle, such information could be obtained with either FDG-PET [Citation21] or with DW-MRI [Citation22]. It should be mentioned however that analysing the impact of the heterogeneous distribution of the clonogenic cell density is beyond the scope of this paper as the simultaneous use of information from multiple imaging modalities is not straightforward [Citation2] and therefore it is planned to be investigated in a future study.
As previously mentioned, the clinical application of this model, as that of any other model, has to be preceded by validation against clinical outcome, once it will become available. One approach could be by predicting the local recurrence or local control based on the comparison between the delivered dose distribution to the patients presenting hypoxic targets and the calculated dose to be delivered in order to achieve a high tumour control probability.
Concluding, the present study presented a conversion function between 18F-HX4-PET uptake and partial oxygen pressure that could be used for the automatic identification of HTVs. In addition, it was shown that the conversion function allows the quantification of the oxygen partial pressure in these volumes, which could subsequently be used for the purpose of hypoxia dose-painting based on 18F-HX4-PET imaging following the validation of the model against the clinical outcome.
Disclosure statement
No potential conflict of interest was reported by the author.
Additional information
Funding
Related Research Data
References
- Overgaard J. Hypoxic radiosensitization: adored and ignored. J Clin Oncol. 2007;25:4066–4074.
- Toma-Dasu I, Dasu A. Towards multidimensional radiotherapy: key challenges for treatment individualisation. Comput Math Methods Med. 2015;2015:934380.
- Toma-Dasu I, Dasu A, Brahme A. Quantifying tumour hypoxia by PET imaging—a theoretical analysis. Adv Exp Med Biol. 2009;645:267–272.
- Bentzen SM, Gregoire V. Molecular imaging-based dose painting: a novel paradigm for radiation therapy prescription. Semin Radiat Oncol. 2011;21:101–110.
- Rajendran JG, Krohn KA. F-18 fluoromisonidazole for imaging tumor hypoxia: imaging the microenvironment for personalized cancer therapy. Semin Nucl Med. 2015;45:151–162.
- Dubois LJ, Lieuwes NG, Janssen MH, et al. Preclinical evaluation and validation of [18F]HX4, a promising hypoxia marker for PET imaging. Proc Natl Acad Sci USA. 2011;108:14620–14625.
- van Loon J, Janssen MH, Ollers M, et al. PET imaging of hypoxia using [18F]HX4: a phase I trial. Eur J Nucl Med Mol Imaging. 2010;37:1663–1668.
- Zegers CM, van Elmpt W, Reymen B, et al. In vivo quantification of hypoxic and metabolic status of NSCLC tumours using [18F]HX4 and[18F]FDG-PET/CT imaging. Clin Cancer Res. 2014;20:6389–6397.
- Peeters SG, Zegers CM, Lieuwes NG, et al. A comparative study of the hypoxia PET tracers [18F]HX4, [18F]FAZA, and [18F]FMISO in a preclinical tumor model. Int J Radiat Oncol Biol Phys. 2015;91:351–359.
- Zegers CM, van Elmpt W, Wierts R, et al. Hypoxia imaging with [18F]HX4 PET in NSCLC patients: defining optimal imaging parameters. Radiother Oncol. 2013;109:58–64.
- Even AJ, van der Stoep J, Zegers CM, et al. PET-based dose painting in non-small cell lung cancer: comparing uniform dose escalation with boosting hypoxic and metabolically active sub-volumes. Radiother Oncol. 2015;116:281.
- Toma-Dasu I, Uhrdin J, Dasu A, et al. Therapy optimization based on non-linear uptake of PET tracers versus ‘linear dose painting’. IFMBE Proc. 2009;25:221–224.
- Lindblom E, Dasu A, Uhrdin J, et al. Defining the hypoxic target volume based on positron emission tomography for image guided radiotherapy—the influence of the choice of the reference region and conversion function. Acta Oncol. 2017;56:819–825.
- Nunn A, Linder K, Strauss HW. Nitroimidazoles and imaging hypoxia. Eur J Nucl Med. 1995;22:265–280.
- Toma-Dasu I, Dasu A, Brahme A. Dose prescription and optimisation based on tumour hypoxia. Acta Oncol. 2009;48:1181–1192.
- Toma-Dasu I, Uhrdin J, Antonovic L, et al. Dose prescription and treatment planning based on FMISO-PET hypoxia. Acta Oncol. 2012;51:222–230.
- Ljungkvist AS, Bussink J, Kaanders JH, et al. Dynamics of hypoxia, proliferation and apoptosis after irradiation in a murine tumor model. Radiat Res. 2006;165:326–336.
- Brahme A. Dosimetric precision requirements in radiation therapy. Acta Radiol Oncol. 1984;23:379–391.
- Partridge M, Ramos M, Sardaro A, et al. Dose escalation for non-small cell lung cancer: analysis and modelling of published literature. Radiother Oncol. 2011;99:6–11.
- Wack LJ, Monnich D, van Elmpt W, et al. Comparison of [18F]-FMISO, [18F]-FAZA and [18F]-HX4 for PET imaging of hypoxia—a simulation study. Acta Oncol. 2015;54:1370–1377.
- Meijer G, Steenhuijsen J, Bal M, et al. Dose painting by contours versus dose painting by numbers for stage II/III lung cancer: practical implications of using a broad or sharp brush. Radiother Oncol. 2011;100:396–401.
- Thoeny HC, Ross BD. Predicting and monitoring cancer treatment response with diffusion-weighted MRI. J Magn Reson Imaging. 2010;32:2–16.
- Höckel M, Vaupel P. Tumor hypoxia: definitions and current clinical, biologic, and molecular aspects. J Natl Cancer Inst. 2001;93:266–276.