
Abstract
Background: Colorectal cancer (CRC) is one of the most common causes of cancer-related deaths worldwide. Increased expression of the molecular target, EphB4 receptor, has been observed in several cancer types. However, studies on the role of EphB4 receptor in CRC have yielded contradictory results. The aim of this study was to investigate the influence of EphB4 expression levels on CRC cell behavior and its contribution to tumor growth and vascularization.
Methods: SW480, LIM2405 and CT26 CRC cell lines were transfected with EphB4 expression vector. High EphB4 expressing cells were compared to low EphB4 expressing empty vector controls. Proliferation and migration assays as well as EphrinB2-Fc cell stimulations were conducted in vitro and subcutaneous xenografts of CRC were analyzed in vivo.
Results: High EphB4 expression enhanced migratory ability of these CRC cell lines in vitro and contributed to a significant increase in tumor growth and vascularization in vivo. Tumours induced with high EphB4 expressing SW480 and LIM2405 cells yielded homogenous masses densely packed with cancer cells. EphrinB2-Fc cell stimulations induced cell clustering of high EphB4 expressing SW480 and LIM2405 in vitro.
Conclusion: These results suggest that with enhanced vascularization and an increase in migratory abilities, the high EphB4 expressing cells may be able to metastasize more readily.
Introduction
Colorectal cancer (CRC) is one of the leading causes of cancer related mortality worldwide with over one million cases diagnosed annually [Citation1]. Surgical intervention to resect the primary tumor is the main treatment strategy for CRC [Citation2]. However, due to the asymptomatic nature of CRC, a large proportion of cases are not diagnosed until the cancer has spread to regional lymph nodes and the liver. Metastatic spread of cancer decreases survival and is the leading cause of patient mortality. With the introduction of cancer screening tests there has been an improvement in early detection and long-term patient survival [Citation3]. However, there is still a need for more effective treatment modalities as high recurrence rates are observed in CRC [Citation2,Citation3]. To increase the effectiveness and specificity of CRC treatment, identification of molecular targets is widely advocated. Some success with such therapies has been seen in CRC particularly with the use of antibodies targeting the vascular endothelial factor and epidermal growth factor receptors [Citation4]. Another group of possible molecular targets for anticancer therapy is the erythropoietin-producing hepatoma (Eph) family of receptor tyrosine kinases and their corresponding ‘Eph receptor interacting’ (Ephrin) ligands. Eph receptors constitute the largest family of receptor tyrosine kinases [Citation5,Citation6]. They comprise of A and B types that interact with and are activated by a similar subclass of their cell-bound Ephrin ligands. Eph and Ephrin interactions lead to bidirectional signaling, where both the cell carrying the receptor and the cell carrying the ligand can be activated [Citation7,Citation8]. A primary role of Ephs and Ephrins is to control and regulate cellular mobility and migration. For this reason, their involvements in the metastatic progression of cancers have been widely investigated. Some members, like the EphA2 receptor, are overexpressed in breast, liver and prostate cancers and are associated with enhanced malignancy and poor prognosis [Citation9]. However, it is evident that the role of these receptors may vary depending on tumor type and origin. In the colonic crypts EphB2 and EphB3 receptors regulate positioning and compartmentalization of different cell subtypes [Citation8,Citation10,Citation11]. For this reason, it appears that Eph receptor expression influences CRC tumors differently than tumors of other origins. As an example, the EphB2 receptor expressed in cervical cancers promotes epithelial to mesenchymal transition through interaction with R-Ras protein enhancing cellular migration, therefore, leading to cancer progression [Citation12,Citation13]. However, in CRC EphB2 receptor has been well documented as a tumor suppressor. It restricts CRC tumor growth and spread into surrounding tissue through Ephrin ligand interaction [Citation14,Citation15]. Similarly, EphB3 receptor expression is upregulated in late and metastatic stages of lung cancer and has been shown to enhance tumor growth in a kinase dependent manner [Citation16]. Whereas in CRC, when stimulated by EphrinB ligands, EphB3 expressing CRC cells aggregate and adhere together leading to tumor restriction and compartmentalization [Citation15,Citation17]. The EphB4 receptor and its corresponding ligand EphrinB2 are overexpressed in a number of cancers making it a possible therapeutic target [Citation18–23]. Studies on the role of EphB4 in CRC have given contradictory results. It has been reported that high EphB4 expression enhances migratory abilities in CRC cells, leading to increase rate of metastasis [Citation24]. While in opposing findings, it has been stated that EphB4 expression in CRC may restrict tumor expansion and dissemination [Citation25,Citation26].
Further conflicting data exist regarding the implications of EphB4 receptor expression on CRC cells and disease progression. A key aspect of cancer progression is the ability of a tumor to undergo vascularization in order to support continuous growth. Ultimately the cancer cells then use these blood vessels as portals into the systemic circulation and other organs in the body. The EphB4 receptor along with its ligand EphrinB2 regulates vascularization and angiogenesis in tissues [Citation27]. Inhibition of EphB4 receptor signaling was shown to arrest endothelial cell migration, vessel formation and branching suggesting it could be used as a part of anti-angiogenic therapy [Citation24,Citation27–29]. However, in other studies EphB4 expression was found not to cause significant changes in tumor vasculature [Citation26,Citation30]. These studies demonstrate that the silencing of EphB4 expression and signaling leads to an increase in mitogenic and vascular growth factors, as well as extracellular matrix remodeling molecules in tumor tissues. Hence, EphB4 expression is thought to suppress the colonogenic potential of CRC cells by influencing the constituents of the tumor microenvironment [Citation26,Citation30].
In this study we have used the SW480 and LIM2405 human and the CT26 mouse CRC cell lines which expresses low endogenous levels of EphB4. By stable upregulation of EphB4 expression, we studied the proliferative aptitude and migrational abilities of CRC cells in vitro. In in vivo experiments, we have utilized a subcutaneous model to study the effects of high and low EphB4 expression on tumor growth, vascularization and composition.
Materials and methods
Standard tissue culture
SW480, LIM2405 and CT26 cells were routinely cultured in Roswell Park Memorial Institute-1640 medium (Sigma-Aldrich) supplemented with 10% fetal-calf serum (Thermo Scientific), 200 mM L-Glutamine, 1M HEPES, 100 mM Sodium Pyruvate, 10 000 units/ml penicillin, 10 mg/ml streptomycin, 25 µg/ml amphotericin B. Cells were then maintained under standard culture conditions in 5% carbon dioxide infused incubators at 37 °C.
Modification of CRC cell line
The SW480, LIM2405 and CT26 cells were transfected with pMono-neo-mcs vector systems (InvivoGen) as vector only without a gene insert or as vector containing full-length cDNA corresponding exactly to the published sequence (NM-0044444) of EphB4 (pMono-EphB4). The cells (1 × 10⁶) were transfected in electroporation buffer (BioRad) using the Gene Pulser MXcell electroporation system (Bio-Rad) at 300 V, 200 µF and 1000 Ω. At 48 h after transfection, cellular selection with G418 commenced and was maintained throughout experimental period (Geneticin, Thermo Scientific). Protein was extracted from these cells at frequent intervals and analyzed using Western blotting to ensure consistent levels of EphB4 during experiments.
Western blot analysis
Protein was extracted from cultured cells using RIPA lysis buffer and the protein concentration was determined by Bicinchoninic acid assay kit (Thermo Scientific). Protein samples were loaded as 12 µg/lane onto mini-Protean Tris–Glycine Extended (4–20%) stain free precast gel (Bio-Rad). Gels were run at 200 V and transferred to a Polyvinylidene fluoride membrane (Bio-Rad). Efficiency of transfer was assessed by Gel-Doc EZ (Bio-Rad). The anti-EphB4 rabbit polyclonal antibody (H-200, dilution of 1:1000) (sc-5536, Santa Cruz Biotechnology) was used to detect bands as a primary antibody. The goat anti-rabbit IgG (Horse Radish Peroxidase conjugated, dilution of 1:1000) (ab97080, Abcam) was used as a secondary antibody. The staining was visualized by chemiluminescent imaging using the Immun-Star WesternC Kit (Bio-Rad). Quantitation was performed using ImageLab 4.1 software (Bio-Rad). Gapdh loading controls (ab9485, Abcam) were used to normalize EphB4 expression.
Proliferation assay
Cells were seeded into 96 well microplates (1 × 10⁴/100 µL/well) and incubated under standard conditions. Water soluble tetrazolium (WST-1) (Roche Applied Science) was added to a set of three wells for each cell line, once a day for 4 days and incubated at standard conditions for one hour. The absorbance was read using medium plus WST-1 as the blank on a VarioSkan spectrophotometer at 440 nm (optimal absorbance wavelength of the dye) and again at 690 nm (outside the absorbance wavelength of the dye) to compensate for well-well variability. Mean values were calculated for each cellular construct/day using Graphpad Prism 6 software statistical analysis conducted using two-way ANOVA and plotted as mean.
Boyden chamber migration assay
Cells were treated with serum-free medium (SFM) for 24 h. Complete culture medium (0.6 mL) with 10% fetal calf serum (which acts as a chemo-attractant) was added to each well. In addition, for each cell line one well with 0.6 mL of SFM was set up in order to take into account random migrations. Cell suspension (1 × 10⁵ cells/200 µL) was added into each of four TransWell chambers (Corning, 8 µm pore-size). Plates were left to incubate overnight at standard culture conditions. The plates and the TransWells were then trypsinised and cell counted using the Neubauer hemocytometer. The results were graphed as mean ± standard deviations for each cellular construct using Graphpad Prism 6 software. Unpaired t-test and non-parametric tests were used to analyze data.
X-celligance migration assay
Cells were treated with SFM for 24 h. Ordinary medium (165 µL) containing 10% fetal calf serum as a chemoattractant was added to the wells and 50 µL of SFM added to the upper chamber in a CIM-plate 16 (ACEA Biosciences, Inc.). Then a final concentration of 2.5 × 10⁴ cells/well was suspended in 100 µL SFM and set up in triplicates/cellular construct in the upper chamber of CIM-plate 16 plates. After allowing 30 min for the cells to adhere to the electrodes, the plates were then placed in a Real-Time Cell Analyser System (ACEA Biosciences, Inc.) at standard culture conditions. Electrode impedance measurements were taken every hour for a total duration of 70 h for SW480 cells and 24 h for LIM2405 and CT26 cells, using the Real-Time Cell Analyser software 1.2.1. The electrode impedance measured as ‘cell index’ was plotted as mean for each cellular construct and then analyzed for significance using Graphpad Prism 6 software. Paired t-test and non-parametric tests were used to analyze data.
Stimulation of cells with EphrinB2-fc
EphrinB2-Fc (1.5 µg/mL) was clustered with anti-human IgG (0.75 µg/mL) in media at 37 °C for 15 min. Culture medium was then removed from the cells, clustered EphrinB2-Fc was added and cells were stimulated for 15 minutes. Morphology images were taken on the Nikon IX53 microscope before and after stimulation at the same position within the wells. In order to minimize the effect of having cells out of the incubator at room temperature, the experiments were conducted on one well at a time.
Subcutaneous xenografts
All in vivo experiments were performed according to the National Health and Medical Research Council Code of conduct on the care and use of laboratory animals for scientific purposes and approved by the Victoria University Animal Experimentation Ethics Committee (Animal Ethic Numbers 04/12 and 14/001).
Female NOD CB17-prkdc-scid/JAsmu mice (5–6 weeks of age, 15-20g weight) were obtained from Monash Animal Services, Victoria, Australia or Animal Resources Centre, Western Australia. Animals were kept under a normal light and dark cycle with bedding, enrichment, free access to standard chow diet and water. The animals were acclimatized for a minimum of 3 days prior to experiment.
SW480 and LIM2405 cells, approximately 80% confluent, were washed with Dulbecco’s Phosphate Buffered Saline (DPBS), trypsinised and resuspended in Matrigel (Falcon) at 4 °C at a concentration of 2 × 10⁷/mL. Mice were briefly restrained by scruffing and injected in the right flank with 1 × 10⁶ cells in 50 µL Matrigel. Groups of 5 animals in total were used for each of the different SW480 and LIM2405 constructs (EV, B4). Tumour growth was monitored and measured with calipers every day until the experimental time limit of 40 days. Tumours were harvested when they reached 1cm (n = 5 animals/cell construct) in diameter.
Tissue processing
Harvested tissues were divided into three parts to be fresh frozen, paraffin embedded and snap frozen for protein extraction. Samples for cryosectioning were frozen in molds containing 100% Optimum Cutting Temperature compound (OCT Sakura, Tissue-Tek) slowly in 2-methyl-butane over liquid nitrogen then stored at –80 °C. Tumour samples for paraffin embedding were placed in fresh 4% paraformaldehyde in DPBS for ∼24 h then transferred to 30% sucrose in DPBS prior to embedding.
Immunohistochemistry
Human cancer cell labeling
Fresh frozen sections were cut using cryostat (Zeiss) at a thickness of 5 µm onto saline coated slides then placed into fresh 4% paraformaldehyde solution for 10 min fixation and rinsed in 1 × x DPBS. Endogenous peroxidase was blocked with a 3% peroxide incubation for 30 min. Vector Laboratories ‘mouse on mouse’ (MOM) kit (PK-2200) was used according to manufacturer’s instructions. Primary anti-nuclei monoclonal antibody (MAB1281, Millipore) at a 1:500 dilution was applied to sections at room temperature for 2 h. The secondary antibody containing MOM biotinylated anti-mouse IgG reagent (Vector Laboratories) was used along with Vectastain ABC reagent (Vector Laboratories) and 3-3′-diaminobenzidine (DAB) chromogen reagent (SK-4100, Vector Laboratories) as per manufacturer’s instructions. The sections were counterstained with Harris Haematoxylin (Richard Allan Scientific). The slides were then mounted using Clearmount (Life Technologies) which was applied directly onto the tissue and incubated for 30 minutes at 50 °C. Images were taken on Olympus DP72 microscope.
Endothelial cell labeling
Paraffin embedded tissues were sectioned at a thickness of 3.5 µm onto saline-treated slides and rehydrated through xylene (2 × 10 minutes) and serial alcohol dilution washes (2 × 100% for 5 min, 70% 5 min, 30% 5 min) then in DPBS. For antigen retrieval, sections were incubated in 20µg/mL Proteinase K solution at 37 °C for 20 min then allowed to cool at room temperature for 10 minutes before being washed twice with DPBS. Endogenous peroxidase was blocked with a 3% peroxide incubation for 30 min. A blocking buffer (1% bovine serum albumin (BSA), 0.1% cold fish skin gelatin, 0.5% Triton X-100, 0.05% sodium azide) was applied to sections for 1 hour room temperature and washed with DPBS. The anti-von Willebrand factor rabbit polyclonal antibody (ab6994, Abcam) was then applied at a dilution of 1:100. Sections were incubated at 4 °C overnight then washed using DPBS. The secondary anti-rabbit antibody (ab97080, Abcam) was applied at a dilution of 1:500 for 1 h. Probing was visualized and sections were mounted as above.
Four images per tumor were taken at 20x magnification on Olympus BH53 microscope. Blood vessels were counted using stereological grid count technique with the ImageJ program. Grid type was horizontal lines, area 6000 pixels2 at a 2-cm alignment and vessels intercepting the grid at any given point marked with a dot. Results were analyzed using Graphpad Prism 6 software and presented as mean ± standard deviations. Unpaired t-tests were used to analyze data.
Haematoxylin and eosin staining
Paraffin embedded tissues were sectioned at a thickness of 5 µm and mounted on slides which were then rehydrated as above and stained in Harris Haematoxylin (Richard Allan Scientific) and counterstained in 1% Eosin (Amber Scientific). The sections were dehydrated and cleared before being mounted using distyrene plasticizer and xylene. Images were taken on Olympus BH53 microscope.
Results
EphB4 expression in CRC cell lines
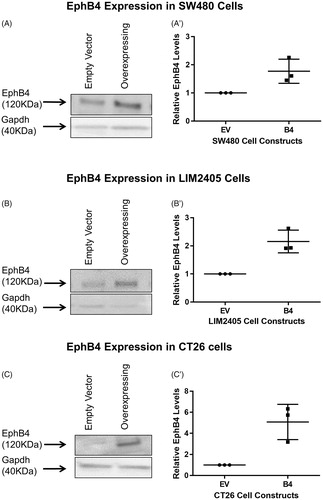
To investigate the functional consequence of EphB4 upregulation in SW480, LIM2405 and CT26 cells which inherently express low levels of EphB4, they were stably transfected with an expression vector system. The transfected cells were kept under constant selection. Western blot analysis done on biological triplicates of cell protein revealed that, after normalization to loading control, EphB4 expression in SW480 B4 cells is on average 1.7 times higher than the control Empty Vector (EV) cells (). The LIM2405 B4 cells overexpress the EphB4 protein by 2.2 times in comparison to EV cells (). Finally, the CT26 cells which inherently have very low level of endogenous EphB4 overexpress the protein in B4 cells by 5 times on average in comparison to EV cells ().
Figure 1. Western blot analysis of the EphB4 protein band at 120kD. (A) Protein harvested from SW480 constructs showing the EphB4 protein band and Gapdh loading control. (A’) Quantified EphB4 expression in SW480 EV and B4 cells (n = 3/cell construct), expression relative to EV cells and normalized to Gapdh loading control. (B) Protein harvested from LIM2405 constructs showing the EphB4 protein band and Gapdh loading control. (B’) Quantified EphB4 expression in LIM2405 EV and B4 cells (n = 3/cell construct), expression relative to EV and normalized to Gapdh loading control. (C) Protein harvested from CT26 cell constructs showing the EphB4 protein and Gapdh loading control. (C’) Quantified EphB4 expression in CT26 EV and B4 cells (n = 3/cell construct), expression relative to EV and normalized to Gapdh loading control.
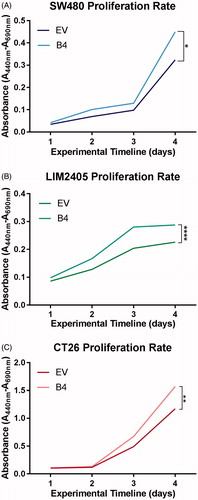
Effect of EphB4 expression on cancer cell proliferation
The effect of EphB4 expression was assessed using the colourimetric WST-1 assay on CRC cell lines (). At day 3, a trend in difference of proliferation rate can be observed between the EV and B4 constructs across all cell lines. At day 4 enhanced EphB4 expression was found to significantly increase cellular proliferation rates in the SW480 (EV = 0.32nm, B4 = 0.45nm, n = 3 in duplicates/cell construct, p < .05), LIM2405 (EV = 0.23nm, B4 = 0.29nm, n = 3 in duplicates/cell construct p < .0001) and CT26 (EV = 0.71nm, B4 = 1.1nm, n = 3 in duplicates/cell construct, p < .01) cell lines at day 4 of the experiment.
Figure 2. Proliferation rate of SW480, LIM2405 and CT26 cells in vitro. (A) SW480 cell proliferation represented as mean absorbance values over four days (N = 3 in duplicates/cellular construct/time point). (B) LIM2405 cell proliferation represented as mean absorbance values over four days (N = 3 in duplicates/cellular construct/time point). (C) CT26 cell proliferation represented as mean absorbance values over four days (N = 3 in duplicates/cellular construct/time point). *p < .05, **p < .01, ****p < .0001.
EphB4 expression and cancer cell migration
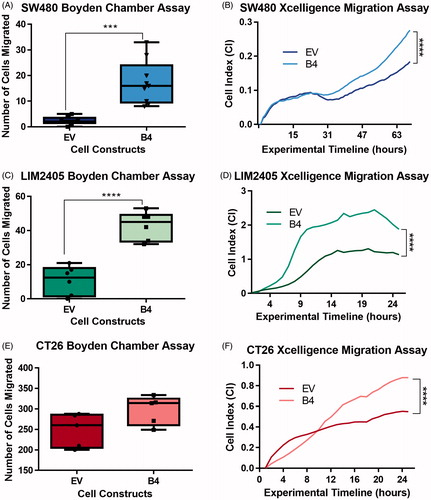
The effects of induced upregulation of EphB4 expression on migratory abilities of the cells were investigated using modified Boyden chamber migration assay (). Serum starved cells were assayed for migration at 24 hours. High EphB4 expressing SW480 B4 (17.3 ± 8.5 cells) and LIM2405 B4 (42.8 ± 8.4 cells) cells responded better to chemotactic stimuli leading to significantly increased number of migrating cells in comparison to EV controls (SW480 = 2.4 ± 1.5 cells, n = 9/cellular construct p < .001, LIM2405 = 10.8 ± 8.4 cells n = 6/cellular construct p < .0001) (). Similar trends were observed with the CT26 cells, where on average more B4 (296.8 ± 35.4 cells, n = 6/cellular construct) cells migrated compared to EV control (248.4 ± 41.2 cells, n = 6/cellular construct) (). These results were then verified using the Xcelligence system which permits continuous monitoring of migration in real time. The CT26 and LIM2405 cell lines were assayed for 24 h, however, due to the inherently low migratory abilities of the SW480 the experimental timeline was extended to 70 hours. The high EphB4 expressing cells once again migrated at significantly greater levels (SW480 = 0.28 ± 0.01 Cell Index, LIM2405 = 2.20 ± 0.22 Cell Index, CT26 = 0.84 ± 0.05 Cell Index) when compared to lower EphB4 expressing EV controls across all cell lines at beyond 20 hours (SW480 = 0.18 ± 0.01 Cell Index, LIM2405 = 1.21 ± 0.06 Cell Index, CT26 = 0.53 ± 0.02 Cell Index) (p < .0001 for all) (). Therefore, induced upregulation of EphB4 expression enhances chemoattractant response and as a result increases cellular migration of these CRC cell lines.
Figure 3. Migration of SW480, LIM2405 and CT26 cells in vitro. (A) Quantification of the number of migrated SW480 cells in Boyden Chamber assays (N = 9/cell construct). (B) SW480 Xcelligence migration assay depicting the migration measured in real time over 70 hours (N = 3/cell construct). (C) Quantification of the number of migrated LIM2405 cells in Boyden Chamber assays (N = 6/cell construct). (D) LIM2405 Xcelligence migration assay depicting the migration measured in real time over 24 hours (N = 6/cell construct). (E) Quantification of the number of migrated CT26 cells in Boyden Chamber assays (N = 6/cell construct). (F) CT26 Xcelligence migration assay depicting the migration measured in real time over 24 h (N = 3/cell construct). ***p < .001, ****p < .0001.
Effect of EphB4 expression on subcutaneous xenografts
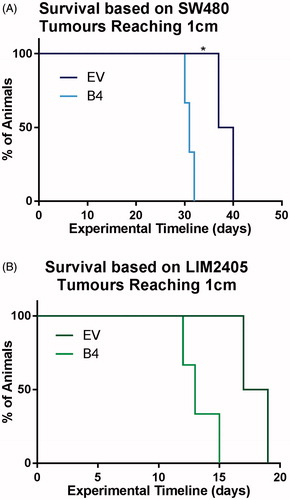
In order to investigate how EphB4 receptor expression influences proliferation, growth, vascularization and tumor composition, subcutaneous xenograft models were utilized. In this model the human cancer cells, SW480 and LIM2405, were injected into the flank of immunocompromised mice and tumor growth was measured non-invasively (EV n = 5, B4 n = 5/both cell lines). The tumors were harvested at 1 cm in diameter.
In this experiment, the enhanced proliferation rates observed in vitro were once again apparent in vivo. By day 32, all animals injected with the SW480 B4 cell construct reached the size limit of 1cm, exceeding the growth rate of EV tumors (day 40) () (p < .03). Similarly, 100% of the LIM2405 B4 tumors were harvested by day 15, hence, exhibited quicker growth rates than the EV tumors (day 20) ().
Figure 4. Survival of animals with subcutaneous tumors induced by SW480 and LIM2405 cells. (A) Kaplan–Meier survival plot of SW480 EV and B4 animals, which were culled when the tumors reached 1 cm in diameter (N = 5/cell construct). (B) Kaplan–Meier survival plot of LIM2405 EV and B4 animals, which were culled when the tumors reached 1 cm in diameter (N = 5/cell construct).
Harvested tumors were macroscopically examined; it was found that tumors induced by low EphB4 expressing EV cells had central necrosis with fluid accumulation (). In H&E stained sections of the SW480 and LIM2405 EV tumors, viable tissue was seen at the outer edges of the tumor (adjacent to the capsule), the tumor centers had large areas of necrosis ( and , respectively). In comparison, tumors induced by high EphB4 expressing SW480 and LIM2405 cells (B4), had viable tissue present throughout ( and , respectively).
Figure 5. Morphological and histological analysis of SW480 tumors. (A–A’) SW480 subcutaneous tumors dissected in half, revealing tumor centers (Scale bar = 2mm). (B–B’) Heamotoxylin and eosin stained SW480 EV, B4 tumors (Scale bar =100 µm). (C–C’) Immunohistochemical labeling of SW480 EV and B4 tumors using anti-human antibody (Scale bar =100 µm).
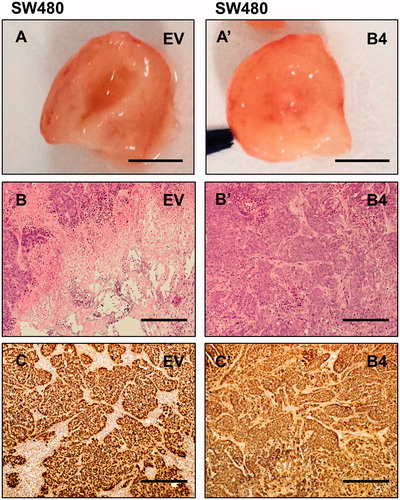
Figure 6. Morphological and histological analysis of LIM2405 tumors. (A–A’) LIM2405 subcutaneous tumors dissected in half, revealing tumor centers (Scale bar = 2 mm). (B–B’) Heamotoxylin and eosin stained LIM2405 EV, B4 tumors (Scale bar =100 µm). (C–C’) Immunohistochemical labeling of LIM2405 EV and B4 tumors using anti-human antibody (Scale bar = 100 µm).
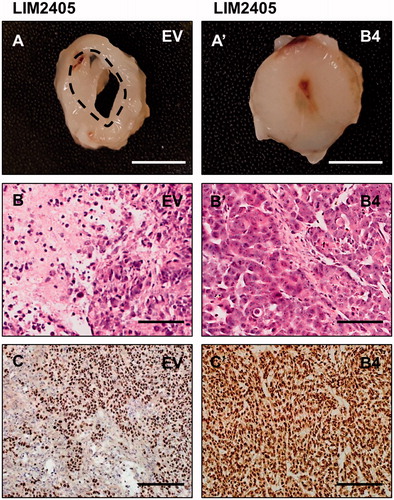
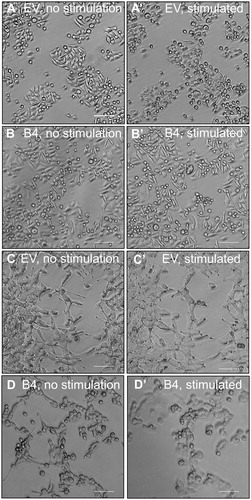
In order to investigate tumor composition, the anti-human nuclei antibody was used to distinguish human CRC cells from the mouse-derived stromal cells. The results showed that, in EV tumors of both cell lines, host-derived tissue is dispersed amongst the human cancer cells ( and ). In these tumors, even though there is intermingling between the host and cancer cells, the human cancer cells form small islets and structured colonies. In comparison, B4 tumors of both cell lines yield relatively homogenous masses and were densely packed with human cancer cells ( and ). To test if cellular clustering and segregation also occurs in vitro, EphrinB2-Fc was used to stimulate the SW480 and LIM2405 cells. Prior to stimulation, there are no notable differences in the morphological structure between SW480 EV and B4 cells ( and ). With the addition of EphrinB2-Fc, cellular rounding can be observed in EV cells () which is more prominent within the B4 culture (). The effects of stimulation are more obvious in LIM2405 cells. The LIM2405 EV cells have cellular projections and exhibit shortening of these projections after EprhinB2-Fc stimulation (). The B4 cells that also possess these projections are affected by stimulation to a larger extend since cells undergo complete rounding and some begin to lift off completely ().
Figure 7. Stimulation of SW480 and LIM2405 cells with EphrinB2-Fc in vitro. (A–A’) SW480 EV cells pre and post-stimulation (respectively). (B–B’) SW480 B4 cells pre and post-stimulation (respectively). C-C’. LIM2405 EV cells pre and post-stimulation (respectively). (D–D’) LIM2405 B4 cells pre and post-stimulation (respectively). (Scale Bars for all 100 µm).
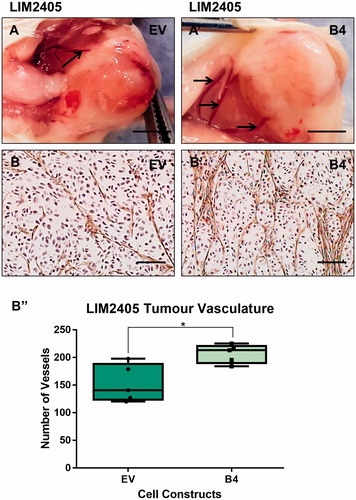
At the time of tumor harvesting, both the B4 tumors, induced by high EphB4 expressing cells SW480 and LIM2405 cells were noted to be supplied by thicker blood vessels than the tumors of low EphB4 expressing EV cells ( and ). We assessed the degree and quality of vascularization in the tumors by immuno-staining for the endothelial cell marker Von Willibrand Factor. The SW480 and LIM2405 EV tumor vessels appear to be thin, fragmented and lacked orientation ( and ), whereas, tumor vasculature persists, becomes thicker and well-networked in SW480 and LIM2405 B4 tumors ( and ). When quantified, B4 tumors had significantly higher density of blood vessels (SW480 = 97.7 ± 22.7 vessels, LIM2405 = 206.7 ± 16.7 vessels) in comparison to the EV tumors (SW480 = 47.6 ± 8.8 vessels, LIM2405 = 140.5 ± 33.78 vessels) ( and ) (p < .05 for both).
Figure 8. Evaluation of SW480 tumor vascularization. (A–A’) SW480 tumor vasculature at the time of harvesting (Scale bar = 2 mm). (B–B’) SW480 immunohistochemical labeling of vasculature with anti-Von Willibrand Factor in subcutaneous tumors (Scale bar = 100µm). (B’’) Quantification of vessel numbers using stereological point count method (N = 3 EV tumors, N = 5 B4 tumors). *p < .05.
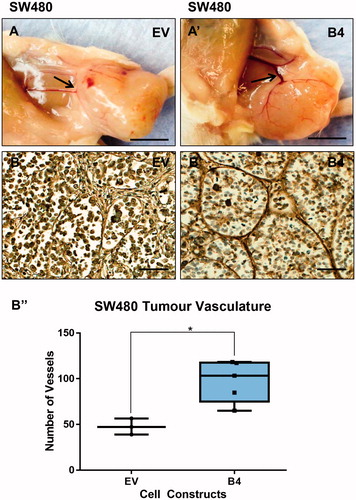
Figure 9. Evaluation of LIM2405 tumor vascularization. (A–A’) LIM2405 tumor vasculature at the time of harvesting (Scale bar =2mm). (B–B’) LIM2405 immunohistochemical labeling of vasculature with anti-Von Willibrand Factor in subcutaneous tumors (N = 5/cell construct/time point) (Scale bar =100µm) B’’, Quantification of vessel numbers using stereological point count method. *p < .05.
Discussion
EphB4 expression influences proliferation rates in CRC cells in vitro and in vivo
We have demonstrated in in vitro experiments that overexpression of EphB4, in the CRC cell lines SW480, LIM2405 and CT26 significantly impacts rate of cellular proliferation. In these experiments, the high EphB4 expressing cells proliferate more rapidly than the low EphB4 expressing EV controls across all three cell lines. Previously, EphB4 expression was associated with increase in proliferation rates in CRC cell lines [Citation24]. In another study, downregulation of EphB4 receptor signaling was demonstrated to increase the colonogenic potential of CRC cell lines [Citation26]. Our results also suggest that the high level of EphB4 expression increases the rate of proliferation in CRC cell lines.
To examine in vivo effects of enhanced EphB4 expression, we conducted subcutaneous xenografts using human CRC cell lines SW480 and LIM2405 in immunocompromised mice. Reflecting the increased rate of proliferation observed in in vitro experiments, the high EphB4 expressing tumors grew faster than the EV tumors and reached the size limit of 1 cm sooner.
The tumor growth trends observed in our study are consistent with the results of a previous study, in which low EphB4 expression, achieved by receptor knock-down, led to an 84% reduction in tumor growth [Citation24].
High EphB4 expression enhances cancer cell migration in vitro, leads to cancer cell aggregation in vivo
One of the well-documented roles of the Eph receptors is to regulate cytoplasmic dynamics such as cellular migration. In this study, we have observed that low EphB4 expressing cells show minimal cellular migration in end point and real time migration assays. Our results demonstrate that inducing the upregulation of EphB4 receptors in CRC cell lines significantly enhances their responsiveness to chemoattractant and migratory abilities. Enhanced EphB4 expression in several cancers such as kidney, bladder, prostate, uterine, cervical and breast have previously been observed [Citation18,Citation21,Citation24]. Decreased adhesion accompanied by increased cellular motility in cancers facilitates metastatic spread of cancer [Citation31]. EphB4 receptor expression contributing to the metastatic spread has also been documented in CRC studies. EphB4 gene expression has been shown to increase in colonic tumors and metastatic lesions in comparison to normal adjacent tissue [Citation24,Citation29].
In our in vivo experiments, we probed human cancer cells with an anti-human antibody to distinguish them from background host tissue. The obtained results suggest that tumors of high EphB4 expressing cells yield homogenous masses densely packed with human cancer cells. In comparison, in the tumors induced by low EphB4 expressing cells, host-derived tissue is widely dispersed amongst the human cancer cells. It has been hypothesized that a similar interaction as between EphB2 and EphB3 receptors and EphrinB ligands contributes to tumors segregation. It has been demonstrated that in vitro that EphB2 and EphB3 receptor expressing CRC cells cluster together and form tight homogenous colonies upon encountering EphrinB1 ligand expressing cells [Citation15]. Stimulation and activation of EphB2 with an EphrinB1-Fc resulted in the cells having a rounded shape and reduced adhesion to matrix proteins, suggesting onset of cellular repulsion as it has been observed in tumor models [Citation14]. We have conducted similar experiments, stimulating the cell lines used for xenografts with EphrinB2-Fc. As a result, greater degree of cellular clustering and rounding was observed with EphB4 overexpressing cells. As such, our in vitro and in vivo studies suggest that high EphB4 expression may result in tumor cell segregation. It has been shown that ligand stimulation with EphrinB2 in MCF-10A mammary tumor cells overexpressing EphB4 has a “tumor suppressive” effect and that EphB4 may have a tumor enhancer or suppressor role depending on the balance between ligand-independent and ligand-dependent signaling [Citation32]. Furthermore, overexpression of Eph receptors in primary tumors and their epigenetic silencing in the progression of CRC have been reported [Citation26,Citation33]. The EphA1 receptor expression was found to be several folds higher in 53% of primary CRC tumors in comparison to matching normal tissue [Citation33]. However, in late stages of metastasis EphA1 expression was downregulated, which associates with poorer patient survival. Similarly, inverse correlations between EphB receptor expression and stage of CRC, suggests that Eph receptors may need to be downregulated in order for the cancer to overcome compartmentalization and achieve metastasis [Citation26]. However, although local invasion may be restricted through Eph receptor mediated segregation, the high EphB4 expressing cancer cells may be under increased pressure to spread through blood vessels.
High EphB4 expression leads to extensive vascularization in subcutaneous tumors
Macroscopic examination in situ showed that B4 tumors were supplied by a more extensive vascular network. Immunohistochemical analysis with an endothelial cell marker to assess the level and quality of vascularization within tumors demonstrated that the B4 tumors had prominent and well networked vasculature throughout the tumor tissue. In contrast, in the EV tumors the vessels appear to be malformed, fragmented and largely failed to form vascular networks. Quantitation confirmed that B4 tumors were significantly more vascular than the EV tumors. Similar results have been recently described by Lv and associates (2016) using only the SW480 cell line in tumor xenografts [Citation34]. The authors reported that, whilst EphB4 overexpressing tumors have enhanced vascularization, they also have large areas of necrosis, which might be due to increased rate of tumor growth. In our study, while we also report better vascularization and growth of EphB4 overexpressing xenografts, necrosis appears to be more prominent in EV tumors with low endogenous EphB4 expression. There are several inconsistencies between our and Lv et al. (2016) studies. Firstly, in our study we had both experimental and ethical endpoints. Our experimental timeline of 40 days was similar to that of Lv et al. (2016). However, our ethical timeline dictated the collection of tumors at the size limit of 1cm for the welfare of the animal. For this reason, the faster growing EphB4 overexpressing tumors reached the ethical time limit and were collected earlier (at 32 days) than EV tumors (at 40 days) for SW480 cell line, which may have yielded differences in level of tumor necrosis. The collection times may have also influenced the differences in the level of tumor intermingling with host tissues observed in our study. Secondly, the level of EphB4 overexpression in transfected cells might have significant impact on tumor behavior and composition in vivo. Although Lv et al. (2016) did not report the level of EphB4 protein expression in their transfected cells; it may be different to the level of expression in cells used for our study. Furthermore, it is difficult to make direct comparison between our findings, as the histological images demonstrating necrosis in control tumors have not been provided in Lv et al. (2016) paper. Finally, the strains of mice used were different; in our study, we used NOD CB17-prkdc-scid/JAsmu mice, while Lv et al (2016) used athymic nude mice. The variation in immunological phenotypes as well as signaling pathways might influence the behavior of tumor cells in vivo.
The high level of vascularization in B4 tumors is consistent with the well documented characteristics of EphB4 receptors in regulating angiogenesis with its corresponding EphrinB2 ligand. The importance of EphB4 receptor and its ligand EphrinB2 in vascular development has been demonstrated in animal models. A knock-out of the receptor or the ligand leads to an arrest in angiogenesis and ultimately results in embryonic lethality [Citation35]. EphB4 expression is confined to endothelial cells of the venous lineage whereas EphrinB2 expression is found in arterial angioblast, endothelial cells, perivascular mesenchymal cells [Citation35,Citation36]. At the site of angiogenesis, endothelial cells in the leading edge join to form vascular tubes, pericytes are then recruited to adhere around the tubes leading to vessel maturation [Citation37]. EphB4 signaling is thought to be involved in the cell-recruiting phase of this process, helping maturation of young vessels [Citation28].
Inhibition of the Delta-like ligand 4 (DII4)/Notch pathway, known to play a role in angiogenesis, was shown to decrease tumor size and number by 50% in insulinomas [Citation28]. Blocking of EphB4 and EphrinB2 interaction in combination with DII4/Notch inhibition was shown to further reduce tumor size. It was found that in these tumors there was a decrease in vessel maturation with less mural cell coverage, reduced vessel diameters and perfusion compared to control animals [Citation28]. These findings are consistent with our results, where low EphB4 expression, therefore low signaling, results in a decrease in tumor vessel competency, poor blood delivery to tumor tissue and decrease in cancer cell viability. Fluid accumulation within the tumors induced by low EphB4 expressing cells could also be attributed to increase in vessel leakage due to lack of maturation in vessels.
EphB4 expression in tumors can support angiogenesis in cancers and it may also result in site specific metastasis through the vessels. EphB4 expressing cancer cells were reported to adhere to EphrinB2 expressing endothelial cells even when the receptor or the ligand was truncated [Citation38]. These findings indicate that the enhanced vasculature in tumors and homing abilities conferred to cancer cells through high EphB4 expression could increase risk of metastatic spread.
Conclusion
This study was aimed at investigating the effects of induced upregulation in EphB4 receptors using vector systems that were transfected into the endogenously low EphB4 expressing human SW480 LIM2405 and mouse CT26 CRC cell lines. Our results suggest that high EphB4 receptor expression significantly increases the rate of migration in CRC cells. In subcutaneous models, high EphB4 expressing cell induced tumors have better viability as a result of enhanced vascularization. These results suggest that with enhanced vascularization and an increase in migratory abilities, the high EphB4 expressing cells may be able to metastasize more readily.
Ethics approval and consent to participate
All in vivo experiments were performed according to the National Health and Medical Research Council Code of conduct on the care and use of laboratory animals for scientific purposes and approved by the Victoria University Animal Experimentation Ethics Committee (Animal Ethic Numbers 04/12 and 14/001).
Acknowledgements
EphrinB2-Fc and anti-human IgG were generously gifted by Dr. Peter Janes from Monash University, Australia.
Data availability statement
The datasets used and/or analyzed during the current study available from the corresponding author on reasonable request.
Disclosure statement
No potential conflict of interest was reported by the authors.
Additional information
Funding
References
- Ferlay J, Soerjomataram I, Ervik M, et al. Cancer Incidence and Mortality Worldwide: IARC CancerBase. GLOBOCAN. 2012.
- Cancer Council.Understanding Bowel cancer; a guide for people with bowel cancer, their families and friends. Cancer Council Victoria. 2013; p. 11–13.
- Australian Institute of Health and Welfare (AIHW). Cancer in Australia: an overview. AIHW. Cancer series no. 74, catalogue no. CAN70; 2012.
- Hohla F, Winder T, Greil R, et al. Targeted therapy in advanced metastatic colorectal cancer: current concepts and perspectives. World J Gastroenterol. 2014;20:2219–2840.
- Bush JO, Soriano P. Eph/Ephrin signalling: genetic, phosphoproteomic, and transcriptomic approaches. Semin Cell Dev Biol. 2012;23:26–34.
- Himanen JP. Ectodomain structures of Eph receptors. Semin Cell Dev Biol. 2012;23:35–42.
- Herath NI, Boyd AW. The role of Eph receptors and ephrin ligands in colorectal cancer. Eur J Cancer. 2011;126:2003–2011.
- Merlos-Suárez A, Batlle E. Eph–ephrin signalling in adult tissues and cancer. Curr Opin Cell Biol. 2008;20:194–200.
- Pasquale EB. Eph receptors and ephrins in cancer: bidirectional signalling and beyond. Nat Rev Cancer. 2010;10:165–180.
- Holmberg J, Genander M, Halford MM, et al. EphB receptors coordinate migration and proliferation in the intestinal stem cell niche. Cell 2006;125:1151–1163.
- Solanas G, Batlle E. Control of cell adhesion and compartmentalization in the intestinal epithelium. Exp Cell Res. 2011;317:2695–2701.
- Gao Q, Liu W, Cai J, et al. EphB2 promotes cervical cancer progression by inducing epithelial-mesenchymal transition. Hum Pathol. 2014;45:372–381.
- Senior PV, Zhang BX, Chan STF. Loss of cell-surface receptor EphB2 is important for the growth, migration, and invasiveness of a colon cancer cell line. Int J Colorectal Dis. 2010;25:687–694.
- Guo DL, Zhang J, Yuen ST, et al. Reduced expression of EphB2 that parallels invasion and metastasis in colorectal tumours. Carcinogenesis. 2006;27:454–464.
- Cortina C, Palomo-Ponce S, Iglesias M, et al. EphB-Ephrin-B interactions suppress colorectal cancer progression by compartmentalizing tumor cells. Nat Genet. 2007;39:1376–1383.
- Ji XD, Li G, Feng YX, et al. EphB3 is overexpressed in non-small-cell lung cancer and promotes tumor metastasis by enhancing cell survival and migration. Cancer Res. 2011;71:1156–1166.
- Chiu ST, Chang KJ, Ting C, et al. Over-expression of EphB3 enhances cell–cell contacts and suppresses tumor growth in HT-29 human colon cancer cells. Carcinogenesis. 2009;30:1475–1486.
- Alam SM, Fujimoto J, Jahan I, et al. Coexpression of EphB4 and EphrinB2 in tumor advancement of uterine cervical cancers. Gynecol Oncol. 2009;114:84–88.
- Brantley-Sieders DM, Jiang A, Sarma K, et al. Eph/Ephrin profiling in human breast cancer reveals significant associations between expression level and clinical outcome. PLoS One. 2011;6:1–9.
- Li M, Zhao ZW, Zhang Y, et al. Over-expression of EphB4 is associated with carcinogenesis of gastric cancer. Dig Dis Sci. 2010;56:698–706.
- Ozgur E, Heidenreich A, Dagtekin O, et al. Distribution of EphB4 and EphrinB2 in normal and malignant urogenital tissue. Urol Oncol. 2011;29:78–84.
- Spannuth WA, Mangala LS, Stone RL, et al. Converging evidence for efficacy from parallel EphB4 targeted approaches in ovarian carcinoma. Mol Cancer Therapy. 2010;9:2377–2388.
- Yavrouian EJ, Sinha UK, Rice DH, et al. The significance of EphB4 and EphrinB2 expression and survival in head and neck squamous cell carcinoma. Arch Otolaryngol Head Neck Surg. 2008;134:985–991.
- Kumar SR, Scehnet JS, Ley EJ. Preferential induction of EphB4 over EphB2 and its implication in colorectal cancer progression. Am Assoc Cancer Res. 2009;69:3736–3745.
- Batlle E, Bacani J, Begthel H, et al. EphB receptor activity supresses colorectal cancer progression. Nature. 2005;435:1126–1129.
- Davalos V, Dopeso H, Castaño J, et al. EphB4 and survival of colorectal cancer patients. Cancer Res. 2006;66:8943–8948.
- Krasnoperov V, Kumar SR, Ley E, et al. Novel EphB4 monoclonal antibodies modulate angiogenesis and inhibit tumor growth. Am J Pathol. 2010;176:2029–2038.
- Djokovic D, Trindade A, Gigante J, et al. Combination of Dll4/notch and ephrin-B2/Ephb4 targeted therapy is highly effective in disrupting tumor angiogenesis. BMC Cancer. 2010;10:1–12.
- Stephenson S, Slomka S, Douglas EL, et al. Receptor protein tyrosine kinase EphB4 is up-regulated in colon cancer. BMC Cancer. 2001;2:1–9.
- Dopeso H, Mateo-Lozano S, Mazzolini R, et al. The receptor tyrosine kinase EphB4 has tumour suppressor activities in intestinal tumorigenesis. Am Assoc Cancer Res. 2009;69:7430–7439.
- Bendas G, Borsig L. Cancer cell adhesion and metastasis: selectins, integrins, and the inhibitory potential of heparins. Int J Cell Biol. 2012;2012:676731.
- Rutkowski R, Mertens-Walker I, Lisle JE, et al. Evidence for a dual function of EphB4 as tumor promoter and suppressor regulated by the absence or presence of the Ephrin-B2 ligand. Int J Cancer. 2011;131:E614–E624.
- Herath NI, Doecke J, Spanevello MD, et al. Epigenetic silencing of EphA1 expression in colorectal cancer is correlated with poor survival. Br J Cancer. 2009;100:1095–1102.
- Lv JH, Xia QY, Wang JJ, et al. EphB4 promotes the proliferation, invasion, and angiogenesis of human colorectal cancer. Exp Mol Pathol. 2016;100:402–408.
- Adams R, Wilkinson GA, Weiss C, et al. Roles of EphrinB ligands and EphB receptors in cardiovascular development: demarcation of arterial/venous domains, vascular morphogenesis, and sprouting angiogenesis. Genes Dev. 1999;13:295–306.
- Gerety SS, Wang HU, Chen Z, et al. Symmetrical mutant phenotypes of the receptor EphB4 and its specific transmembrane ligand ephrin-B2 in cardiovascular development. Mol Cell. 1999;4:403–414.
- Salvucci O, Tosato G. Essential roles of EphB receptors and EphrinB ligands in endothelial cell function and angiogenesis. Adv Cancer Res. 2012;114:21–57.
- Héroult M, Schaffner F, Pfaff D, et al. EphB4 promotes site-specific metastatic tumor cell dissemination by interacting with endothelial cell–expressed EphrinB2. Am Assoc Cancer Res. 2010;8:1297–1309.