
Abstract
Introduction: To increase precision of radiation treatment (RT) delivery in prostate cancer, MRI-based RT as well as the use of fiducials like gold markers (GMs) have shown promising results. Their combined use is currently under investigation in clinical trials. Here, we aimed to evaluate a workflow of image registration based on GMs between CT and MRI as well as weekly MRI-MRI adaption based on T2 TSE sequence.
Material and methods: A gel-phantom with two inserted GMs was scanned with CT and three different MR-scanners of 1.5 and 3 T (T2 TSE and T1 VIBE-Dixon, isotropic, voxel size 2 × 2 × 2 mm). After image fusion, deviations for fiducial and gel match were measured and artifacts were evaluated. Additionally, CT-MRI-match deviations and MRI-MRI-match deviations of 10 Patients from the M-basePro study using GMs were assessed.
Results: GMs were visible in all imaging modalities. The outer gel contours were matched with <1 mm deviation, contour volumes varied between 0 and 1%. The deviations of the GMs were less than 2 mm in any direction of MRI/CT. Shifts of peripherally or centrally located GMs were randomly distributed. The average MRI-CT-match precision of 10 patients with GMs was 1.9 mm (range 1.1–3.1 mm).
Conclusions: Match inaccuracies for GMs between reference CT and voxel-isotropic T2-TSE sequences are small. Spatial deviations of CT- and MR-contoured fiducials were less than 2 mm, i.e., below SLT of the applied modalities. In patients, the average CT-MRI-match precision for GMs was 1.9 mm supporting their use in MR-guided high precision RT.
Trial registration: ClinicalTrials.gov identifier: NCT02724670.
Introduction
Current state-of-the-art of external beam radiotherapy (EBRT) for prostate cancer includes image-guided radiotherapy (IGRT) based on planning computed tomography (CT). According to national guidelines, cross-sectional imaging including magnetic resonance imaging (MRI) is recommended for high-risk patients [Citation1,Citation2]. Due to the higher spatial accuracy, a more precise delineation could be achieved using MRI [Citation3–5]. The tumor(s) in the prostate can be visualized and specifically targeted [Citation6]. And MR-biomonitoring and adaptive treatment are currently evolving in prostate cancer and other tumor entities [Citation7]. Reduction of the planning target volume (PTV) margins due to improved definition of the prostate including dominant lesions, i.e., the intraprostatic tumor by MRI or PET [Citation8], is impeded by inter- and intrafractional organ movements of prostate and surrounding organs at risk (OAR) like bowel and bladder volume changes [Citation9,Citation10].
Daily cone-beam CT (CBCT) for IGRT compensates for interfractional changes of prostatic movement mainly caused by different OAR volumes. The additional application of fiducials like gold markers (GMs) is one approach to further increase accuracy by a GM-based daily match of the prostate to the initial planning CT (reference image). The use of different fiducials with portal imaging or CBCT is well established in clinical routine [Citation1,Citation11]. However, the combination of MRI planning and the use of GMs in regard to visibility on MRI [Citation12,Citation13], distortion of MRI data by artifacts [Citation14] and anisotropic deformation of MRI-sequences [Citation15] with underestimated prostatic volumes (target miss) are currently under investigation.
Here, we aimed to evaluate the accuracy of image registration based on GMs between CT and MRI in a phantom using three different MR scanners with 1.5 and 3.0 T. In addition, we used clinical data of a current clinical trial including multiple MRI data sets of 10 patients (M-base Pro 1.0 study, ClinicalTrials.gov Identifier: NCT02724670) to validate its feasibility and the workflow regarding image fusion of additional weekly MRIs during EBRT.
Material and methods
Phantom specifications and measurements
To evaluate the accuracy of image fusion with different MRI-scanners a phantom containing fiducials was established using a rectangular plastic box (of 22.5 × 12.76 × 13.66 cm3) filled to a height of 6.7 cm with a 1.5% agarose gel (Agar, Sigma-Aldrich, St. Louis, USA). Two GMs (0.28 mm × 10 mm, Gold Anchor™) were centrally and peripherally inserted into the gel structure. Assuming a cylindrical shape with several ‘cave-ins’ (), their volume can be estimated to be around 0.3 mm3. Permanent markers for laser coordinate systems were added to achieve positioning reliability. To visualize the coordinates in CT and MRI Gelomyrtol-capsules (G. Pohl-Boskamp GmbH & Co. KG, Hohenlockstedt, Germany) were fixed at these positions. The CT-image of the phantom and the GMs on CT and MRI are shown in .
Figure 1. CT-image of Phantom for CT and MRI. The phantom consists of a plastic box filled with agarose gel and two fiducials. The appearance of the fiducials (Gold Anchor®) is shown as photo, on MRI (T2 TSE, T1 VIBE *Dixon and R2*) and on CT.
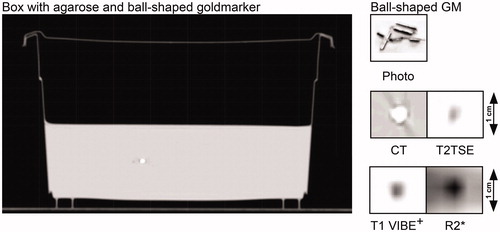
The ‘planning’ CT (Philips Brilliance Big Bore CT, Philips Medical Systems, Cleveland, Ohio, US) of the phantom was performed as a reference for image fusion of MRIs. MRIs of the phantom were performed with three clinical MR-scanners: (a) 1.5 T MRI (MAGNETOM® Symphony, Siemens Healthcare GmbH, Erlangen, Germany; ‘Symphony’), (b) 1.5 T MRI (MAGNETOM® Aera, Siemens Healthcare GmbH, Erlangen, Germany; Aera) and (c) 3 T (MAGNETOM® Skyra, Siemens Healthcare GmbH, Erlangen, Germany; Skyra). Sequence specifications are given in . Voxel size was 2 × 2 × 2 mm in all imaging modalities but on the Symphony tomograph, which allows only for a near-isotropic voxel of 2 × 2.1 × 2.1mm. The T2 TSE sequence was used for all inter-scanner comparisons. T1 VIBE Dixon and R2* sequences were used to test visualization of fiducials. For the R2* sequence, a T2* sequence was used without computing of the relaxivity.
Table 1. Specifications of used MRI-sequences.
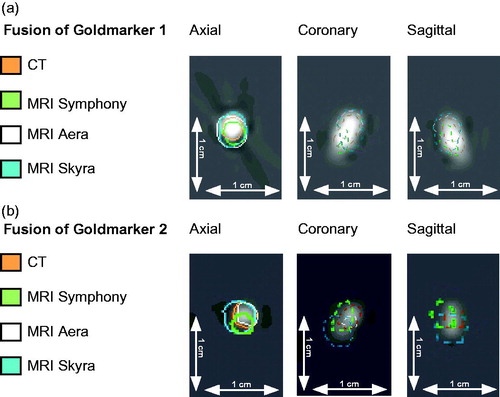
MRIs were performed with abdominal coils. The region of interest included always the entire phantom. To exclude geometric errors of the phantom due to decay, the CT was performed as reference and after retrieval of all MRIs an additional CT was taken, demonstrating robustness of the agar phantom. All sequences were rigidly matched to the reference CT using Oncentra MasterPlan (Nucletron, Columbia, MD, US) using an implemented mutual information algorithm. The registration of the CT with the T2 TSE sequences (colored contours) is shown in the supplement material. The quality of image registration by mutual information was verified by measuring the alignment of the outer gel structure. The geometrical midpoint in the axial plane was defined for each image data set. The deviation of midpoints of MRI-sequences from the CT-reference point and related volumes were measured using tools from Oncentra MasterPlan software (i.e., the definition of reference point, vector deviation). The GMs volumes were contoured for all image modalities and the volume was calculated by the radiotherapy planning program (Oncentra MasterPlan). Two observers (DW, ACM) compared visibility of the artifacts in all image modalities for validity of treatment planning. The estimated center of mass (CMCT) of each GM-contour was defined as the reference point in the CT. Then, the distance of the CM of each GM-contour in each MRI to the CMCT was determined as visualized in . The deviations were further measured as x-, y- and z-coordinates by the same method and the resulting vector length was calculated.
Figure 2. Match of a centrally and a peripherally inserted fiducial. The CT-image (3 dimensions) of (a) a centrally and (b) a peripherally inserted goldmarker are given with the colored contours of the matched T2 TSE sequences of three different MR-scanners (Symphony, Aera, Skyra)*. The scale of 10mm indicates the magnification. *Siemens Healthcare GmbH, Erlangen, Germany.
Clinical data evaluation
To study robustness of consecutive image fusion in a threshold-based adaptive protocol we evaluated 10 patient samples of the ‘prospective MR-based adaptive IGRT of prostate cancer’ study (Mbase Pro 1.0 study, ClinicalTrials.gov Identifier: NCT02724670). In this study patients, each received a planning CT followed by GM-based image registration using an R2*-sequence from 3 T MRI (3 mm SLT, Repetition Time 328 ms, Echo Time 4,1 ms, Number of Averages 1, Spacing between slices 3, Number of Phase encoding steps 144, phase-encoding direction left to right). R2*-sequence was matched by landmark using the GMs in CT and R2* for anatomical registration. The co-registration of T2 TSE was performed automatically in Oncentra MasterPlan. This sequence served as basis for consecutive matches of weekly T2 TSE sequences using intraprostatic landmarks and was used for delineation of the dominant lesion as shown in . The match correctness was visually checked by the overlap of MR 1 and the consecutive MRs in regard to the position of chosen intraprostatic landmarks and after contouring of the prostate (visual check of contour deviations/midpoint of contour). Match precision of the CT-MRI-image-fusion was measured by two observers (ACM, DW) using the average squared errors (ASE) of 5–10 chosen anatomical points per match.
Figure 3. MR-image fusion workflow in a clinical study. (a) Image registration by GM using R2*-sequence from 3 T MRI (Skyra)*. (b) Consecutive match of T2 TSE sequence for tumor delineation. (c) Match of a weekly derived T2 TSE sequences using the marker-matched T2 TSE sequence (b) for registration on anatomical identical intraprostatic points (MRI-MRI-match). For details, see the method section. *Siemens Healthcare GmbH, Erlangen, Germany.
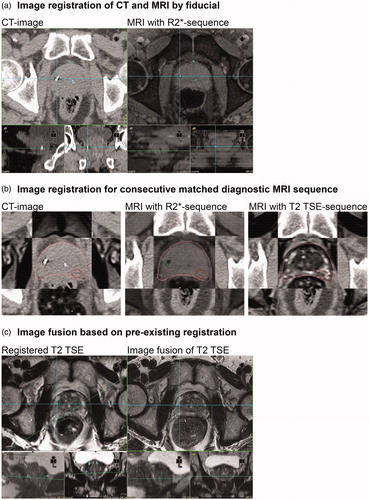
In the clinical study, significant prostatic volume reductions (caused by concomitant androgen deprivation) are investigated by weekly MRIs and in case of relevant reductions the treatment plan is adapted. Therefore, we additionally evaluated landmark-based match precision of 10 patient samples using a weekly MRI based on 5–10 anatomical identical intraprostatic points (MRI-MRI-match), . Relevant intraprostatic points comprised upper and lower position of urethra, and at least at two central slices anatomical characteristics like benign prostatic lesions, dominant lesion or others. Within the slice containing the intraprostatic landmarks we added bilateral landmarks of prostate to ensure correct orientation of the match. Match precision of the MRI-MRI-matches (8 MRI per patient, n = 80) was measured by two different observers (ACM, DW) by the ASE of each MRI-MRI-match. The landmark based matching was performed by two radiation oncologists (ACM, DW) to account for interobserver variability.
Results
Phantom data
The registration of MRIs by mutual information (reference = CT) was excellent. Our self-made phantom was capable of visualizing GMs in CT and MRI as demonstrated in . A deviation between the outer contours of the agarose gel volumes was visually almost undetectable and the measurement of midpoint-deviations supported that finding with variations of less than 1 mm in x- and y-axis (). This is confirmed by the small difference (≤1%) between the agarose gel volumes (, Supplement Figure 1).
The subjective visibility of GMs (2 observers) did not vary between the 1.5 T MRI data but was best in the 3 T sequences () also indicated by small GM volume differences favoring 3 T sequences with slightly larger volumes, . The images of the fiducials in phantom and prostate () indicate that artifacts are small but present in CT images. The CT-artifacts did not impair contouring on CT. Artifacts around the GMs were detected in the MRI-sequences (T2 TSE, T1-VIBE Dixon, R2*) but appear to be small ( and ). The largest deviation of the MRIs from the CT was observed for the 3 T MRI match ( and ). However, all deviations were below 2 mm with only one vector length above 2 mm.
Table 2. Volumes of the gel-contour and the goldmarker-contours. Additionally the deviations of the midpoint of the gel contours in the MRI sequences compared to CT.
Table 3. Spatial deviations of two fiducials in all dimensions.
Patient data – fiducial-based match as baseline
The clinical datasets of 10 landmark based CT-MRI-matches showed an average deviation of 1.9 mm (range 1.2–2.9 mm, ). The example in shows matching deviations of CT and R2* below 1 mm (ASE 0.5 mm). Co-registration of the T2 TSE sequence leads to a very precise match as indicated by the contour around the prostate in the CT-, R2*- and T2 TSE images ().
Table 4. Results of CT-MRI registration and T2 TSE-based MRI-MRI registration of 10 patient samples each.
T2 TSE-co-registration used as baseline for consecutive matches
The accuracy of weekly MRIs (T2 TSE) for volume measurement of 10 patient data sets (8 MRI per patient, n = 80) were evaluated by calculating the average of the ASE per patient and giving the average of that: 1.6 mm (range 1.0–2.4 mm, ). The landmark-based approach was visually accurate and replicable in all cases ().
Discussion
Here, we report the feasibility of a novel clinical workflow for adaptive RT using the co-registered T2 TSE sequence as baseline enabling consecutive landmark-based T2 TSE matches with acceptable deviations of 1.9 mm in average i.e., below slice thickness. This finding appears to be relevant because the T2 TSE sequence is used for contouring of the dominant lesion but the small GMs are invisible (i.e., no artifacts) in this sequence. Therefore, registration on CT in a clinical setting (GMs in prostate) is performed indirectly using a R2* or gradient echo (GE) sequence and in a second step the T2 TSE is co-registered for contouring. In this study, we could demonstrate the robustness of MR-CT registration with GMs based on the clinically applied T2 TSE sequence in a phantom with three MR-scanner generations.
The pre-condition for the phantom study was the correct registration of all modalities by the planning software OTP. The comparison of the CT-based match of different MRIs clearly confirms the accuracy of image fusion by mutual information (, Supplement ). Comparing the gel volumes, the differences were below or at 1% for each modality underlining these findings.
Thereafter, we studied the impact of potential distortions of ‘isotropically-acquired’ MR-images (, ). The deviations of the GMs were not systematically shifted in one direction i.e., a random error might be assumed. The largest deviation was measured in the 3 T MRI but was below the size of SLT. The vector shifts also indicate that the position of the GMs within the gel i.e., centrally or peripherally did not influence the spatial deviation. The markers contain 0.5% iron yet no systematic deviation could be found when comparing the three T2 TSE sequences of different scanners. We did not attempt deformable image registration due to the inherent difficulties of a spatially accurate match [Citation16].
Visualizations of the GMs in 3 T MRI was superior to both 1.5 T MRI in all sequences due to more susceptibility artifacts resulting in a generally slightly larger volume of the fiducial, as shown in , which is in line with a report from Tanaka et al. [Citation12]. Despite volume differences, the artifacts in CT or MRI did not impair contouring in both modalities. To avoid artifacts and facilitating MR-monitoring during eight weeks of EBRT we have chosen one of the smallest available GMs to reduce potential artifact on CT and MRI [Citation17]. In the clinical setting, the artifacts were sometimes in T2 TSE images so low that the GMs could not be identified. This limitation has been described before [Citation18]. Therefore, another sequence (R2*; available for Skyra) was employed in the clinical prospective Mbase Pro 1.0 study to facilitate the fiducial-based co-registration of T2 TSE sequences and MR adaptive IGRT (). In addition, we demonstrated that small GMs as used in this study were also detectable in isotropic VIBE Dixon sequences which are available for the latest MR-tomography generation (Aera, Skyra). We did not detect distortions of MRIs leading to volume underestimation compared to CT with the investigated isotropic MR sequences. Bossard et al. published another protocol using fiducials to indirectly match a diagnostic multiparametric (mp) MRI on a curved table with a planning CT via another flat table MRI [Citation19]. In contrast to that matching algorithm we performed an additional mpMRI after insertion of the fiducials on a flat table to enable a direct image fusion of the mpMRI showing the intraprostatic lesion.
The MRI-based match of initial mpMRI (before insertion of fiducials or start of ADT) as well as the monitoring MRIs during EBRT were then performed either also by fiducials or using identical anatomic landmarks of MRI.
Our findings compare well to the results of Maspero et al. and Hamdan et al., who each used automatic GM-localization approaches and found similarly small deviations (below 2 mm) [Citation20,Citation21]. In contrast to this study, the authors did not evaluate the MRI sequence which is used for contouring (T2 TSE). An automatic registration method of GMs was performed but the co-registration of other sequences was not mentioned. Furthermore, Huang et al. and Walcker et al. also demonstrated deviations of less than 2 mm using MR-phantoms without gold markers [Citation14,Citation22]. Therefore, PTV-margins should at least cover SLT (2 mm in this study) plus an additional margin. In general, interfractional changes are well compensated by daily CBCT but margins should not be reduced too much to be large enough for intrafractional movement [Citation23]. Engels et al. used daily IGRT plus fiducials with tight PTV margins (minimal PTV margin: 3 mm vs. 6 mm) and reported increased recurrence rates potentially due to intrafractional displacement in the arm with 3 mm margins [Citation24]. Intrafractional movement depends on duration of treatment i.e., duration of CBCT plus radiotherapy. Consequentially, short delivery time through VMAT (volumetric modulated arc therapy) or even FFF (flattening filter free) techniques might help to solve this problem [Citation25] as well as tracking of the prostate [Citation26] or other visible markers like spacers [Citation27,Citation28].
This study has several limitations: The prostate phantom was only scanned once in each MRI. Multiple data sets might provide a more robust result regarding spatial deviations or distortions. We deliberately used 2 mm of SLT for our planning CT and all MRI sequences, because this SLT is frequently used in RT planning routine. A lower SLT could provide even more precise information about the spatial deviations of GMs and also about the quality of the CT to MRI match of the outer contour. However, the risk of artificial movements in the clinical situation might be increased by the longer duration of MR-acquisition. Our data were derived from voxel-isotropic MRI-sequences. Therefore, our findings cannot be transferred to non-isotropic conditions.
In conclusion, this study suggests that MR-based adaptive IGRT using voxel-isotropic MR-images with a fiducial-based match is associated with low match-related inaccuracies. Consecutive matching of additional MRIs (monitoring of treatment) is feasible using the proposed workflow with uncertainties also below SLT of the MRI.
Supplemental Material
Download PDF (608 KB)Acknowledgments
We thank C. Marks and A. Stolte for excellent assistance during image acquisition.
Disclosure statement
The authors report no conflicts of interest. We mention the cooperation with Siemens Healthcare in another project (ACM, DT, DZ, KN) and as part of an internal clinical use test (ACM).
References
- Prostate C. NCCN clinical practice guidelines in oncology. JNCCN. 2018;Version 4.2018;1–124.
- Leitlinienprogramm Onkologie der AWMW DKeVu, e.V DK. Interdisziplinäre Leitlinie der Qualität S3 zur Früherkennung, Diagnose und Therapie der verschiedenen Stadien des Prostatakarzinoms. German S3-Guideline. 2016; Version 4.0 –Dezember 2016(www.leitlinienprogramm-onkologie.de): 1–352.
- Rasch C, Steenbakkers R, van Herk M. Target definition in prostate, head, and neck. Semin Radiat Oncol. 2005;15:136–145.
- Chen L, Price RA, Jr., Wang L, et al. MRI-based treatment planning for radiotherapy: dosimetric verification for prostate IMRT. Int J Radiat Oncol Biol Phys. 2004;60:636–647.
- Seppala T, Visapaa H, Collan J, et al. Converting from CT- to MRI-only-based target definition in radiotherapy of localized prostate cancer: a comparison between two modalities. Strahlenther Onkol. 2015;191:862–868.
- Muller BG, van den Bos W, Brausi M, et al. Role of multiparametric magnetic resonance imaging (MRI) in focal therapy for prostate cancer: a Delphi consensus project. BJU Int. 2014;114:698–707.
- Paterson C, Allwood-Spiers S, McCrea I, et al. Study of diffusion weighted MRI as a predictive biomarker of response during radiotherapy for high and intermediate risk squamous cell cancer of the oropharynx: the MeRInO study. ctRO. 2017;2:13–18.
- Thorwarth D, Notohamiprodjo M, Zips D, et al. Personalized precision radiotherapy by integration of multi-parametric functional and biological imaging in prostate cancer: a feasibility study. Z Med Phys. 2017;27:21–30.
- Huang E, Dong L, Chandra A, et al. Intrafraction prostate motion during IMRT for prostate cancer. Int J Radiat Oncol Biol Phys. 2002;53:261–268.
- Casares-Magaz O, Moiseenko V, Hopper A, et al. Associations between volume changes and spatial dose metrics for the urinary bladder during local versus pelvic irradiation for prostate cancer. Acta Oncol. 2017;56:884–890.
- Wust P, Joswig M, Graf R, et al. Dosimetric implications of inter- and intrafractional prostate positioning errors during tomotherapy: comparison of gold marker-based registrations with native MVCT. Strahlenther Onkol. 2017;193:700–706.
- Tanaka O, Komeda H, Iida T, et al. Fiducial marker for prostate radiotherapy: comparison of 0.35- and 0.5-mm-diameter computed tomography and magnetic resonance images. Radiol Med. 2017;122:204–207.
- Choong ES, Hruby G, Yang J, et al. 78Gy with fiducial marker image-guided radiotherapy in prostate cancer: single center analysis of 301 patients. Asia Pac J Clin Oncol. 2017;13:e356–e363.
- Walker A, Liney G, Metcalfe P, et al. MRI distortion: considerations for MRI based radiotherapy treatment planning. Australas Phys Eng Sci Med. 2014;37:103–113.
- Foltz WD, Porter DA, Simeonov A, et al. Readout-segmented echo-planar diffusion-weighted imaging improves geometric performance for image-guided radiation therapy of pelvic tumors. Radiother Oncol. 2015;117:525–531.
- Ciardo DJ-FB, Petralia G, Giorgia T, et al. Multimodal image registration for the identification of dominant intraprostatic lesion in high-precision radiotherapy treatments. submitted, not yet published. 2017. British Institute of Radiology.
- Gurney-Champion OJ, Lens E, van der Horst A, et al. Visibility and artifacts of gold fiducial markers used for image guided radiation therapy of pancreatic cancer on MRI. Med Phys. 2015;42:2638–2647.
- Tenhunen M, Korhonen J, Kapanen M, et al. MRI-only based radiation therapy of prostate cancer: workflow and early clinical experience. Acta Oncol. 2018;28:1–6.
- Bossart EL, Stoyanova R, Sandler K, et al. Feasibility and initial dosimetric findings for a randomized trial using dose-painted multiparametric magnetic resonance imaging-defined targets in prostate cancer. Int J Radiat Oncol Biol Phys. 2016;95:827–834.
- Maspero M, van den Berg CAT, Zijlstra F, et al. Evaluation of an automatic MR-based gold fiducial marker localisation method for MR-only prostate radiotherapy. Phys Med Biol. 2017;62:7981–8002.
- Hamdan I, Bert J, Rest CCL, et al. Fully automatic deformable registration of pretreatment MRI/CT for image-guided prostate radiotherapy planning. Med Phys. 2017;44:6447–6455.
- Huang K, Cao Y, Baharom U, et al. Phantom-based characterization of distortion on a magnetic resonance imaging simulator for radiation oncology. Phys Med Biol. 2016;61:774–790.
- Rudat V, Nour A, Hammoud M, et al. Image-guided intensity-modulated radiotherapy of prostate cancer: analysis of interfractional errors and acute toxicity. Strahlenther Onkol. 2016;192:109–117.
- Engels B, Soete G, Gevaert T, et al. Impact of planning target volume margins and rectal distention on biochemical failure in image-guided radiotherapy of prostate cancer. Radiother Oncol. 2014;111:106–109.
- Ballhausen H, Li M, Hegemann NS, et al. Intra-fraction motion of the prostate is a random walk. Phys Med Biol. 2015;60:549–563.
- Willoughby TR, Kupelian PA, Pouliot J, et al. Target localization and real-time tracking using the Calypso 4D localization system in patients with localized prostate cancer. Int J Radiat Oncol Biol Phys. 2006;65:528–534.
- Eckert F, Alloussi S, Paulsen F, et al. Prospective evaluation of a hydrogel spacer for rectal separation in dose-escalated intensity-modulated radiotherapy for clinically localized prostate cancer. BMC Cancer. 2013;13:27.
- Muller AC, Mischinger J, Klotz T, et al. Interdisciplinary consensus statement on indication and application of a hydrogel spacer for prostate radiotherapy based on experience in more than 250 patients. Radiol Oncol. 2016;50:329–336.