
Abstract
Background: To assess the impact of training and interprofessional collaboration on the interobserver variation in the delineation of the lung gross tumor volume (GTVp) and lymph node (GTVln).
Material and methods: Eight target volume delineations courses were organized between 2008 and 2013. Specialists and trainees in radiation oncology were asked to delineate the GTVp and GTVln on four representative CT images of a patient diagnosed with lung cancer individually prior each course (baseline), together as group (interprofessional collaboration) and post-training. The mean delineated volume and local standard deviation (local SD) between the contours for each course group were calculated and compared with the expert delineations.
Results: A total 410 delineations were evaluated. The average local SD was lowest for the interprofessional collaboration (GTVp = 0.194 cm, GTVln = 0.371 cm) followed by the post-training (GTVp = 0.244 cm, GTVln = 0.607 cm) and baseline delineations (GTVp = 0.274 cm, GTVln: 0.718 cm). The mean delineated volume was smallest for the interprofessional (GTVp = 4.93 cm3, GTVln = 4.34 cm3) followed by the post-training (GTVp = 5.68 cm3, GTVln = 5.47 cm3) and baseline delineations (GTVp = 6.65 cm3, GTVln = 6.93 cm3). All delineations were larger than the expert for both GTVp and GTVln (p < .001).
Conclusion: Our findings indicate that image interpretational differences can lead to large interobserver variation particularly when delineating the GTVln. Interprofessional collaboration was found to have the greatest impact on reducing interobserver variation in the delineation of the GTVln. This highlights the need to develop a clinical workflow so as to ensure that difficult cases are reviewed routinely by a second radiation oncologist or radiologist so as to minimize the risk of geographical tumor miss and unnecessary irradiation to normal tissue.
Introduction
Interobserver variation in the delineation of the gross tumor volume (GTV) remains one of the major sources of uncertainty in radiotherapy treatment planning for lung cancer [Citation1]. Various factors have been found to contribute for this variation including technical limitations of imaging, tumor position within the lung, as well as lack of delineation protocols, training and experience [Citation1–5].
Although computed tomography (CT) provides good visualization of the patient’s internal anatomy, the exact borders between the primary tumor (GTVp), and surrounding soft tissue can sometimes be difficult to distinguish leading to a large interobserver variation. Discriminating between positive and negative lymph nodes can also be very difficult and eventually this may lead to a different interpretation of the tumor stage and ultimately a different clinical judgement to what should be included in the GTVln [Citation6].
In order to improve the accuracy of the GTV delineation, 18F-fluorodeoxyglucose positron emission computed tomography (FDG PET-CT) is nowadays routinely used for radiotherapy treatment planning [Citation7]. The use FDG PET-CT has been found to improve the staging accuracy when compared with CT alone by facilitating the identification of positive lymph nodes [Citation6,Citation8]. Furthermore, numerous auto and semi-autosegmentation tools have been developed to quantify tumor activity and therefore facilitate the delineation of lung cancer reducing the interobserver variation in the definition of the GTV [Citation7]. However, to date, there is still no consensus on which auto-segmentation tool to use for the delineation of lung tumors [Citation9–11].
With the introduction of high precision intensity-modulated radiotherapy (IMRT) there is an increasing need for reducing the interobserver variation for target volume definition [Citation12]. Furthermore, with the increased use of multimodality imaging, radiation oncologists may benefit from consulting with radiologists and/or nuclear medicine physician to delineate the tumor [Citation13–15]. This highlights the need to develop international training programs and protocols to facilitate collaboration between different professional groups working across different centers.
To tackle this issue, in 1999, the European society for therapeutic radiology and oncology (ESTRO) started courses on target volume delineations [Citation16,Citation17]. Here we report on 410 delineations for a single lung cancer case that was consistently used within one software system for courses delivered between 2008 and 2013. During this time period, a total of 8 courses were delivered in 8 cities worldwide. The courses were targeted to all radiation oncology specialists and trainees worldwide involved in radiotherapy treatment planning including radiation oncologists, radiologists, radiotherapy technologists, and physicists.
The aim of this study was to assess the effectiveness of training and interprofessional collaboration in reducing the interobserver variation in the delineation of lung tumors. The objectives of the study were to;
Develop a training course for target volume delineation in lung cancer through the use of an electronic platform.
Determine the interobserver variation in the delineation of the GTV of the primary tumor (GTVp) and lymph nodes (GTVln) for a lung cancer patient for a large number of observers.
Assess the impact of interprofessional collaboration and training on the interobserver variability in lung cancer delineations.
Identify any areas for improving future training programs in target volume delineations.
Material and methods
A radiation oncologist and a radiologist, experienced in radiotherapy treatment planning, were appointed by ESTRO teachers, referred to as experts here, to develop the training program.
Development of the training program
The experts selected a clinical case of a patient diagnosed with a cT2aN2M0 non-small cell lung cancer (NSCLC) (Supplementary Data 1). The contrast-enhanced CT images obtained for treatment planning were reconstructed using 3 mm image thickness. A diagnostic FDG PET-CT and CT were also acquired. In-house software called WorldMatch [Citation18] was used to perform a bony rigid image registration of these images to the planning CT. These data were anonymised and loaded on big-brother [Citation2], a custom-developed contouring software developed at the Netherlands Cancer Institute (Supplementary Data 2). In this tool, the FDG PET-CT was displayed in gray scale next to the planning CT with a linked cursor. Level and window settings were selected to depict the highest uptake in the tumor without any saturation within the tumor region.
The two experts independently and manually delineated the GTVp and GTVln on the CT images of this patient and their delineations were compared. Due to the limited time available for contouring during these courses, the experts selected four axial CT images from the data set (38, 44, 48 and 50) from the complete CT examination to be used during the on-site training program. For the purpose of the study, the delineation of the radiation oncologist was used as a reference contour, relative to which the local standard deviation of observer contours was calculated. These images were chosen because they were deemed to be particularly challenging to delineate, being located in the cranial or caudal part of the GTV or at the level of metastatic lymph nodes [Citation19] (Supplementary Data 3). The data collection was then performed in three phases.
Phase 1: baseline data collection
All participants who enrolled on the ESTRO contouring course were contacted via email and provided with a web link and instructions to download the contouring software, delineation protocol, imaging data, radiological and clinical details of the case presented. For the courses held between 2008 and 2009, the participants were instructed to delineate the GTVp, GTVln and clinical target volume (CTV). During these courses, it was noted that these instructions were not clear enough. Many participants contoured the CTV without having delineated the GTVln first while others labeled the GTVln as CTV. To overcome this misunderstanding, instructions were rewritten more clearly for the subsequent courses. The participants were explicitly instructed to delineate the GTVp and GTVln separately on all CT slices and were asked to use the pre-set window lung (i.e., window level: –550 HU and window width: 750 HU) for the GTVp and the mediastinum window (i.e., window level: 70 HU and window width: 300 HU) to delineate the GTVln (Supplementary Data 1) but they could not change the window settings for the FDG PET-CT. The participants were asked to submit their delineations before the start of the course to the course organizers via email.
Phase 2: interprofessional collaboration
The participants were divided into 7 to 10 groups, depending on the total number of participants and the number of rooms available at the course venues. The mean number of participants per group was 10 and ranged from 7 to 30. The group consisted of 70% radiation oncologists (and trainees), 20% radiologists and 10% radiographers and physicist. Each group appointed two participants; one to operate the computer and one to moderate the discussion. All members reviewed the delineations in progress on a big screen and proposed amendments to the contour until a consensus was reached. The final consensus delineation is now described in the manuscript as interprofessional. The participants were allowed 3.5 h to discuss four cases (this lung case, a head-and-neck case, prostate case and a brain case). Here only the lung case is reported. Due to time constraints, during this session the participants were asked to delineate only the four CT images, selected by the experts.
Phase 3: post-training
Following the workshops, the participants were provided with training by the two experts. The training was a part of the course program and consisted of 2.5 h of lectures describing the anatomy and techniques used to define the GTV. At the end of the workshop, the contours delineated by the experts were presented and discussed in detail in comparison with the delineations performed at home (BL) and in the groups. Two weeks after completion of the course the participants were asked to individually delineate the GTVp and GTVln as homework and submit their delineations again.
Data analysis
All the delineated contours were uploaded on the CT scan. The percentage number of participants delineating the GTVp and GTVln on the four CT images was calculated.
In-house software [Citation2] was used to measure the delineated volume (cm3) on each CT image for all the delineations. The mean delineated volume for the baseline, interprofessional collaboration and post-training delineations were calculated first for each individual course and then for all the courses overall.
To measure the interobserver variation for each group (local SD) was calculated at various points using the software described by Steenbakkers et al. [Citation2]. For this analysis, the software measures the distance for all participants at various points from either the median contour generated from all observers or a pre-defined contour defined by the user. For our study, the radiation oncologist contour was used to calculate the local SD. The analysis is insensitive to the choice of reference contour as only the SD of observer variation is reported, not the mean. The root mean square over all measurements was then used to calculate the average local SD for each course group.
A histogram showing the distribution of SD over the percentage tumor surface area (SD/area) was plotted for both GTVp and GTVln for the baseline, interprofessional collaboration and post-training groups and compared. A larger percentage tumor surface area with a larger SD indicates a larger interobserver variation. Lung tumor regions with a large SD were localized on the CT images so as to identify any factors that could lead to increased interobserver variation ().
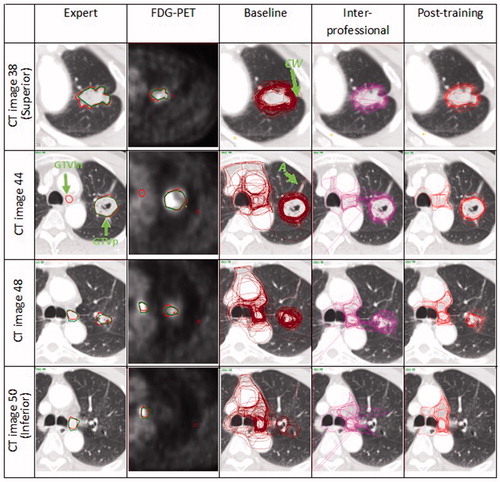
Figure 1. Expert delineations (radiation oncologist in red and radiologist in green) compared with the baseline, interprofessional and post-training delineations for the courses held in Tours 2009 on the 4 CT images selected by the expert. Note that for the GTVp the interprofessional and post-training delineations had a lower interobserver variation particularly for regions with atelectasis (A) and chest wall (CW). The outlier (O) on the interprofessional delineations could be related to lack of familiarity with using the delineation software. For the GTVln, there was a significant improvement for the interprofessional and post-training delineations as most participants relied more on the FDG PET-CT and included only the involved lymph nodes in the delineations. Another factor leading to interobserver variation when delineating the GTVln was that while some participants outlined only the active lymph node on the FDG PET-CT, other participants delineated the lymph node station. (Refer to online version for colored images).
Various metrics have been developed to assess interobserver variation in target volume delineation such as the conformity index which measures the degree of volume overlap between different contours. However, the method is a relative measure and does not give any information on how contours may vary quantitatively in size, shape or location in absolute terms and therefore it was not used in our study [Citation20].
Statistical analysis
All the data were analyzed using the statistical software SPSS version 20 and a p-value of .05 was deemed to be statistically significant. Based on the normality of samples using the Shapiro–Wilk test, the One Sample Wilcoxon signed-rank test was used to compare the overall volumes delineated by the baseline, interprofessional collaboration and post-training with the average expert delineated volume while the independent Sample Kruskal–Wallis test was used to compare the delineated volume and SD/area distribution between the baseline, interprofessional and post-training delineations for all courses.
Results
Evaluation of expert delineations
The overall maximum distance between the two expert contours was very small 0.094 cm and 0.080 cm for the GTVp and GTVln, respectively (). The total volume delineated by the radiologist on the 4 CT images was smaller when compared with the oncologist’s delineation for the GTVp (3.33 cm3 versus 3.76 cm3) and slightly larger for the GTVln (0.77 cm3 versus 0.79 cm3).
The experts agreed that were was no GTVp visible on CT image 50 and no GTVln visible on CT image 38. On CT image 44 only the radiation oncologist identified the GTVln ().
Number of delineations analyzed
A total of 410 delineations were collected. The data for the baseline and post-training delineation were not available for courses held between 2011 and 2013 since these delineations were performed on incompatible software and therefore not available for analysis. Not all participants completed the delineations following the course and from those participants who submitted the images, not all of them delineated the GTVp and GTVln on all four CT images ().
Table 1. Total number of delineations evaluated for each course and percentage number of participants delineating the GTVp and GTVln on CT images; 38, 44, 48 and 50.
Volume analysis
The combined mean delineated GTVp volume on the four CT images was 6.65 cm3, 4.93 cm3 and 5.68 cm3 while for the GTVln this was 6.93 cm3, 4.34 cm3 and 5.47 cm3 for the baseline, interprofessional collaboration and post-training delineations, respectively (). For all courses, the mean delineated GTVp volume was larger for the baseline delineations followed by the post-training and interprofessional delineations (). For the GTVln, the mean delineated volume was also larger for the baseline delineations followed by the interprofessional and post-training delineation for all courses except for the course held in Tours 2009. These volumes were significantly larger (p > .001) than the expert delineations but the difference between the baseline, interprofessional and post-training delineations was not significant for both GTVp (p = .858) and GTVln (p = .393). The volumes delineated for the initial 4 course courses were larger than the delineated volumes for the later courses for the GTVln, while it remained constant for the GTVp ().
Figure 2. Mean delineated volume and SD for the baseline, interprofessional and post-training group for all courses.
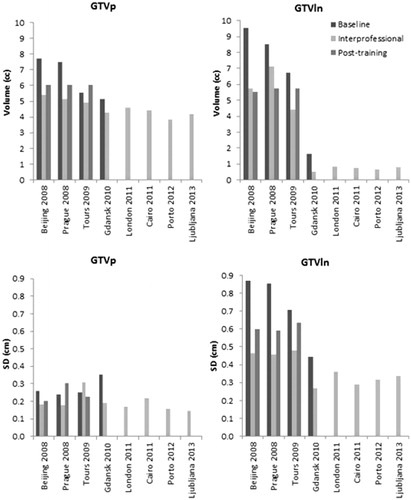
Table 2. Mean delineated volume and mean local SD for GTVp and GTVln for the baseline, interprofessional collaboration and post-training on the 4 CT images.
Interobserver variation
The average local SD was lowest for the interprofessional collaboration followed by the post-training and baseline delineations (). This result was consistent for all courses for both GTVp and GTVln except for the GTVp course held in Tours 2009 as shown in .
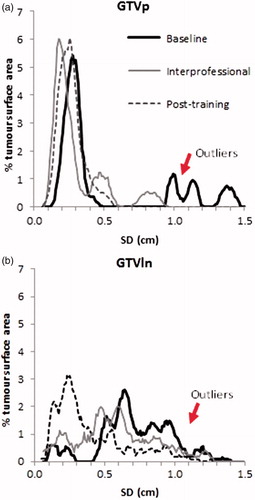
The SD/area distribution for the baseline delineations was more skewed toward the higher SD indicating a higher interobserver variation when compared with the interprofessional collaboration and post-training delineations for both GTVp and GTVln (). There was no significant difference between the baseline, interprofessional collaboration and post-training SD/area histogram for both GTVp (p = .129) and GTVln (p = .462).
Figure 3. Distribution of SD of the baseline, interprofessional collaboration and post-training delineations over the radiation oncologist’s delineated tumor surface area for the GTVp and GTVln.
Visual analysis
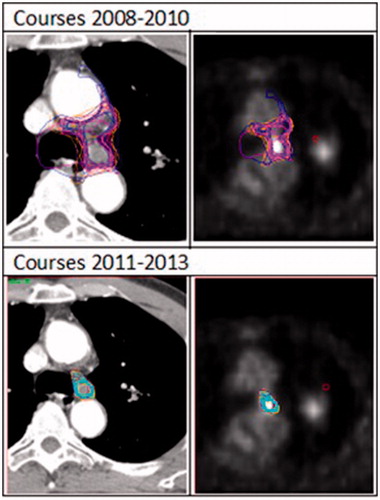
Lung tumor regions with atelectasis were more prone to interobserver variation as some participants included this region in the delineation. However, following the workshop and training the observer consistently excluded this region (). With regards to the GTVln some participants relied only on the FDG PET-CT and included only the lymph node with a high FDG uptake, some participants included the lymph node station only, while others included all the mediastinal lymph nodes eventually leading to a very large interobserver variation. However, for the interprofessional collaboration and post-training all participants excluded the mediastinal lymph nodes (). For the last four courses, an increased reliance on the FDG PET-CT was noted as the participants delineated only the lymph node with a high FDG uptake leading to a smaller delineated volume and less interobserver variation ().
Figure 4. Comparison between the interprofessional collaboration GTVln delineations on CT image 48 between courses held between 2008 and 2010 and courses held between 2011 and 2013. Note an increased reliance on the FDG PET-CT images for the later course leading to a lower interobserver variation.
Discussion
The aim of this study was to evaluate the impact of interprofessional collaboration and training on the interobserver variation in the definition of the GTVp and GTVln for a lung tumor. A total of 410 delineations were analyzed from participants worldwide. Studies evaluating interobserver variability with such a large number of participants are limited. The key factor that made this large scale study possible was the development of contouring software that allowed the participants to perform the delineations anywhere at their convenience. Although, it is important to acknowledge that these data are based on only four CT images of one patient, the large amount of participants in this study provides a better insight on how an online platform can be used to develop strategies to quantify and reduce interobserver variation in the delineation of lung tumors. Furthermore, it also shows how this platform can be used to facilitate interprofessional collaboration across different institutions worldwide. This study reports on the application of the first tool developed for this purpose that was used for teaching as early as 2003 and is still used and developed to date albeit in different courses.
This study identified an overall interobserver variation of 0.274 cm for the baseline group for the GTVp comparable to an overall SD of 0.33 cm reported by Steenbakkers et al. [Citation19] for tumors surrounded by lung tissue. Although the difference was not statistically significant the baseline group had a larger tumor surface area with a SD larger than 1 cm. GTVp regions corresponding to large SD were located in lung tumor regions surrounded by atelectasis and chest wall ().
Consistent with other studies a large interobserver variation was reported when delineating the GTVln particularly for the baseline delineations. Steenbakkers et al. [Citation8] reported a much larger SD for the GTVln (0.82 cm). In our study, the mean local SD for the GTVln in the baseline group was 0.72 cm. Furthermore, 51% of participants failed to identify the GTVln on CT image 48 and 50. The difficulty outlining GTVln is obvious on image 44 () whereby even the experts disagreed on whether or not the lymph node in this region is involved even with FDG PET-CT images as supplementary information. Another contributing factor could have been that the written guidelines provided for the courses before 2009 were not sufficiently precise to instruct the participants to first delineate GTVp and GTVln, and only then the CTV as indicated by the International commission of radiation units and measurements guidelines [Citation13]. The percentage number of participants delineating the GTVln increased after 2009 coinciding with a change in instructions.
As shown in the study by Fitton et al. [Citation19] the most cranial and caudal aspect of the tumor tends to be harder to delineate leading to a larger observer variation. Therefore, the CT slices selected for the delineations were located in the most craniocaudal aspect of the GTVp and GTVln. An interesting finding that emerged from this study was that 13% of participants in the baseline group identified the presence of the GTVp on CT image 50 and 1% of participants identified the presence of the GTVln on CT image 38 probably influenced by the instructions provided.
The most important finding of this study was that interprofessional collaboration had the largest impact in reducing the interobserver variation in target volume delineation particularly for the GTVln. The volume delineated for the GTVp was also reduced and this could indicate that the participants were more certain of their delineations after consultation with peers. Furthermore, the number of participants identifying the positive lymph nodes increased from 49% in baseline group to 77% in the Interprofessional collaboration group while the number of false delineations on CT image 50 and 38 decreased as shown in . These findings highlight the need to develop joint training courses to facilitate collaboration between radiation oncologists, radiologist and/or nuclear medicine physician to improve target volume delineation for lung cancer. Additional training may also be required following the provision of the courses as the lessons learnt during training may not necessarily translate into an immediate change in routine clinical practice. In view of this Konert et al. [Citation4] suggests that multiple training courses maybe required to achieve the delineation standards. In order to assess the quality of the delineation following training, a multicentre quality assurance review program focused on delineations needs to be established. The need to peer review target volume delineations has also been recognized by The Royal College of Radiologists (RCR) [Citation21] through the publication of peer review guidelines that aim at standardizing these practices across the United Kingdom.
This study has some limitations that have to be acknowledged. Following the courses only 20% of the participants submitted the delineations, similar to other reported training studies [Citation17]. We are aware that this may have biased our results. As an example, participants who still felt unsure after completing the course may have been less prone to submit their post-training delineations than those who were more confident. On the other hand, the most experienced participants may have opted to not perform the delineations again. However, if the latter was the case the interobserver variation would have been larger than the baseline delineation if training did not have any impact on the participants. It is also important to note that a low response rate following training is a common problem in online delineation courses as noted by Caravatta et al. [Citation22]. This implies that incentives need to be provided to the participants to complete the delineations post training for example by providing certification following the completion of the course.
The reduction in interobserver variation compared with the baseline in the post-training group could have occurred as result of remembering the discussions for that specific case and may not reflect the ability of the participants to apply improved skills in contouring lung tumors more generally. Despite of this possibility, the performance of the interprofessional collaboration delineations was better than the post-training indicating that not all participants in the post-training group remembered the discussions held during the workshop for the case. On the other hand it is also important to acknowledge that improvements in the performance in the contouring process for the interprofessional setting could have been due to the presence of more experienced doctor with a stronger personality rather than a truly collaborative frame.
Furthermore, the participants may have not been familiar with the software used for the delineations and this could potentially explain the small number of outliers. This suggests that training on the contouring software used needs to be provided prior performing the delineations. In this study we focused on manual delineation skills. It would be interesting to study the effect of auto-segmentation tools based on SUV or CT in the future, as they might reduce observer variation in tumor delineation [Citation23–25].
In this study, the participants’ professional background and their level of experience in delineating lung tumors was not recorded. These two factors could have a significant impact on interobserver variation. According to a study by Giraud et al. [Citation26] radiologists tended to delineate smaller volumes than radiation oncologists. Junior physicians, regardless of their specialty, also tended to delineate smaller than senior physicians, especially in complex cases. This was also observed in our study whereby, the expert radiation oncologist delineated a lymph node as GTVln on CT image 44, which his radiologist fellow considered not involved. In view of this it is recommended that for future courses the participants would have to document their professional background on the software to allow comparison of the delineations based on the professional group. Regions prone to disagreement could then be identified and discussed following the training course through the use of a web-based teaching session. The provision of feedback to participants on their performance both quantitative and also from peers could encourage participants to complete the delineations following the course and promote collaboration between the different professional groups. Participation following delineation courses could also be improved by providing professional accreditation following the completion of the post-training delineations
In this study the participants were provided only with written guidelines for delineation including radiology reports. For future studies, delineation atlases could also be provided to participants so as to reduce interpretational differences of what should be included in the GTV. The delineation data gathered from these courses could then be used to improve these atlases with the aim to further reduce the interobserver variation in the delineation of the GTV [Citation27,Citation28].
Conclusion
With the introduction of multimodality imaging in radiotherapy treatment planning the need for more training is paramount to ensure consistency in the delineation of the GTV. This study shows that training can reduce the interobserver variation in the definition of the GTV. However, our training program can be improved further by providing the participants with more clear guidelines and individual feedback on their delineations at the end of the course followed by certification. Overall, the interprofessional delineations had the lowest interobserver variation. This highlights the need to include interprofessional discussion during delineation workshops as they form an important part of the learning process. Furthermore peer review of target volume delineations should also be included in routine clinical practice so as to reduce the risk of errors and to improve the accuracy of target volume delineation by providing continuous professional development.
Supplemental Material
Download MS Word (805.7 KB)Disclosure statement
The authors report no conflict of interest.
Related Research Data
References
- Vinod SK, Jameson MG, Min M, et al. Uncertainties in volume delineation in radiation oncology: a systematic review and recommendations for future studies. Radiother Oncol. 2016;121:169–179.
- Steenbakkers RJHM, Duppen JC, Fitton I, et al. Observer variation in target volume delineation of lung cancer related to radiation oncologist–computer interaction: a ‘Big Brother’ evaluation. Radiother Oncol. 2005;77:182–190.
- Aznar MC, Persson GF, Kofoed IM, et al. Irregular breathing during 4DCT scanning of lung cancer patients: is the midventilation approach robust? Phys Medica. 2014;30:69–75.
- Konert T, Vogel W, MacManus M, et al. Multiple training interventions significantly improves PET/CT based lung cancer radiotherapy target volume delineation following an IAEA based delineation protocol. Radiother Oncol. 2016;121:39–45.
- Pepek JM, Marks LB, Berry MF, et al. Accuracy of positron emission tomography in identifying hilar (N1) lymph node involvement in non-small cell lung cancer: implications for stereotactic body radiation therapy. Pract Radiat Oncol. 2015;5:79–84.
- Li X, Zhang H, Xing L, et al. Mediastinal lymph nodes staging by 18F-FDG PET/CT for early stage non-small cell lung cancer: a multicenter study. Radiother Oncol. 2012;102:246–250.
- Lu P, Sun Y, Sun Y, et al. The role of (18)F-FDG PET/CT for evaluation of metastatic mediastinal lymph nodes in patients with lung squamous-cell carcinoma or adenocarcinoma. Lung Cancer. 2014;85:53–58.
- Steenbakkers RJHM, Duppen JC, Fitton I, et al. Reduction of observer variation using matched CT-PET for lung cancer delineation: a three-dimensional analysis. Int J Radiat Oncol. 2006;64:435–448.
- Konert T, Vogel W, MacManus MP, et al. PET/CT imaging for target volume delineation in curative intent radiotherapy of non-small cell lung cancer: IAEA consensus report 2014. Radiother Oncol. 2015;116:27–34.
- Truong MT, Kovalchuk N. Radiotherapy planning. PET Clin. 2015;10:279–296.
- Valentini V, Boldrini L, Damiani A, et al. Recommendations on how to establish evidence from auto-segmentation software in radiotherapy. Radiother Oncol. 2014;112:317–320.
- Jameson MG, Kumar S, Vinod SK, et al. Correlation of contouring variation with modeled outcome for conformal non-small cell lung cancer radiotherapy. Radiother Oncol. 2014;112:332–336.
- Lo AC, Liu M, Chan E, et al. The impact of peer review of volume delineation in stereotactic body radiation therapy planning for primary lung cancer: a multicenter quality assurance study. J Thorac Oncol. 2014;9:527–533.
- Song Y, Chan M, Burman C, et al. Inter-modality variation in gross tumor volume delineation in 18FDG-PET guided IMRT treatment planning for lung cancer. Conf Proc IEEE Eng Med Biol Soc. 2006;1:3803–3806.
- Hanna GG, Carson KJ, Lynch T, et al. 18F-fluorodeoxyglucose positron emission tomography/computed tomography-based radiotherapy target volume definition in non-small-cell lung cancer: delineation by radiation oncologists vs. joint outlining with a PET radiologist? Int J Radiat Oncol Biol Phys. 2010;78:1040–1051.
- De Bari B, Dahele M, Palmu M, et al. Short interactive workshops reduce variability in contouring treatment volumes for spine stereotactic body radiation therapy: experience with the ESTRO FALCON programme and EduCaseTM training tool. Radiother Oncol. 2018;127:150–153.
- Eriksen JG, Salembier C, Rivera S, et al. Four years with FALCON - an ESTRO educational project: achievements and perspectives. Radiother Oncol. 2014;112:145–149.
- van Herk M, De Jaeger K, de Munck J, et al. A delineation system for N modalities — software aspects. Use Comput. Radiat. Ther., Berlin, Heidelberg: Springer Berlin Heidelberg; 2000, p. 73–75.
- Fitton I, Steenbakkers RJHM, Gilhuijs K, et al. Impact of anatomical location on value of CT-PET co-registration for delineation of lung tumors . Int J Radiat Oncol Biol Phys. 2008;70:1403–1407.
- Jameson MG, Holloway LC, Vial PJ, et al. A review of methods of analysis in contouring studies for radiation oncology. J Med Imaging Radiat Oncol. 2010;54:401–410.
- The Royal College of Radiologists. Radiotherapy target volume definition and peer review RCR guidance. 2017.
- Caravatta L, Macchia G, Mattiucci G, et al. Inter-observer variability of clinical target volume delineation in radiotherapy treatment of pancreatic cancer: a multi-institutional contouring experience. Radiat Oncol. 2014;9:198.
- van Baardwijk A, Bosmans G, Boersma L, et al. PET-CT–based auto-contouring in non–small-cell lung cancer correlates with pathology and reduces interobserver variability in the delineation of the primary tumor and involved nodal volumes. Int J Radiat Oncol. 2007;68:771–778.
- Bayne M, Hicks RJ, Everitt S, et al. Reproducibility of “intelligent” contouring of gross tumor volume in non–small-cell lung cancer on PET/CT images using a standardized visual method. Int J Radiat Oncol. 2010;77:1151–1157.
- Petit SF, Aerts HJWL, van Loon JGM, et al. Metabolic control probability in tumour subvolumes or how to guide tumour dose redistribution in non-small cell lung cancer (NSCLC): an exploratory clinical study. Radiother Oncol. 2009;91:393–398.
- Giraud P, Elles S, Helfre S, et al. Conformal radiotherapy for lung cancer: different delineation of the gross tumor volume (GTV) by radiologists and radiation oncologists. Radiother Oncol. 2002;62:27–36.
- Radiotherapy Oncology Group. Lung Atlas: RTOG 1106 Target Atlas n.d. https://www.rtog.org/CoreLab/ContouringAtlases/LungAtlas.aspx (accessed March 22, 2018).
- Cui Y, Chen W, Kong F-M, et al. Contouring variations and the role of atlas in non-small cell lung cancer radiation therapy: analysis of a multi-institutional preclinical trial planning study. Pract Radiat Oncol. 2015;5:e67–e75.