
Abstract
Background: Colorectal capsule endoscopy (CCE) is a potentially valuable patient-friendly technique for colorectal cancer screening in large populations. Before it can be widely applied, significant research priorities need to be addressed. We present two innovative data science algorithms which can considerably improve acquisition and analysis of relevant data on colorectal polyps obtained from capsule endoscopy.
Material and methods: A fully paired study was performed (2015–2016), where 255 participants from the Danish national screening program had CCE, colonoscopy, and histopathology of all detected polyps. We developed: (1) a new algorithm to match CCE and colonoscopy polyps, based on objective measures of similarity between polyps, and (2) a deep convolutional neural network (CNN) for autonomous detection and localization of colorectal polyps in colon capsule endoscopy.
Results and conclusion: Unlike previous matching methods, our matching algorithm is able to objectively quantify the similarity between CCE and colonoscopy polyps based on their size, morphology and location, and provides a one-to-one unequivocal match between CCE and colonoscopy polyps. Compared to previous methods, the autonomous detection algorithm showed unprecedented high accuracy (96.4%), sensitivity (97.1%) and specificity (93.3%), calculated in respect to the number of polyps detected by trained nurses and gastroenterologists after visualizing frame-by-frame the CCE videos.
Introduction
In vivo measurements and an accurate preoperative diagnosis of each colorectal polyp is essential for colorectal cancer (CRC) risk assessment and the selection of appropriate diagnostic pathway and treatment [Citation1]. In a conventional optical colonoscopic (OC) exam, the endoscopist assesses the size, morphology and position of each lesion. Histopathologic (HP) examination after polypectomy is used to exclude malignancy. Information gathered from OC and HP is used in patient CRC risk stratification and in the determination of subsequent surveillance intervals.
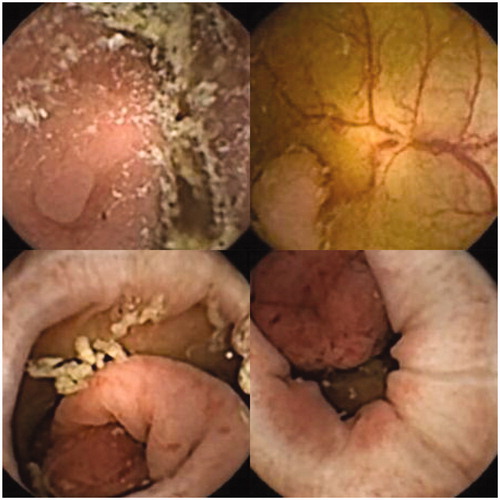
Colon capsule endoscopy (CCE) is a minimally invasive, patient-friendly endoscopic technique () [Citation2]. It is regarded as a potentially valuable alternative to OC [Citation3,Citation4], although the accuracy of polyp size estimations using CCE is uncertain [Citation5–8]. Before CCE can be applied for CRC screening in large populations, two significant research priorities need to be addressed: first, the development of an evidence-based decision-making tool able to predict HP size measurements, based upon CCE measurements, so that CCE can be reliably used in clinical settings to identify at-risk individuals. Second, the development of innovative schemes for autonomously discriminating endoscopic images based on the existence of polyps.
Figure 1. Colorectal polyps of different size, color and morphology.
Regarding the first research priority, the polyps measured using CCE, OC and HP are, from a statistical point of view, dependent samples, since each observation in one sample can be paired with an observation in the other samples, constituting matched pairs. Many of the resected specimens during OC are immediately retrieved for histologic diagnosis. Therefore, the polyps analyzed with OC and HP, can be easily and almost unequivocally, matched. However, in CCE, a polypectomy is not performed, and the matching of CCE and OC/HP polyp pairs is not straightforward. This decreases the power of the statistical comparisons of polyp features assessed by different methods. A one-to-one polyp matching is also necessary to build a predictive model that learns the relationships between CCE and HP measures.
Previous approaches for CCE-OC polyps matching have been limited to setting an arbitrary and rigid size threshold that results in a binary outcome: ‘matched’ or ‘not matched’, and do not provide a quantification of the similarity between polyps [Citation9,Citation10]. Therefore, more than one polyp may comply with the set criteria and it is not possible to ascertain which matched polyps are more likely to be true matches.
The second research priority in CCE is converting the tedious manual process of identifying polyps from CCE images, into a largely automatic operation. This is an extremely challenging task, due to the variable lighting, infrequent occurrence of polyps in a given CCE video, and the fact that colorectal polyps typically do not have common morphology, size, texture and color features. Previous studies addressing this goal, present noteworthy limitations, such as (1) overfitting i.e., models that have been tuned for a particular data; and may not yield accurate predictions for new observations, and (2) small sample size [Citation10].
In this study, we presented two innovative methods and algorithms in biomedical machine learning and data science addressing priority needs across the colorectal cancer screening research continuum. More specifically:
We propose a new algorithm able to objectively quantify the similarity between polyps, based on their size, location and morphology. We used this new algorithm to match CCE and OC/HP polyps from a fully paired clinical study, and compared polyp features of matched polyps.
We develop a deep learning algorithm based on convolutional neural networks (CNN) for autonomous detection and localization of colorectal polyps of any size or morphology. We then applied this new automatic detection method to data from the same study.
Material and methods
Study participants and sample size
A fully paired back to back study was carried out from spring 2015 to spring 2016, including 255 participants that were positive in the FIT from the national screening program in Denmark. First, the participants had a CCE investigation by a second-generation capsule endoscopy system (PillCam COLON 2). Polyps size, morphology and location were estimated from CCE recorded videos using the standard tool in the RAPID™ Software (Medtronic, Minneapolis, MN, USA). The day after CCE investigation, the endoscopists carried out an OC using a standardized colonoscope (Olympus) and estimated the in vivo polyp size, morphology and location. Only endoscopists with >2500 previous OC´s performed the OC’s. The endoscopist did not routinely use size-measurement tools. After polyp removal and formalin fixation, the postfixation size was measured by a pathologist. Observers were blinded for the results of the other assessments. In case polyps were seen in CCE but not in OC, the patient was offered a second OC with polypectomy. The polyps detected in the second OC were not used for CCE-OC polyp matching and comparison, but only to investigate the existence of false negatives in the first colonoscopy and ensure best possible treatment of the patient. The study was approved by the Local Ethics Committee (S20140141) and registered at clinicaltrials.gov (NCT02303756). At least 113 polyps need to be included in this observational study according to the sample size calculation based on the Pearson coefficient with a Type I error of 0.05, a Type II error of 0.1 (power 90%) and an expected correlation coefficient of 0.3.
The polyp matching algorithm
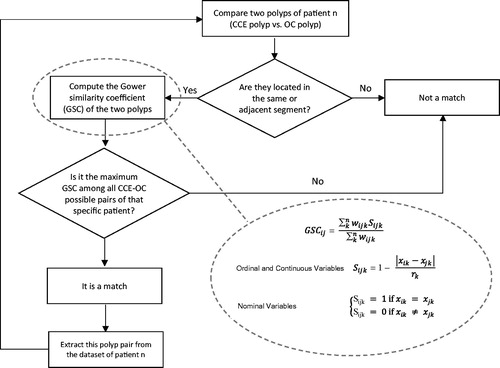
The Gower’s similarity coefficient (GSC) was used to quantify the similarity between polyp pairs [Citation11] (). Relative to the maximum possible absolute discrepancy between two pairs of observations (polyps), the GSC indicates the average absolute similarity between them. Therefore, GSC is a value that ranges from 0 (minimum similarity between polyps) to 1 (maximum similarity between polyps, i.e., identical polyps). For instance, a Gower similarity coefficient of 0.90 indicates that relative to the maximum possible absolute (unsigned) discrepancy between them, the observations agree within 90% of each other's values.
Figure 2. Outline of the matching algorithm and Gower similarity coefficient (GSC) equations. GSCij compares two cases i and j, Sijk denotes the contribution provided by the kth variable, rk is the range of values for the kth variable and wijk is 1 or 0 depending upon whether or not the comparison is valid for the kth variable.
The variables considered for similarity calculations and polyp matching were: size, location and morphology. Size is a quantitative variable, defined as the largest polyp diameter (in mm) assessed by CCE (SizeCCE), OC (SizeOC) and HP (SizeHP). Location is an ordinal variable defined as the segment of the colon (‘right’, ‘transverse’ or ‘left’) where the polyp is located, as assessed from CCE (LocCCE) and OC (LocOC). Polyp morphology was a categorical variable with five possible categories (pedunculated, broad-based, flat, cancer suspicion or unknown), assessed by CCE (MorphCCE) and OC (MorphOC).
The polyp matching algorithm was applied to those patients with at least one polyp detected both in CCE and in the first OC, to optimally pair each CCE polyp (characterized by SizeCCE, LocCCE and MorphCCE) with a OC/HP polyp (characterized by SizeHP, LocOC and MorphOC) detected in the first colonoscopy. According to the GSC definition, GSC = 1 is obtained when the two polyps are identical in size, location and morphology (SizeCCE = SizeHP, LocCCE = LocOC and MorphCCE = MorphOC); while GSC = 0 occurs between the two most dissimilar observations, which in our dataset correspond to the most extreme values for each variable in our dataset, i.e., SizeCCE = 1 mm, LocCCE = Left and MorphCCE = e.g., Pedunculated; vs. SizeHP = 40 mm polyp, LocOC = Right and MorphOC = Any not pedunculated morphology. By using these two extreme polyps features as the basis for calculating GSC for all patients, we scaled all values (for all patients) to a common range, which allows us to compare GSC among patients.
A code was programed in R language which first calculates all pairwise similarities (GSC) between observations (CCE and OC/HP polyps) for each of the patients and then optimizes polyp matching using an iterative algorithm (), as follows: for each patient, the program first identifies the CCE vs. OC/HP polyp pair located in same or adjacent segment and with the maximum Gower’s similarity coefficient, labels it as ‘polyp match’, and extracts this polyp pair from the dataset of the patient. Then, it carries out the same procedure iteratively for the remaining polyps. The matching algorithm runs automatically until all polyps of the patient are matched. The process was repeated for all patients.
We define the GSC matching threshold (GSCthreshold) as the minimum acceptable value for the GSC of matched polyps. That is, only polyp pairs with a Gower similarity higher than this threshold, will be considered a true match. We define the matching rate (MR) as the proportion of number polyps successfully matched, at a given matching threshold (Nmatch), with respect to the maximum number of potential matches (Nmatch-max). For each patient, the maximum number of polyp matches is the minimum number of polyps detected by either method.
After polyp matching, we carried out statistical paired comparisons of size (SizeCCE, SizeOC and SizeHP), morphology (MorphCCE and MorphOC) and location (LocCCE and LocOC) of the matched polyps. Polyp sizes were compared with paired t-tests on the matched polyp pairs. Polyp morphologies and locations were compared using McNemar’s comparison of dependent proportions for matched samples, where we calculated binomial probabilities for each category. If there was no association between the assessment method and the polyp morphology, we would expect the number of pairs where polyp was assessed as one morphology type in CCE (e.g., pedunculated) but was assessed as another morphology type (i.e., broad base, flat, cancer suspect or unknown) in OC (discordant type 1), to equal the number of pairs where polyp was assessed as that morphology type in OC (i.e., pedunculated) but was assessed as another morphology type (i.e., broad base, flat, cancer suspect or unknown) in CCE (discordant type 2). That is, Probtype1 = 0.5 and Probtype2 = 0.5 which indicates that it is equally probable to obtain disconcordant type 1 results and disconcordant type 2 results. Because there are multiple tests, we applied a Bonferroni adjustment (significance criterion was 0.05/(K − 1), since there are K − 1 independent tests, where K is the number of categories).
The autonomous polyp detection algorithm
For autonomous polyp detection from CCE images, we first tested five of the Convolutional Neural Network (CNN) architectures: AlexNet [Citation12], GoogLeNet [Citation13], ResNet50 [Citation14], VGG16 [Citation15] and VGG19 [Citation15]. These networks are trained on 1000 objects using millions of images and therefore have learned rich features of those objects. However, none of those objects are in nature, similar to colorectal polyps. Due to the limitations in training sample size, we used the pre-trained CNNs as initialization for transfer learning. As a starting point, we deployed AlexNet composed of 25 layers, 8 of them contain learnable weights featuring 5 convolutional and 3 fully connected layers. To build robustness to intra-class deformations and to avoid overfitting, we used Max-Pooling kernels of size 3 × 3, Rectified Linear Unit (ReLU) nonlinear activation function and dropout of 50%. The last fully-connected (FC) layer was replaced to output only two classes, namely ‘polyps’ and ‘no polyps’. To improve the network’s performance, we modified the network and deployed stochastic gradient descent with momentum (SGDM) as the optimization algorithm. The network was further trained for localization of colorectal polyps as R-CNN (region convolutional neural network) after the polyps were detected. The dataset containing images of both the mucosa of the large bowel without polyps and those containing colorectal polyps was augmented by rotating them randomly. To achieve both rotation and translation invariance, the images were randomly rotated and translated using data augmentation without affecting the contents or the size of the images.
The polyp detection algorithm was applied to the images from CCE videos with different grades of colon cleanliness, that contained at least one colorectal polyp (11,300 CCE images, 4800 of them contain colorectal polyps of various sizes and morphologies). We used rotation, cropping and random mirroring transformations to increase the effective size of our dataset by a factor of 5. These transformations do not affect polyp detection, since masses have no inherent orientation. We split the images randomly by patient into training, validation and testing sets (70%, 15% and 15% of the full dataset, respectively).
Results
Polyp matching
A total number of 131 patients (out of 255 patients) had at least one polyp detected in both CCE and OC. The total number polyps detected in these 131 patients was 375 (in CCE) and 331 (in OC). The polyp matching algorithm matched 168 CCE polyps with 168 OC polyps (the remaining polyps did not fulfill the fundamental requirement of being localized in the same or adjacent segment of the colon). The degree of similarity between these 168 polyp pairs is given by the GSC. The average GSC was 0.75 and the minimum was 0.38. Only 6 CCE-OC/HP polyps pairs were identical polyps (GSC = 1).
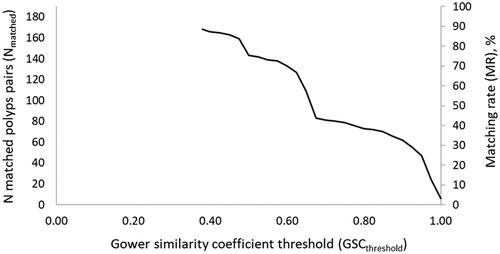
The maximum number of matches that could be potentially obtained in the 131 patients was Nmatch-max = 241. Polyps having missing information on one or more features (size, location and/or morphology) cannot be matched. The total number of polyps with complete data was 374 in the case of CCE (0.3% missing data) and 257 in the case of OC (22.4% missing data), and the Nmatch-max (excluding polyps with incomplete data) is 193. shows the number and percent of polyps successfully matched (matching rate, MR) at a given GSCthreshold. The MR is affected by the GSCthreshold. The more conservative we are regarding GSC (i.e., higher GSCthreshold), the lower the matching rate. When GSCthreshold = 0.38, MR = 87%. Increasing the minimum acceptable GSC for matched polyps (i.e., GSCthreshold) to 0.5 and 0.7, decreases the MR to 74% and 42%, respectively. Considering that only polyps that are identical in size, location and morphology (i.e., GSC = 1), can be true matches, results in a MR of only 3%.
Figure 3. Number of matched polyp pairs (Nmatch) and % of polyps successfully matched (matching rate, MR) as a function of Gower similarity coefficient threshold (GSCthreshold), i.e., the minimum acceptable value for the Gower similarity coefficient for two polyps to be considered a true match.
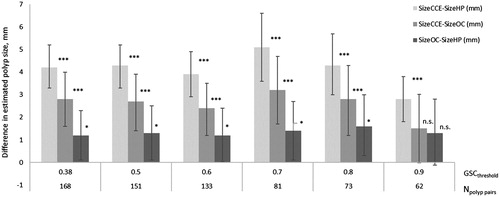
A statistical comparison of the matched polyps showed that the size of polyps estimated from CCE was significantly larger than the size estimated by HP, regardless of the GSC matching threshold (). CCE tended to overestimate the size of the polyps assessed by OC (140% of SizeOC). On average, OC also tended to overestimate HP size measurements (on average, 124% of SizeHP).
Figure 4. Paired comparison of CCE, OC and HP polyp sizes in matched polyps, at different GSC matching thresholds (GSCthreshold). GSCthreshold is the minimum acceptable value for the GSC of matched polyps. Npolyp pairs are the number of polyps pairs matched at each GSCthreshold.
Two morphology types (pedunculated and flat) were significantly associated with the method being used for morphology assessment (CCE vs. OC) (Supplementary material). An exact McNemar's test determined that there was a statistically significant difference in the proportion of pedunculated and flat polyps from CCE and from OC. In the case of GSCthreshold = 0.5 and morphology type ‘pedunculated’, there were 101 pairs with concordant assessments and 50 pairs with discordant assessments, where 42 pairs were discordant type 1 and 8 pairs discordant type 2. The corresponding probabilities (Probtype1 = 0.84 and Probtype2 = 0.16) were significantly different (p value = 1.164e–06). In the case of morphology type ‘flat’, there were 125 pairs with concordant assessments and 26 pairs with discordant assessments, all of them being discordant type 2 (Probtype1 = 0, and Probtype2 = 1), which were significantly different (p value = 2.98e–08). Therefore, the proportion of polyps that were assessed as pedunculated (as opposed to any other morphology) by CCE was higher than by OC; while the proportion of polyps that were assessed as flat (as opposed to any other morphology) by OC was higher than by CCE.
Polyp autonomous detection
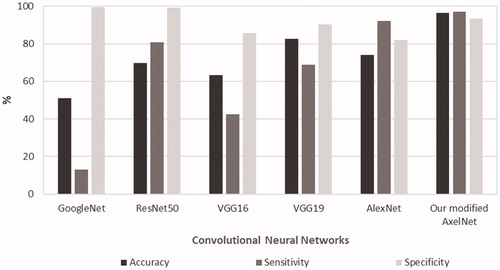
Accuracy, sensitivity and specificity calculated in respect to the manual polyp detection (i.e., images were analyzed frame-by-frame by trained nurses and gastroenterologists, who identified existing polyps), is shown in . Our modified AlexNet showed very high performance, superior to the other four networks, scoring an accuracy of 96.4%, a sensitivity of 97.1% and a specificity of 93.3%. Polyps missed were mainly polyps very small in size and therefore of limited clinical importance. Other cases of missed polyps were those images in which the polyps were extremely close to the camera. However, these polyps were detected by the detection algorithm in images taken immediately before and/or after.
Figure 5. Performance of the convolutional neural networks applied to the images from CCE videos in the screening population. Accuracy, sensitivity and specificity are calculated with respect to the manual polyp detection (i.e., images analyzed frame-by-frame by trained nurses and gastroenterologists, who identified existing polyps.)
Discussion
In this paper, we first describe a new algorithm to objectively quantify the similarity between polyps identified and characterized by CCE, OC and HP, based on their size, location and morphology. The new algorithm exhibits important advantages compared to previous matching methods. These former methods were based on setting a crisp boundary for the size, that results in a match either considered as ‘true’ or ‘not true’ [Citation9,Citation10]. This can easily become a problem when more than one OC polyp is labeled as a ‘true match’ to a specific CCE polyp. Unlike previous methods, our method is able to quantify the similarity between polyps, and capture ‘the degree to which a match is true’. This results in an injective function where every element of the first set (CCE polyps) has its own unique matching member in the second set (OC polyps). CCE endoscopic assessment of a lesion includes not only size, but also location and morphology. Another advantage of our algorithm is that it is not only polyp size, but also its location and morphology are used to characterize the polyps. Our algorithm is general, and can be easily extended to include additional polyp features for polyp characterization (such as neoplasia vs. hyperplasia), as more advanced endoscopic imaging modalities already existing in OC (such as narrow band imaging, able to differentiate between hyperplasic and adenomatous polyps) [Citation16], become available in CCE. It is likely that the neoplasia vs. hyperplasia (or other types of non-neoplasia) discrimination can also be achieved using ordinary light spectrum color pictures. One potential limitation of our method is that its higher accuracy comes at the cost of requiring information on the assessment of location and morphology of the polyp, and so it is important to avoid the existence of missing data regarding these features in the database.
Once the algorithm was developed, we applied it to match polyps in a screening population, and used the database of matched polyps to compare the polyp features (size, location and morphology) across methods. The degree of similarity between polyps was given by the GSC, where a value GSC = 0 indicates ‘completely dissimilar’ and a value GSC = 1 indicates ‘completely similar’. The higher GSCthreshold (i.e., the more conservative we are regarding what is the minimum acceptable GSC), the lower the matching rate (i.e., lower number of matched polyp pairs). In general terms, the differences of polyp features between CCE and OC/HP matched polyps were reduced, as the GSCthreshold increased. The selection of the optimal GSCthreshold requires a validation study where the true matches are known is required, which is not currently possible in a clinical setting.
The current ‘gold standard’ for polyp size is the histopathologic size. The size correlation between freshly retracted polyps and the formalin fixed polyps used for histopathological size estimation has been investigated by several authors. In general, it is accepted that the histopathological size is smaller than that of the fresh specimen, although this has been questioned and the size of this difference varies amongst publications [Citation17–20]. The accuracy of the outcomes of CCE in CRC screening should be investigated if this method is to be used to make decisions as to whether a patient should be referred to colonoscopy. Our study showed that, in general terms, CCE tended to overestimate the OC and HP size, and this overestimation was larger when compared to HP. The overestimation of CCE on the polyp size compared to OC assessments is in agreement with Spada et al. [Citation9], who demonstrated that substantial numbers of false positive CCE results are related to the assessment of polyps of <6 or <10 mm on OC, seen as ≥6 or ≥10 mm on CCE. Matched polyps were more likely to being assessed as ‘pedunculated’ in CCE (compared to OC) and more likely to be assessed as ‘flat’ in OC (compared to CCE). These differences in the morphology assessment may be due to the inflation of the colon during OC inspection, which may induce the polyps to appear more flattened in OC compared to CCE. The diameter (size) will also be affected by this difference because the size is measured by its largest diameter. As the polyp become flat during inflation in OC, the diameter increases in a plane parallel to the bowel wall.
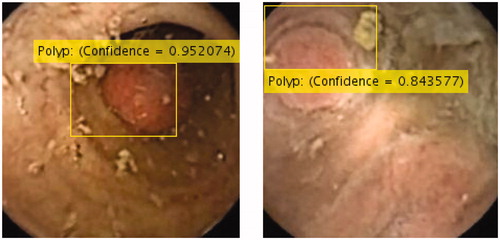
The second aim of our study was to propose a novel and autonomous end-to-end deep learning model to detect colorectal polyps of any size and morphology in CCE videos. We showed that our network architecture benefitting from the combination of data augmentation and transfer learning, overcame the ambiguity and lack of general task-independent rules for optimal feature selection common to medical computer vision tasks. Additionally, our method gave more interpretability to network predictions by studying the location of polyps with a measure of confidence in the findings (). The interpretability enables a smooth adoption of this method in clinical settings, paving the road for the deployment of this network. Our approach outperformed all other state-of-the-art results in polyp detection by a wide margin. The paramount results delivered for accuracy and sensitivity are of most importance, to minimize the number of cases (existing polyps) that are missed.
Figure 6. Polyp localization using region CNN deep learning detector and the confidence measure.
Presence of villous histology high-grade dysplasia or cancer are features that can occur irrespective of polyp size. However, large polyps are at significantly higher risk for such features. Given the low occurrence of larger polyp in screening populations, future works within the polyp matching scope involve carrying out a larger study which includes the necessary number instances of large polyps. The performance of the autonomous detection algorithm could be further enhanced by exploring other architectures based on ensemble learning, and integration of attention mechanisms, which are more difficult to train, but could provide even more concrete interpretability.
Supplemental Material
Download MS Word (34.4 KB)Disclosure statement
No potential conflict of interest was reported by the authors.
Additional information
Funding
Related Research Data
References
- van Heijningen EM, Lansdorp-Vogelaar I, Kuipers EJ, et al. Features of adenoma and colonoscopy associated with recurrent colorectal neoplasia based on a large community-based study. Gastroenterol. 2013;144:1410–1418.
- Eliakim R, Fireman Z, Gralnek IM, et al. Evaluation of the PillCam Colon capsule in the detection of colonic pathology: results of the first multicenter, prospective, comparative study. Endoscopy. 2006;38:963–970.
- Pilz JB, Portmann S, Peter S, et al. Colon Capsule Endoscopy compared to Conventional Colonoscopy under routine screening conditions. BMC Gastroenterol. 2010;10:66.
- Kobaek-Larsen M, Kroijer R, Dyrvig AK, et al. Back-to-back colon capsule endoscopy and optical colonoscopy in colorectal cancer screening individuals. Colorectal Dis. 2017:20;479–485.
- Spada C, Hassan C, Galmiche JP, et al. Colon capsule endoscopy: European Society of Gastrointestinal Endoscopy (ESGE) Guideline. Endoscopy. 2012;44:527–536.
- Rex DK, Boland CR, Dominitz JA, et al. Colorectal cancer screening: recommendations for physicians and patients from the U.S. multi-society task force on colorectal cancer. Am J Gastroenterol. 2017;112:1016–1030.
- Eliakim R, Yassin K, Niv Y, et al. Prospective multicenter performance evaluation of the second-generation colon capsule compared with colonoscopy. Endoscopy. 2009;41:1026–1031.
- Spada C, Hassan C, Barbaro B, et al. Colon capsule versus CT colonography in patients with incomplete colonoscopy: a prospective, comparative trial. Gut. 2015;64:272–281.
- Spada C, Hassan C, Munoz-Navas M, et al. Second-generation colon capsule endoscopy compared with colonoscopy. Gastrointest Endosc. 2011;74:581–589.
- Rex DK, Adler SN, Aisenberg J, et al. Accuracy of capsule colonoscopy in detecting colorectal polyps in a screening population. Gastroenterol. 2015;148:948–967.
- Gower JC. A general coefficient of similarity and some of its properties. Biometrics. 1971;27:857–871.
- Krizhevsky A, Sutskever I, Hinton GE. Imagenet classification with deep convolutional neural networks. In NIPS. Proceedings of the 25th International Conference on Neural Information Processing Systems (NIPS) (Lake Tahoe, NV, Dec. 2012), 1097–1105; 2012.
- Szegedy C, et al. Going deeper with convolutions. In Proceedings. IEEE Conference on Computational Visual Pattern Recognition 1–9. Conference: IEEE Conference on Computer Vision and Pattern Recognition (CVPR); Jun 07-12; Boston, MA; 2015.
- He K, Zhang X, Ren S, et al. Deep residual learning for image recognition. Conference: 2016 IEEE Conference on Computer Vision and Pattern Recognition (CVPR); Jun 27-30; Seattle, WA; 770–778; 2016.
- Simonyan K, Zisserman A. Very deep convolutional networks for large-scale image recognition. Conference paper at International Conference on Learning Representations (ICLR). San Diego, CA, USA; 2015.
- Allen JE, Sharma P. Polyp characterization at colonoscopy: clinical implications. Best Pract Res Clin Gastroenterol. 2017;31:435–440.
- Gopalswamy N, Shenoy VN, Choudhry U, et al. Is in vivo measurement of size of polyps during colonoscopy accurate? Gastrointest Endosc. 1997;46:497–502.
- Moug SJ, Vernall N, Saldanha J, et al. Endoscopists' estimation of size should not determine surveillance of colonic polyps. Colorectal Dis. 2010;12:646–650.
- Morales TG, Sampliner RE, Garewal HS, et al. The difference in colon polyp size before and after removal. Gastrointest Endosc. 1996;43:25–28.
- Schoen RE, Gerber LD, Margulies C. The pathologic measurement of polyp size is preferable to the endoscopic estimate. Gastrointest Endosc. 1997;46:492.