
Abstract
Background: This study aimed to evaluate knowledge-based volume modulated arc therapy (VMAT) plans for oesophageal cancers using a model trained with plans optimised with a different treatment planning system (TPS) and to compare lung dose sparing in two TPSs, Eclipse and RayStation.
Materials and methods: A total of 64 patients with stage I–III oesophageal cancers were treated using hybrid VMAT (H-VMAT) plans optimised using RayStation. Among them, 40 plans were used for training the model for knowledge-based planning (KBP) in RapidPlan. The remaining 24 plans were recalculated using RapidPlan to validate the KBP model. H-VMAT plans calculated using RapidPlan were compared with H-VMAT plans optimised using RayStation with respect to planning target volume doses, lung doses, and modulation complexity.
Results: In the lung, there were significant differences between the volume ratios receiving doses in excess of 5, 10, and 20 Gy (V5, V10, and V20). The V5 for the lung with H-VMAT plans optimised using RapidPlan was significantly higher than that of H-VMAT plans optimised using RayStation (p < .01), with a mean difference of 10%. Compared to H-VMAT plans optimised using RayStation, the V10 and V20 for the lung were significantly lower with H-VMAT plans optimised using RapidPlan (p = .04 and p = .02), with differences exceeding 1.0%. In terms of modulation complexity, the change in beam output at each control point was more constant with H-VMAT plans optimised using RapidPlan than with H-VMAT plans optimised using RayStation. The range of the change with H-VMAT plans optimised using RapidPlan was one third that of H-VMAT plans optimised using RayStation.
Conclusion: Two optimisers in Eclipse and RayStation had different dosimetric performance in lung sparing and modulation complexity. RapidPlan could not improve low lung doses, however, it provided an appreciate intermediated doses compared to plans optimised with RayStation.
Introduction
Auto planning has been developed in some treatment planning systems (TPSs) for clinical use [Citation1–6]. Automated treatment planning confers certain advantages in terms of lowering inter-institutional variations of plan quality, reducing treatment planning times, and improved dose sparing of organs at risk (OAR) compared with manual planning [Citation1–3,Citation7-9]. RapidPlan (Varian Medical Systems, Palo Alto, CA, USA) is one approach of machine learning, and the performance of this knowledge-based planning (KBP) system depends on library plans (LPs) in the model [Citation10–13]. In the KBP system, users create KBP models, which were built based on the dosimetry and geometry of the OAR and targets of the LPs. In the reports comparing KBP with manual planning, these comparisons were performed on the same TPS, namely, Eclipse (Varian Medical Systems, Palo Alto, CA, USA) [Citation1,Citation7–9].
Each TPS has a different engine for the optimisation of inverse planning. The optimiser calculates fluence at each control point (CP) in the arc fields. To achieve optimal fluence per CP, the shapes of the fields were determined using the multileaf collimator (MLC) configuration, gantry speed, and dose rate. Due to differences in the optimizer, each TPS may not provide the same fluence during an arc, even in the treatment plan of the same patient. Some reports have shown that the modulation complexity for VMAT varies across TPSs [Citation14,Citation15]. Moreover, in auto planning, each TPS demonstrates a different performance of dose sparing for parallel organs in head and neck cancers, such as oral cavity, parotids, sub mandible glands, and upper aerodigestive tract. The performance of OAR sparing, in descending order was ranked as follows: Pinnacle (Philips Inc., Madison, WI, USA), RayStation (RaySearch Laboratories, Stockholm, Sweden), and Eclipse (Varian Medical Systems, Palo Alto, CA, USA) [Citation16].
RapidPlan estimates the dose-volume histogram (DVH) and provides objective information based on the learned volume and dosing behaviour to attain an ideal dose distribution. After providing objectives for optimisation, a photon optimiser (PO) in Eclipse was used with the machine’s constraints, such as rotating the gantry with constant speed. It is unclear whether modulation complexity for the KBP with a different TPS has clinical applicability. The mechanical performance, such as MLC motion variability, gantry rotation speed, and output per control point of knowledge-based VMAT plans has been clarified with only one TPS and no major problems were reported [Citation17]. This study aimed to evaluate the dose distributions and modulation complexity of knowledge-based hybrid VMAT plans, using the model trained with plans optimised with RayStation, and to compare dose sparing of the lungs using Eclipse and RayStation.
Materials and methods
Subjects
This study was approved by the Institutional Ethical Review Committee (the Osaka International Cancer Institute review board number: 19154). All patients provided written informed consent. Patients who had undergone chemoradiotherapy for stage I–III oesophageal cancer (n = 64) at the Osaka International Cancer Institute between July 2017 and December 2018 were selected. Among them, 40 cases treated between July 2017 and June 2018 were used as LPs to create the KBP model, and 24 cases treated between August 2018 and December 2018 were used for the validation of the KBP calculation. The workflow of this study was, as follows:
Step A. Obtained 64 (subsets of 40 and 24) RayStation and Eclipse treatment plans.
Step B. Subset of 40 RayStation and Eclipse treatment plans used to train two RapidPlan models.
Step C. Subset of 24 patients used to obtain 24 KBP plans with two RapidPlan models created at Step B.
Step D. Compare the treatment plans of steps A vs. C with the 24 plans subset.
Treatment planning in the clinic (Step A)
Each patient was immobilised with a vacuum cushion for CT simulation and treatment. CT acquisition was performed with the Revolution HD (GE Medical Systems, Milwaukee, WI, USA) scanner. CT images were acquired with slight expiratory breath hold (ExCT) and, slight inspiratory breath hold (InCT). The CT slice thickness, matrix size, and field of view were 2.0 mm, 512 × 512, and 50 cm, respectively. Patients were treated with free breathing and we evaluated organ dose on slight expiratory breath holding CT in planning.
Treatment planning was performed on two TPSs, namely, RayStation version 6.2.0 and Eclipse version 13.0. A Varian Truebeam linear accelerator equipped with a Millennium 120-leaf multileaf collimator (MLC) (Varian Medical Systems, Palo Alto, CA, USA) was used for the treatments. The procedure of treatment planning involved the following steps. First, the CT images were imported to Eclipse to define the targets and organs. The clinical target volumes (CTV) were contoured on both, ExCT and InCT sets. The typical CTV for elective nodal irradiation was based on the tumour location. In upper thoracic oesophageal cancer, the CTV generally encompassed the bilateral supraclavicular, cervical, paraesophageal, and mediastinal lymph nodes up to the tracheal bifurcation. In middle thoracic oesophageal cancer, it generally encompassed the bilateral supraclavicular, cervical, paraesophageal, mediastinal, paracardial, lesser curvature, and left gastric lymph nodes, while in lower thoracic oesophageal cancer, the CTV usually encompassed the mediastinal, paracardial, lesser curvature, left gastric, and coeliac artery lymph nodes. To define the internal target volume (ITV), both CTVs, contoured on ExCT and InCT, were combined. The planning target volumes (PTV) were delineated by adding 5-mm margins to the ITV in all directions to compensate for setup errors. The OARs, namely, the lungs, heart, and spinal cord, and the PTVs were contoured on the ExCT.
Second, beam setting and optimisation were performed on RayStation. To reduce lung doses from VMAT, hybrid VMAT technique (H-VMAT) was applied. H-VMAT plans optimised with RayStation were defined as H-VMAT_RS. The efficacy of the H-VMAT solution in reducing low lung doses has been reported [Citation18,Citation19]. H-VMAT involved summation of doses from 3-dimensional conformal radiotherapy (3DCRT) and VMAT plans. For H-VMAT planning, the VMAT plan was optimised with setting the dose distribution of 3DCRT plan in the background.
Treatment plans included a single isocenter placed at the centre of the PTV. All 3DCRT treatment plans employed opposing anterior-posterior fields with 10 MV photons. Each field was shaped by conforming the MLC to the PTV with zero beam aperture margins. The VMAT plan consisted of two coplanar arcs rotated clockwise and counterclockwise from 179° to 181° with collimator angles of 20° and 340°. The control point spacing was 2° angular separations. The photon beam energy used was 6 MV with a maximum available dose rate of 600 MU/min. During VMAT plan optimisation, the 3DCRT plan delivering half of the prescribed dose was used as the base dose plan. The optimisation was performed with the jaw tracking function.
The subsequent steps of dose calculation, prescription setting, and evaluation were performed on Eclipse version 13.0; both, the 3DCRT and VMAT plans were transferred onto the Eclipse version 13.0 (Varian Medical Systems, Palo Alto, CA, USA) TPS and recalculated using the analytical anisotropic algorithm (AAA) with a grid size of 2.0 mm. The two-dose distributions in both the plans were summated to create the H-VMAT plan. At the mean dose (Dmean) of the PTV, the prescribed dose was either 40 Gy/20 fractions or 41.4 Gy/23 fractions. The dose constraints were as follows: a volume of at least 0.03 cm3 within any PTV would not receive > 110% of the prescribed dose, the D95 (dose expressed in Grey to 95% of the volume) would be 95% or more, and any contiguous volume of 0.03 cm3 or larger of the tissue outside the PTVs would not receive > 110% of the prescribed dose. The OAR dose-volume limitations were as follows: V5 (volume ratio receiving doses in excess of 5 Gy) of lung would be 60% or less, V20 (volume ratio receiving doses in excess of 20 Gy) should be 30% or less, and the Dmean of the heart would be 26 Gy or less. The D1 (doses expressed in Grey to 1% of the volume) of the spinal cord was 40 Gy or less.
Training the KBP models (Step B)
Among 64 H-VMAT_RS plans, 40 were registered to train KBP models in the RapidPlan system (Varian Medical Systems, Palo Alto, CA, USA). These 40 H-VMAT_RS plans used as LPs were named H-VMAT_RSLP plans. H-VMAT_RSLP plans were re-optimised in Eclipse without RapidPlan. The optimisation and calculation algorithms were PO ver. 13.0 and AAA ver. 13.0. These 40 H-VMAT plans optimised with Eclipse were, also, registered to train KBP models in the RapidPlan system (Varian Medical Systems). Two KBP models were prepared in this study.
Model configuration
Model configuration in RapidPlan is described in the following [Citation20]. The DVH model configuration and DVH estimation are the two main components of the model training. With at least 20 plans used in clinical settings, the DVH estimation model is first configured, and the geometry and dosimetry if this structure set are then parameterised. Each structure divides the OARs into the following four sub-volumes: out-of-field (scattered dose only), leaf-transmission (MU-dependent), in-field (modulated the most), and target overlap (comparable to the target dose) regions. The geometry-based expected dose (GED) algorithm is applied to predict the achievable dose using the in-field volume for each OAR. Next, the model undergoes an extraction and training phase to train the configured model. During this phase, the model is evaluated and generates the number of possible outliers identified in the regression of the principal components according to Cook’s distance (a measure of the effect of individual training set cases on regression coefficients; a score higher than 4 indicates an influential datum that might be a geometric or dosimetric outlier) or the studentized residual (a measure of the ability to ‘turn’ the residual regression fit toward themselves; a score higher than 3 could indicate a dosimetric outlier). For the DVH estimation component, the trained model is applied to automatically provide DVH estimation and optimisation objectives for a new patient.
Optimisation with RapidPlan (Step C)
The remaining 24 cases used for validation in H-VMAT_RS plans were named H-VMAT_RSVP plans. To validate the KBP model, the VMAT plan in 24 cases were re-optimised with two RapidPlan models on the photon optimiser version 13.0. In the optimisation of VMAT plans with RapidPlan, 3DCRT plans same as that of the H-VMAT_RS plans were used as the background dose. H-VMAT_RP plans were optimised using RapidPlan. The control point spacing in these plans was also at 2° angular separation, and the grid size for the optimisation was 2.5 mm. To decrease lung dose to the lowest possible during the optimisation process, two upper objectives were added at 3 and 10 Gy under the line objective, with the same priority as the line objective. We verified that manual adjustment worked decreasing lung dose effectively in the optimisation of H-VMAT_RP plans. The mean of two upper objectives, such as V3 and V10, were 28% ± 7% and 8% ± 3%, respectively. During optimisation, ring region of interest (ROI) was used not to leak high dose more than 95% dose around the PTV. The optimisation was, also, performed with the jaw tracking function in Eclipse. The maximum field × size was 14.5 cm on Eclipse. The D1 for the spinal cord matched with that of the clinical plan. The calculation algorithm was AAA with a grid size of 2.0 mm. After optimisation, the dose distributions for the VMAT and 3DCRT plans were summated to create the H-VMAT_RP plan. H-VMAT_RP plans with the model created with RayStation plans were named H-VMAT_RPRS plan. H-VMAT_RP plans with the model created with Eclipse plans were named H-VMAT_RPEC plan. The prescribed dose for H-VMAT_RS plans and H-VMAT_RP plans were the same. Moreover, H-VMAT plans (H-VMAT_EC plans) were, also, calculated without line objectives of RpidPlan in Eclipse.
Summary of the H-VMAT plans calculated in this study
In this study, because various types of H-VMAT plans were optimised with different conditions, each H-VMAT plan was summarised as follows:
H-VMAT_RSLP: H-VMAT optimised with RayStation and registered in the KBP model.
H-VMAT_RSVP: H-VMAT optimised with RayStation for the validation plans.
H-VMAT_EC: H-VMAT optimised with Eclipse without RapidPlan.
H-VMAT_RPRS: H-VMAT optimised with RapidPlan with the model created with H-VMAT_RSLP.
H-VMAT_RPEC: H-VMAT optimised with RapidPlan with the model created with H-VMAT_EC.
Data analysis (Step D)
H-VMAT_RSLP plans vs. H-VMAT_RSVP plans vs. H-VMAT_RPRS plans
Several dosimetric parameters were obtained for the PTV and OARs from the dose-volume histogram (DVH) of individual H-VMAT_RSLP plans, H-VMAT_RSVP plans, and H-VMAT_RPRS plans. In each H-VMAT plans, the D98 (doses expressed in Grey to 98% of the volume), D95, and D2 (doses expressed in Grey to 2% of the volume) of the PTV were compared. The conformity of each plan was evaluated by the conformity index (CI90 and CI95), defined as the ratio of the volume of tissue receiving at least 90% and 95% of the prescribed dose to the volume of the PTV. The homogeneity index (HI) of each plan was calculated as the ratio of D2 to D98 of the PTV. For the OARs, the V5, V10 (volume ratio receiving a dose in excess of 10 Gy), V20, and Dmean for the lung, Dmean for the heart, and D1 for the spinal cord were analysed.
H-VMAT_RSVP plans vs. H-VMAT_RPRS plans
Calculation algorithms
H-VMAT_RSVP plans and H-VMAT_RPRS plans were also recalculated with the same MU in RayStation to verify the dosimetric results between different dose calculation algorithms. The calculation algorithm of RayStation has collapsed cone convolution (CCC) with a grid size of 2.0 mm. V5, V10, V20, and mean lung dose (MLD) for the lung were compared between H-VMAT_RSVP plans and H-VMAT_RPRS plans calculated with CCC.
Biological dose
For calculating normal tissue complication probability (NTCP) for lung, the formula with the Lyman–Kutcher–Burman model were used with biological evaluation in Eclipse. End point of this formula is pneumonitis (G ≥ 2). The TD50, m, n, and α/β were following values 26.8 Gy, 0.37, 0.999, and 3.0. The NTCP calculation for the lungs was influenced by the dose calculation algorithm used for inhomogeneity correction. For the lungs, we used a refitted TD50 estimation based on the CCC algorithm as per Hedin et al. [Citation21].
Additional examinations to verify the dosimetric performance of RapidPlan
We added the following three examinations to verify the dosimetric performance of RapidPlan with the model trained with H-VMAT_RSLP in validation plans.
H-VMAT_RPRS plans vs. H-VMAT_EC plans
To verify whether RapidPlan is suitable for decreasing the lung dose, the H-VMAT_RPRS plans and H-VMAT_EC plans were compared to assess the differences in the lung dose.
H-VMAT_RPRS plans vs. H-VMAT_RPEC plans
To verify whether RayStation plans works normally to create a model for RapidPlan, the H-VMAT_RP plans obtained with models of different training sets were compared. The H-VMAT_RPRS plans and H-VMAT_RPEC plans were compared to assess the differences in the lung dose.
H-VMAT_RPRS plans vs. estimated dose in RapidPlan
To verify the performance of the expected dose in RapidPlan, the H-VMAT_RPRS plans and the estimated dose in RapidPlan were compared to assess the differences in the lung dose.
H-VMAT_RPLP plans vs. H-VMAT_RPVP plans vs. H-VMAT_RSVP plans for the mechanical performance metrics
To evaluate the complexity of modulation for the VMAT plans in H-VMAT_RSLP plans, H-VMAT_RSVP plans, and H-VMAT_RPRS plans, a modified modulation complexity score for VMAT (MCSv), leaf sequence variability (LSV), area aperture variability (AAV), and total monitor units (MU) were calculated using in-house software created with MATLAB R2016a (MathWorks, Natick, MA, USA). The MCSv, LSV, and AAV have values ranging from 0 to 1 and a small value indicates that the MLC motion of the plan is highly complex [Citation22]. In each arc, changes in MU and area aperture (AA) at each control point (CP) were investigated. The mean and standard deviation (SD) of MU and AA at each CP were individually calculated.
Statistical analysis
All statistical analyses were performed using the SPSS 8.0 software package (SPSS, Inc., Chicago, IL, USA). In analysis among plans with validation case, the paired Wilcoxon signed-rank test was used to calculate and evaluate the differences in dosimetric parameters and the complexity of the modulation. In analysis between library plans and validation plans, the Mann–Whitney U-test was used to calculate and evaluate the differences in dosimetric parameters and the complexity of the modulation.
Results
H-VMAT_RPVP plans vs. H-VMAT_RSVP plans in isodose curves
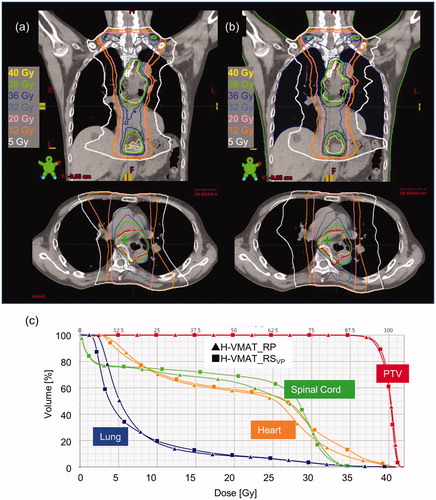
shows the isodose curves and DVHs for the H-VMAT_RSVP plans and H-VMAT_RPRS plans in a representative case. In isodose curves on the coronal images, the isodose curves for 5.0 Gy were constructed in the H-VMAT_RSVP plans. In the DVH, the PTV dose and the high dose region for the spinal cord in either plan was coincident. In the , the blue lines denote the lung and the 2 lines intersect at a dose point of about 8 Gy. The volumes of the low dose regions in the lung were higher with H-VMAT_RPRS plans than H-VMAT_RSVP plans.
Figure 1. Dose distribution and dose volume histogram (DVH) for H-VMAT with RayStation (H-VMAT_RSVP) (a) and RapidPlan (H-VMAT_RPRS) (b) in representative validation plans. In the dose distribution, upper is coronal and bottom is axial. The coloured curves represent different isodose curves. Yellow, green, pink, orange, and white represent the isodose curves of 40, 38, 20, 10, and 5 Gy, respectively. Adding, red curves represent the planning target volume (PTV). In the DVH (c), curves with square are H-VMAT_RSVP and with triangles H-VMAT_RPRS. The coloured curves represent different OARs. Red, green, orange, and blue represent PTV, spinal cord, heart, and lung, respectively.
H-VMAT_RSLP plans vs. H-VMAT_RSVP plans vs. H-VMAT_RPRS plans
summarises certain dosimetric parameters for the PTV, and the OAR for H-VMAT_RSLP plans, H-VMAT_RSVP plans, and H-VMAT_RPRS plans. Although the CI90 and CI95 for H-VMAT_RSVP plans were slightly higher than that of H-VMAT_RPRS plans in the validation plans, there were no significant differences in the PTV dose, CI90, CI95, and HI. Among OAR doses, there were no significant differences except for the dosimetric parameters of the lung. The V5 for the lung was significantly higher in the H-VMAT_RPRS plans than in the H-VMAT_RSVP plans (p < .01), with a mean difference of 10%. The V10 and V20 for lung was significantly lower in H-VMAT_RPRS plans than in the H-VMAT_RSVP plans (p = .04 and p = .02), with differences exceeding 1.0%. In the lung dose, there is no significant error between H-VAMT_RSLP plans and H-VMAT_RSVP plans (p > .38). There is significantly error for V5 between H-VAMT_RSLP plans and H-VMAT_RPRS plans (p < .01).
Table 1. Dosimetric comparison of Hybrid VMAT optimisation on RayStation and RapidPlan in the KBP model and validation plans.
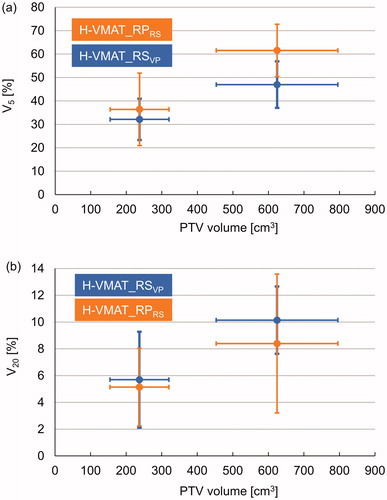
indicates the relationship between the (a) V5 and (b) V20 for lung and the PTV volume in the validation plans. The treatment plans (n = 24) were categorised into two groups based on the PTV volume by centering the data point in the middle of the bin. The average and SD of V5 and V20 of the lung were plotted based on the average PTV volume, which included the horizontal error bars. In the group with a small PTV volume, there was no significant difference in V5 and V20 between the H-VMAT_RSVP plans and H-VMAT_RPRS plans. Compared to the H-VMAT_RSVP plans, the V5 for the lung was significantly higher for the H-VMAT_RPRS plans in the groups with large PTV (p < .01), with a mean difference of about 15%. In the group with large PTV volume, the V20 for lung was significantly lower for the H-VMAT_RPRS plans than for the H-VMAT_RSVP plans (p < .01), with a mean difference of about 2%.
Figure 2. Association between planning target volume (PTV) and lung doses at V5 (i.e. volume ratio that received a dose exceeding 5 Gy) (a) and V20 (i.e. volume ratio that received a dose exceeding 20 Gy) (b) for H-VMAT_RS in validation plans (H-VMAT_RSVP) and H-VMAT with optimisation of RapidPlan (H-VMAT_RPRS). The plots represent V5 and V20 in each group with PTV volume. Horizontal and vertical error bars represent the standard deviation (SD).
H-VMAT_RPRS plans vs. H-VMAT_RSVP plans with different calculation algorithm
In H-VMAT_RSVP plans and H-VMAT_RPRS plans calculated with CCC, the mean and SD in V5 for the lung dose were 32.8% ± 9.6% and 39.5% ± 12.4%, in V10 17.2% ± 8.0% and 15.6% ± 7.0%, and in V20 7.7% ± 4.9% and 6.4% ± 3.2%, respectively. As for plans calculated with AAA (in ), H-VMAT_RPRS plans had a significantly higher dose in V5 (p < .01) and significantly lower dose in V10 and V20 than H-VMAT_RSVP plans (p < .03 and p < .02).
Table 2. The mechanical performance metrics for the H-VMAT_RS and H-VMAT_RPRS.
H-VMAT_RPVP plans vs. H-VMAT_RSVP plans in biological dose
The mean and SD of NTCP for the H-VMAT_RSVP plans and H-VMAT_RPRS plans were 1.7% ± 0.8% and 1.6% ± 0.5%. There was no significant difference among NTCPs for both plans although NTCP for H-VMAT_RPRS plans was slightly lower than that for H-VMAT_RSVP plans (p = .695).
H-VMAT_RPRS plans vs. H-VMAT_EC plans in lung dose
In validation plans calculated in Eclipse, H-VMAT_RPRS plans were compared with H-VMAT_EC plans with lung dose. In H-VMAT_EC plans, the mean and SD in V5 for the lung dose were 54.5% ± 15%, in V10 19.1% ± 7.6%, in V20 6.9% ± 3.4%, and Dmean 17.1% ± 4.3%, respectively. The lung dose for H-VMAT_RPRS plan is shown in . There are significant differences between V5, V10, and Dmean between H-VMAT_RPRS plans and H-VMAT_EC plans (p < .01).
H-VMAT_RPRS plans vs. H-VMAT_RPEC plans in lung dose
In the difference between H-VMAT_RPRS plans and H-VMAT_RPEC plans, the mean and SD for the lung dose were 4.3% ± 5.4%, 0.7% ± 1.9%, 0.3% ± 0.4%, and 1.3% ± 1.3% in V5, V10, V20, and MLD, respectively. Positive values indicated that each dosimetric parameter H-VMAT_RPEC plans was higher than that for H-VMAT_RPRS plans. There were significant differences between H-VMAT_RPRS plans and H-VMAT_RPEC plans except V10 (p < .01, = .06, < .01, < .01). The model created with RayStation plans had superior performance compared to that created with Eclipse plans with respect to lung-sparing.
H-VMAT_RPRS plans vs. estimated dose in RapidPlan in lung dose
In the calculation of H-VMAT_RPRS plans, the estimated dose for RapidPlan system was 41.1% ± 12.6%, 12.5% ± 5.1%, and 4.5% ± 2.8% in V5, V10, and V20 for the lung, respectively. The difference between the estimated and calculated dose was 6.9% ± 9.8%, 4.6% ± 6.0%, and 2.4% ± 2.2% in V5, V10, and V20 for the lung, respectively. The positive values indicated that each dosimetric parameter for the calculated dose was significantly higher than those for the estimated dose (p < .01). Moreover, there was no siginificant difference with the mean of V5 between the estimated dose in the RapidPlan and H-VAMT_RSVP (p = .59).
H-VMAT_RSLP plans vs. H-VMAT_RSVP plans vs. H-VMAT_RPRS plans for the mechanical performance metrics
summarises the mechanical performance metrics of the MCSv, total MU, LSV, AAV, MU per CP, and AA per CP for the H-VMAT_RSLP plans, H-VMAT_RSVP plans, and H-VMAT_RPRS plans. The mean of these parameters was almost the same between H-VMAT_RSVP plans and H-VMAT_RSLP plans, which were used for the library plans of the KBP model. Between H-VMAT_RSVP plans and H-VMAT_RPRS plans, there were significant differences in some parameters, such as LSV, AAV, and MU/CP. The result indicated that the mechanical performance metrics for H-VMAT_RPRS plans did not coincide with those for H-VMAT_RS plans.
There were no significant differences in MCSv between the H-VMAT_RSVP plans and H-VMAT_RPRS plans. The total MU for H-VMAT_RSVP plans was higher than that of the H-VMAT_RPRS plans. The SD of total MU with H-VMAT_RPRS plans and H-VMAT_RPRS plans was higher than that with H-VMAT_RSVP plans. In the validation plans, the LSV was significantly lower for H-VMAT_RPRS plans than for H-VMAT_RSVP plans (p < .01).
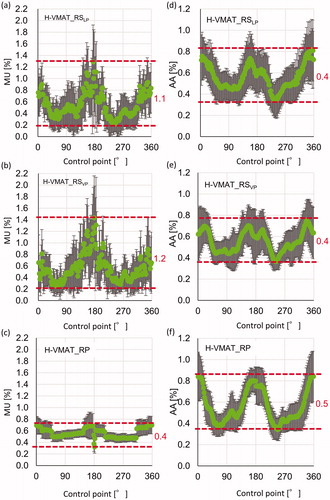
shows the changes in MU and AA at each CP. In these parameters, the summation of MU and AA at all CP was 100%. In the model and validation plans for H-VMAT_RSVP plans, changes in MU at CP were more dynamic than for H-VMAT_RPRS plans. In addition, error bars, representing the SD of MU at each CP, were larger for H-VMAT_RSVP plans than for H-VMAT_RPRS plans. This represented the large differences in MU at CP among treatment plans. During the arc, the range of the mean MU in H-VMAT_RSVP plans was thrice that of the H-VMAT_RPRS plans. In all treatment plans, at CP, the AA extended near 0° and 180° and narrowed near 90° and 270°, decreasing the passage of beams through the lung. In , the average of MU per CP was almost the same between the H-VMAT_RSVP plans and H-VMAT_RPRS plans. The standard deviations for H-VMAT_RSVP plans were larger than that for H-VMAT_RPRS plans. Modulation complexity for H-VMAT_RPRS plans did not coincide with that for both H-VMAT_RS plans.
Figure 3. Changing monitor unit (MU) and area aperture (AA) at each control point (CP) during arc in H-VMAT_RS for library plans (H-VMAT_RSLP) in the model (a), (d), for H-VMAT_RS in validation plans (H-VMAT_RSVP) (b), (e), and H-VMAT_RPRS in validation plans (c), (f). Each green plot represents the mean of MU and AA of each patient at CP and error bars represent the SD. Red dotted lines represent the maximum and minimum of the mean of MU and segment area at CP during arc. Each red value represents the range of changing of MU and area during arc.
Discussion
In this study, clinical H-VMAT plans optimised with RayStation were compared with H-VMAT plans optimised with Eclipse with and without RapidPlan. In the validation plans, the H-VMAT_RPRS plans demonstrated a significantly higher V5 for the lung compared to the H-VMAT_RSVP plans, although the RapidPlan model was trained with H-VMAT plans optimised with RayStation. Although RapidPlan could estimate V5 for the lung at the dosimetric level of the H-VMAT_RSVP plans, the calculated dose with RapidPlan could not be reduced until the dosimetric level of the H-VMAT_RSVP plan was reduced. In V10 and V20 for the lung, RapidPlan could estimate and calculate lower doses than the H-VMAT_RSVP plans. The reason that RapidPlan could not represent dose distribution for the lung is because of the difference in the modulation complexity for Eclipse and RayStation. In the H-VMAT plans optimised with RapidPlan, MU per CP was more constant during the arc than that for plans optimised with RayStation. This study found that RapidPlan could not reproduce the dose distribution of RayStation plans in H-VMAT for oesophageal cancers because the control method of modulation complexity during the arc was different between optimisers with Eclipse and RayStation.
Wang et al. [Citation23] found that the V5 for lung was the most significant factor associated with radiation pneumonitis in patients receiving concurrent chemotherapy for non-small cell lung cancer (NSCLC) with a median prescription dose of 63 Gy and median faction size of 35. In their cohort, a total of 38% of the 1-year actuarial incidents of grade > 3 pneumonitis occurred in the group with V5 > 42%. Moreover, Partel et al. [Citation24] decreased V5 for the lung from 66.8% to 45.7% to prevent radiation pneumonitis in cases of malignant pleural mesothelioma treated with intensity modulated radiotherapy (IMRT) with a median prescription dose of 45 Gy. In addition, Aibe et al. analysed the outcomes and toxicities of stereotactic body radiotherapy with a median faction size of 5 and prescription dose of 50 Gy in inoperable lung tumours. They concluded that the GTV was significantly associated with grade 5 radiation pneumonitis (p = .025), and there was a non-significant but slight association with grade 5 radiation pneumonitis and V5 (p = .067) [Citation25]. Therefore, there was an association between radiation pneumonitis and V5 for lung in the reports on radiotherapy with various radiation fraction size. From these reports, it is clear that V5 for the lung should be restricted to approximately 45% in VMAT for the thorax. In this study, the mean V5 for the lung in H-VMAT_RPRS plans could not be reduced to 45%. In 8 of 24 validation plans, the V5 for lung in the H-VMAT_RPRS plans exceeded 60% compared to only 1 patient in H-VMAT_RSVP plans.
To reduce low lung doses, the partial arcs with gaps approximately 90˚ and 270˚ were applied for the H-VMAT plans which was effective. However, flexibility creating fluence at each CP decreased during optimizations if partial arcs were used. The decreasing flexibility lowered the conformity of VMAT plans. Therefore, in this study, clinical H-VMAT plans with full arcs were applied. The H-VMAT plans should be compared with same beam parameters because the performance of the optimiser and RapidPlan for sparing the lung were compared.
H-VMAT_RPRS plans demonstrated a significantly lower V10 and V20 for the lung than H-VMAT_RSVP plans. Eclipse optimiser could reduce the intermediated lung dose compared with RayStation optimiser. In the Radiation Therapy Oncology Group 0617 trial, instead of V5, the V20 for the lung was associated with the incidence of pneumonitis in patients with locally advanced NSCLC treated with IMRT (p = .026) [Citation26]. In this study, the V10 and V20 for the lung was significantly lower in H-VMAT_RPRS plans than in H-VMAT_RSVP plans. KBP with the model trained with plans optimised with RayStation was effective in reducing V10 and V20 of the lung. Therefore, the KBP VMAT plans with the model trained with RayStation plans are effective if V5 for the lung is not considered with the incidence of pneumonitis.
As shown in , the modulation complexity, particularly the variations in MU during the arc in H-VMAT_RPRS plans, was not similar to that in H-VMAT_RSLP and H-VMAT_RSVP. The range of MU at each CP during the arc in H-VMAT_RPRS plans was one third that of H-VMAT_RSLP and H-VMAT_RSVP. In H-VMAT_RSLP and H-VMAT_RSVP, the MU near 90˚ and 270˚ falls dynamically. In the report by Winkler et al., the dose rate and gantry motion variability in plans optimised with Eclipse were stable [Citation15]. The optimiser in Eclipse changes smaller modulation in MU at each CP during the arc than that in RayStation.
To deliver radiation with VMAT, the configuration of the MLC, gantry speed and dose rate at each CP were calculated from optimal dose distributions. Nguyen et al. reported on a new KBP system with deep learning [Citation27]. Their system also learned only the dosimetry and geometry of OARs and targets as RapidPlan. There are KBP systems learning the dosimetry and geometry of the OAR and targets. However, this study found that the KBP system learning only the dosimetry and geometry of the OAR and targets cannot reproduce dose distributions for lung. If the KBP system learns the configuration of the MLC, gantry speed, and dose rates at each CP in addition to the dosimetry and geometry of the OAR and targets, the system may improve its performance for OAR sparing.
Conclusions
In H-VMAT plans, two optimisers in Eclipse and RayStation had different dosimetric performance in lung-sparing and modulation complexity. RapidPlan could not improve lower lung doses, however, it provided an appreciate intermediated doses compared to clinical plans which were optimised with RayStation.
Disclosure statement
The authors report no conflicts of interest.
Additional information
Funding
References
- Tol J, Delaney A, Dahele M, et al. Evaluation of a knowledge-based planning solution for head and neck cancer. Int J Radiat Oncol Biol Phys. 2015;91(3):612–620.
- Appenzoller L, Michalski J, Thorstad W, et al. Predicting dose-volume histograms for organs-at-risk in IMRT planning. Med Phys. 2012;39(12):7446–7461.
- Krayenbuehl J, Norton I, Studer G, et al. Evaluation of an automated knowledge based treatment planning system for head and neck. Radiat Oncol. 2015;10(1):226.
- Fogliata A, Belosi F, Clivio A, et al. On the pre-clinical validation of a commercial model-based optimisation engine: application to volumetric modulated arc therapy for patients with lung or prostate cancer. Radiother Oncol. 2014;113(3):385–391.
- Breedveld S, Storchi P, Heijmen B. The equivalence of multi-criteria methods for radiotherapy plan optimization. Phys Med Biol. 2009;54(23):7199–7209.
- Ghandour S, Matzinger O, Pachoud M. Volumetric-modulated arc therapy planning using multicriteria optimization for localized prostate cancer. J Appl Clin Med Phys. 2015;16(3):258–269.
- Fogliata A, Nicolini G, Clivio A, et al. A broad scope knowledge based model for optimization of VMAT in esophageal cancer: validation and assessment of plan quality among different treatment centers. Radiat Oncol. 2015;10(1):220.
- Wu H, Jiang F, Yue H, et al. A dosimetric evaluation of knowledgebased VMAT planning with simultaneous integrated boosting for rectal cancer patients. J Appl Clin Med Phys. 2016;17(6):78–85.
- Kubo K, Monzen H, Ishii K, et al. Dosimetric comparison of RapidPlan and manually optimized plans in volumetric modulated arc therapy for prostate cancer. Phys Med. 2017;44:199–204.
- Tol J, Dahele M, Delaney A, et al. Can knowledge-based dvh predictions be used for automated, individualized quality assurance of radiotherapy treatment plans? Radiat Oncol. 2015;10(1):1–14.
- Ueda Y, Fukunaga J, Kamima T, et al. Evaluation of multiple institutions’ models for knowledge-based planning of volumetric modulated arc therapy (VMAT) for prostate cancer. Radiat Oncol. 2018;13(1):46–46.
- Kamima, T, Ueda, Y, Fukunaga, J-I, et al. Multi-institutional evaluation of knowledge-based planning performance of volumetric modulated arc therapy (VMAT) for head and neck cancer. Phys Med. 2019;64:174–181. 31515017 doi:10.1016/j.ejmp.2019.07.004.
- Kubo, K, Monzen, H, Ishii, K, et al. Inter-planner variation in treatment-plan quality of plans created with a knowledge-based treatment planning system. Physica Medica. 2019;67:132–140. doi:10.1016/j.ejmp.2019.10.032.
- McGarry CK, Agnew CE, Hussein M, et al. The role of complexity metrics in a multi-institutional dosimetry audit of VMAT. Br J Radiol. 2016;89(1057):20150445.
- Winkler P, Trausnitz A, Schroettner J, et al. EP-1533 Modulation complexity assessment in VMAT plans from different treatment planning system. Radiother Oncol. 2017;123:S824–S825.
- Krayenbuehl J, Zamburlini M, Ghandour S, et al. Planning comparison of five automated treatment planning solutions for locally advanced head and neck cancer. Radiat Oncol. 2018;13(1):170.
- Tamura M, Monzen H, Matsumoto K, et al. Mechanical performance of a commercial knowledge-based VMAT planning for prostate cancer. Radiat Oncol. 2018;13(1):163.
- Mayo CS, Urie MM, Fitzgerald TJ, et al. Hybrid IMRT for Treatment of cancers of the lung and esophagus. Int J Radiat Oncol Biol Phys. 2008;71(5):1408–1418.
- Chan OSH, Lee MCH, Hung AWM, et al. The superiority of hybrid-volumetric arc therapy (VMAT) technique over double arcs VMAT and 3D-conformal technique in the treatment of locally advanced non-small cell lung cancer – A planning study. Radiother Oncol. 2011;101(2):298–302.
- Varian Medical Systems. Eclipse treatment planning 13.5 new features | RapidPlan (EC13.5-WBK-01-B). Palo Alto, CA: Varian Medical Systems Inc.; 2014.
- Hedin E, Bäck A. Influence of different dose calculation algorithms on the estimate of NTCP for lung complications. J Appl Clin Med Phys. 2013;14(5):127–139.
- Masi L, Doro R, Favuzza V, et al. Impact of plan parameters on the dosimetric accuracy of volumetric modulated arc therapy. Med Phys. 2013;40(7):071718.
- Wang S, Liao Z, Wei X, et al. Analysis of clinical and dosimetric factors associated with treatment-related pneumonitis (TRP) in patients with non-small-cell lung cancer (NSCLC) treated with concurrent chemotherapy and three-dimensional conformal radiotherapy (3D-CRT). Int J Radiat Oncol Biol Phys. 2006;66(5):1399–1407.
- Patel PR, Yoo S, Broadwater G, et al. Effect of increasing experience on dosimetric and clinical outcomes in the management of malignant pleural mesothelioma with intensity-modulated radiation therapy. Int J Radiat Oncol Biol Phys. 2012;83(1):362–368.
- Aibe N, Yamazaki H, Nakamura S, et al. Outcome and toxicity of stereotactic body radiotherapy with helical tomotherapy for inoperable lung tumor: analysis of Grade 5 radiation pneumonitis. J Radiat Res. 2014;55(3):575–582.
- Chun SG, Hu C, Choy H, et al. Impact of intensity-modulated radiation therapy technique for locally advanced non-small-cell lung cancer: a secondary analysis of the NRG Oncology RTOG 0617 Randomized Clinical Trial. J Clin Oncol. 2017;35(1):56–62.
- Nguyen D, Jia X, Sher D, et al. Three-dimensional radiotherapy dose prediction on head and neck cancer patients with a hierarchically densely connected U-net deep learning architecture. Phys Med Biol. 2019;64(6):065020.