
Abstract
Background: Survival and response to therapy in patients with metastatic colorectal cancer (mCRC) are very heterogeneous. There is an unmet need for better markers of prognosis and treatment benefit for mCRC patients. The homeobox 2 gene SATB2 has a highly specific expression in colorectal tissue and is associated with better prognosis in non-metastatic CRC.
Material and methods: A population-based cohort of 798 mCRC patients was analysed. From primary tumour material, protein expression was assessed by immunohistochemistry. BRAF and KRAS mutation status was also determined. Associations with clinicopathological data, overall and progression-free survival and response to first-line chemotherapy were analysed.
Results: Tumour tissue and clinical data were available from 467 patients. SATB2 was strongly expressed in 58% of cases, significantly more in left-sided, low-grade and wild-type BRAF tumours. Patients with high SATB2 tumours had longer overall survival compared with low SATB2 tumours (median 13 vs 8 months respectively, p < .001). Chemotherapy was given to 282 patients (63%). Patients with high SATB2 tumours had longer OS (median 22 vs 15 months respectively, p = .001) and more often responded to chemotherapy than those with low SATB2 (objective response 43% vs 29%, p = .02; clinical response 83% vs 67%, p = .004). Progression-free survival on first-line irinotecan chemotherapy was longer in high SATB2 cases (median 8 vs 4 months respectively, p = .019). Patients with both low SATB2 expression and mutated BRAF (n = 69) had particularly poor survival compared to the rest (median 8 and 12 months respectively, p = .001). In multivariable analysis, the SATB2 findings were independent of known clinicopathological prognostic markers, including BRAF mutation status.
Conclusion: Patients with mCRC expressing high level of SATB2 have better prognosis and response to chemotherapy than those with low SATB2 expression. Patients with both low SATB2 expression and mutated BRAF had particularly poor prognosis and could thus benefit from more aggressive therapies.
Background
Colorectal carcinoma (CRC) is the third most common cancer worldwide and the fourth most common cause of death among cancer patients [Citation1]. Metastatic disease is seen in up to every other patient, either synchronous or metachronous, and kills most patients dying from CRC. In patients with metastatic CRC (mCRC), several clinicopathological factors are prognostic but few are predictive of treatment effects [Citation2]. Right-sided tumours and BRAF V600E mutations indicate poor prognosis [Citation3] and are important to report together with clinical data [Citation4]. For therapy prediction, RAS and likely also BRAF-mutation status are relevant when considering EGFR-inhibition [Citation5], while MSI-H is predictive of response to checkpoint-inhibitors [Citation6].
A population-based study of almost 800 patients with non-resectable mCRC showed that patients enrolled in clinical trials are highly selected and had better survival than patients not enrolled [Citation7]. Patients receiving chemotherapy had a median survival of 18 months, while it was only 2 months for those not receiving chemotherapy. In this unselected cohort, mutated BRAF was an independent marker for poor outcome, however, it was only partially responsible for the poor survival of many patients with mCRC [Citation8]. BRAF V600E mutation was also more common in this cohort than reported from clinical trials. The cohort has complete information regarding clinical parameters, response to treatments and time to progression. The possibilities to explore the independent importance of new prognostic and predictive markers in real-word patients are, therefore, favourable.
The special AT-rich sequence binding homeobox 2 gene, SATB2, encodes for a protein that binds to nuclear attachment regions of DNA, where it plays a key role in regulation of transcription. SATB2 was initially identified as a highly colorectal-specific protein using the Human Protein Atlas [Citation9]. The SATB2 protein shows a specific expression pattern with distribution limited to only few adult tissue types (www.proteinatlas.org). In epithelial cells, SATB2 expression is restricted to glandular cells in the lower gastrointestinal tract [Citation10]. In addition, SATB2 is also expressed in a subset of neurons in the brain and at lower levels in subsets of lymphocytes and cells in testis and renal tubuli [Citation9].
Expression of SATB2 is preserved in cancer of colorectal origin and can be used as a diagnostic marker [Citation11]. The specific and high prevalence of SATB2 expression in CRC has raised the hypothesis that SATB2 could provide prognostic and predictive information. This has been investigated in a few studies, including one study in patients with CRC. High expression of SATB2 was correlated with good prognosis in patients with laryngeal [Citation12], oesophageal [Citation13] and clear cell renal cancer [Citation14], whereas the effect on pancreatic/periampullary cancer was ambiguous [Citation15]. In an incident-case study of primary CRC, expression of SATB2 correlated with good prognosis and benefit from adjuvant therapy, however, this study did not permit firm conclusions, as the cohort was not designed for the analysis of treatment effects [Citation16].
In the present study we analysed the expression of SATB2 in the large prospectively collected Scandinavian population-based cohort of mCRC patients, to investigate whether its preserved expression was prognostic and correlated with response to chemotherapy.
Material and methods
Patient cohort
All patients with a diagnosis of non-resectable mCRC from three administrative regions in three Scandinavian countries (Uppsala, Sweden; Odense, Denmark and Bergen, Norway) were prospectively included during 2003–2006 [Citation7]. The study was approved by research ethics committees in the three countries and patients gave written informed consent. In total 760 patients were included when treated at the three regional hospitals and 38 additional patients were identified via cancer registries; these patients were not seen at any of the three hospitals treating cancer patients, did not receive any specific cancer treatment but had an established diagnosis of mCRC.
The initial cohort of 798 patients represents an unselected Western world population of mCRC patients. A complete clinical database including biochemical parameters, treatment and response data was available. Palliative chemotherapy generally consisted of a fluoropyrimidine (5-FU or capecitabine) alone or with irinotecan or oxaliplatin, and sometimes together with bevacizumab or cetuximab (Supplemental Figure S1).
Tissue retrieval and TMA construction
Paraffin blocks of the primary tumours or metastatic lesions were retrieved, and the histopathological diagnosis was re-confirmed by a certified pathologist (AD). Paraffin blocks with sufficient amount of invasive, non-necrotic tumour for tissue microarray (TMA) construction and DNA extraction were available in 467 cases from the cohort of 798 patients. Duplicate cores of the tumour were used for TMA construction as described [Citation17].
Immunohistochemistry and annotation
Immunohistochemistry (IHC), image acquisition and annotation were performed according to standards used within the Human Protein Atlas [Citation17]. Primary antibodies against SATB2 (CAB025742 dilution 1:100, Atlas Antibodies AB, Sweden), CK20 (M7019 dilution 1:100, Agilent Technologies AB, Sweden), and CDX-2 (NCL-CDX2 dilution 1:50, Novocastra, UK) were used.
Individual tumour core images were captured using an automated slide scanner (Aperio Technologies, Vista, CA, USA) at 200x final magnification. Semi-quantitative assessment of immunoreactivity in tumour cells was performed independently by two pathologists (AD, FP) without knowledge of clinicopathological data. Annotation discrepancies were re-evaluated to reach consensus. Immunoreactivity was separately scored for nucleus, cytoplasm or membrane on a 4-tier intensity scale (1 = negative, 2 = weak, 3 = moderate or 4 = strong) and the estimated fraction of stained tumour cells was denoted as 1 (0–1%), 2 (2–10%), 3 (11–25%), 4 (26–50%), 5 (51–75%) and 6 (>75%). Representative images of the tumours stained with SATB2 are shown in Supplemental Figure S2. For statistical analyses, a combined nuclear score defined as multiplication of nuclear fraction and nuclear intensity was used.
The cut-off value for preserved expression of CK20 and CDX2 was set to ≥2% of tumour cells, as is standard for diagnostic purposes in the routine diagnostics of surgical specimens.
Genetic analyses
Tumour DNA was extracted from cores containing representative tumour tissue using the kit Recoverall Total Nucleic Acid Isolation (Ambion, Austin, TX, USA). BRAF and KRAS mutation analysis was performed as described [Citation8].
Statistics
Statistical analyses were performed using SPSS version 24 (SPSS Inc., Chicago, IL, USA). Categorical variables were analysed using the Chi-square test. ROC curve analysis of the combined nuclear score was used to decide an optimal cut off value for SATB2. Kaplan–Meier was used to estimate overall survival (OS) and progression-free survival (PFS). OS was the time between the date when un-resectable metastatic disease was diagnosed to the date of death or censored at the end of the follow-up (February 2014). PFS was defined as the time between initiation of first-line chemotherapy and date of disease progression or death from any reason. Differences between groups were analysed using the log-rank test. Cox regression model was used for quantifying hazard ratios (HR) for selected prognostics factors. All tests were two-sided and p-values <.05 were considered statistically significant. Benjamini-Hochberg FDR was used for adjustment of multiple testing.
Results
Population-based cohort, study cohort, treatments and overall survival
The initial population-based cohort of all patients with non-resectable mCRC in the three administrative regions was 798 cases, of which 450 had representative tumour tissue with successful SATB2 IHC. The cohort selection and the differences between the subgroup of patients with tissue available for TMA and DNA extraction and the whole cohort have been described [Citation8]. Clinicopathological characteristics of the SATB2 study cohort are summarised in Supplemental Table S3.
In the total cohort (798 patients), 455 (57%) patients received chemotherapy for metastatic disease and the remaining 343 patients did not receive any antitumor treatment except for palliative radiotherapy, building the ‘best supportive care (BSC) group’. In the SATB2 study cohort, 282 (63%) patients had chemotherapy for metastatic disease, a proportion similar to that of the total cohort.
The patients in the SATB2 study cohort receiving chemotherapy were younger and had better WHO-performance status than those on BSC, similar to the whole cohort [Citation7]. Median OS for all 798 patients was 10 months with 95% confidence interval (CI) 8.8–11.2. In the SATB2 study cohort, median OS was of similar length, 11 months (CI 9.4–12.6; log-rank test, p = .032). In this SATB2 study cohort, patients with right-sided tumours had shorter OS than those with left-sided tumours and rectal tumours: median OS 9 months (CI 6.6–11.4), 14 months (CI 11.5–16.5) and 13 months (CI 10.3–15.7) respectively (log-rank p = .017).
SATB2 expression and prognostic analyses
SATB2 was highly sensitive for tumours of colorectal origin and only 6.8% of the tumours completely lacked SATB2 IHC staining. The expression across the cohort was variable, however, the fraction of tumour cells expressing SATB2 and the score of nuclear intensity were strongly intercorrelated (Spearman’s rho = 0.72, p < .01). The ROC curve analysis of the combined nuclear score and OS indicated a cut-off value of 22 for ‘low’ versus ‘high’ SATB2 expression, corresponding to a score of 6 for nuclear fraction (>75%) and 4 for nuclear intensity (strong). The cut-off value identified as prognostic in this cohort was similar to that identified in another cohort, the Malmö diet and cancer study [Citation16], despite using a different annotation scale for the IHC staining. Forty-two percent of the tumours displayed low expression of SATB2.
Baseline clinicopathological characteristics of the high and low SATB2 expression subgroups are shown in . Tumours scoring high-SATB2 were more often left-sided and better differentiated compared to the low-SATB2 tumours. Further, high SATB2 expression positively correlated with location of metastases in liver and lung while the opposite was noted for peritoneal metastases (Supplemental Table S4). A few patients developed metastases in unusual locations such as bone (13%), brain (6%) and skin (2%). SATB-2 expression did not correlate with metastases at these sites.
Table 1. Baseline clinicopathological data.
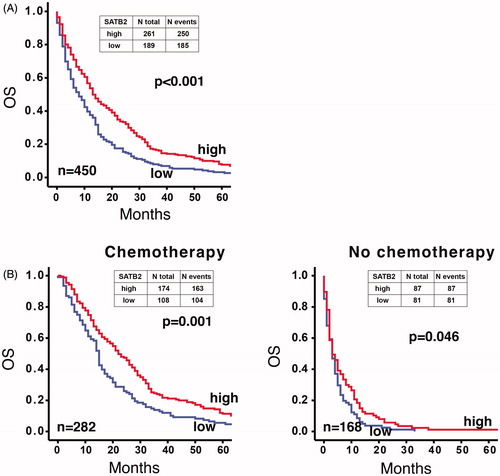
OS was longer for patients with high-SATB2 compared to low-SATB2 tumours (median OS 13 months (CI 10.6–15.4) and 8 months (CI 5.9–10.1), respectively, p < .001, ). This was true also in the group of patients receiving chemotherapy (n = 282) (median OS 22.0 (CI 18.2–25.8) months and 15.0 (CI 13.8–16.2) months, respectively, p = .001, ). Survival of patients not receiving chemotherapy (n = 168) was less influenced by SATB2 expression (median OS 3.0 (CI 1.4–4.6) and 3.0 (CI 2.0–4.0) months, respectively, p = .046, ).
Figure 1. Kaplan–Meier plot of overall survival (from the date of metastatic diagnosis) in patients having high-SATB2 (red line) versus low-SATB2 expression (blue line). (A) The whole TMA cohort. (B) According to treatment provided. Overall survival of patients receiving chemotherapy was better for those having high SATB2 expression (left panel), while it was less affected by SATB2 expression in patients not receiving chemotherapy (right panel). Log rank test used for the analysis of statistical significance.
High expression of SATB2 was significantly associated with preserved expression of CK20 and CDX2, known markers of intestinal differentiation (Supplemental Table S5). Tumours from 11 patients (2.4%) showed negative immunostaining for SATB2, CK20 and CDX2 and they tended to have shorter OS compared to the remaining cohort. These patients did not differ from the rest of the cohort in terms of treatment decision (BSC or chemotherapy), age, gender, metastatic location or treatment response including PFS (data not shown).
Low SATB2 expression was associated with mutated BRAF, but not with KRAS mutation status (). Sixty-nine patients had both mutated BRAF and low SATB2; these patients had shorter OS compared to the remaining cohort (median 8.0 (CI 5.3–10.7) and 12.0 (CI 10.3–13.7) months, respectively, p = .001). This subgroup differed from the rest by having a higher fraction of women, predominance of right-sided location and poor differentiation grade (Supplemental Table S6). Forty-two patients in this category were treated with chemotherapy; they had similar PFS as the rest of the patients (data not shown).
The following clinicopathological factors with known/expected prognostic value were tested in univariable models for OS (): old age, high WHO performance status, right-sided tumour location, multiple metastatic sites, elevated alkaline phosphatase, poor tumour differentiation, BRAF/KRAS mutation and loss of CDX2 or CK20. Many of them were, together with low SATB2 expression, associated with shorter OS. In a multivariable model including these markers (), low SATB2 was still significantly associated with poor survival, demonstrating its independent prognostic value.
Table 2. SATB2 and clinicopathological parameters as prognostic factors for overall survival (univariable Cox regression model) in patients with mCRC.
Table 3. Multivariable analysis.
In the group of patients that received first-line chemotherapy, median OS was longer in patients with high SATB2 versus patients with low SATB2 regardless of the treatment group (). This difference was statistically significant in patients receiving a combination of 5-FU with irinotecan ().
Table 4. OS and PFS in different treatment groups.
For patients receiving chemotherapy, PFS was available in 281 cases. PFS on first-line chemotherapy was not significantly affected by SATB2 expression (Supplemental Figure S7). However, for patients treated with irinotecan (n = 59), PFS was better in SATB2-high cases (median PFS 8.0 (CI 6.2–9.8) and 4.0 (CI 1.3–6.7) months, respectively, p = .019, ). Clinicopathological parameters were similar between the groups being treated with either irinotecan or oxaliplatin, with only alkaline phosphatase showing more often elevated values in the irinotecan-treated group (Supplemental Table S8).
Finally, data on response to therapy according to RECIST criteria [Citation18] was available in 276 patients receiving chemotherapy. Patients with tumours having high SATB2 expression more often responded objectively (complete and partial tumour response, 43% vs 29%, p = .024) or clinically (complete and partial tumour response or stable disease) than those with low expression (rate of response 83% vs 57%, p = .004, Supplemental Table S9). The response rate for the subgroup receiving irinotecan was similar to that of the other treatments (data not shown).
Discussion
The starting point of the present study is an unselected, consecutive cohort of patients with mCRC. The study is unique in that all patients with mCRC are included, independent of performance status and treatment modality. Thus, the cohort mirrors characteristics of mCRC in the general population. In mCRC, several clinicopathological parameters (age, sidedness, performance status, alkaline phosphatase, tumour differentiation) and molecular traits (BRAF, KRAS, MSI-status) have been studied but are so far insufficient for prognosis and therapy prediction.
SATB2 is a highly sensitive and specific diagnostic colorectal marker [Citation10,Citation11] and its expression was positively correlated with prognosis in a few types of cancer [Citation12]. In the incident Malmö Diet and Cancer study, including 527 patients with CRC stages I-IV [Citation16], high expression of SATB2 was associated with good prognosis and was an independent prognostic factor for OS and cancer-specific survival in colon cancer, but not in rectal cancer. In our cohort, SATB2 expression showed a high sensitivity for tumours of colorectal origin, with more than 93% of the tumours positively stained, although with variable intensity and distribution. This is consistent with what has been shown in previous studies [Citation10,Citation11].
In our study, high expression of SATB2 in the primary tumour correlated with longer OS for the metastatic patients, particularly for those treated with chemotherapy, but to some extent also for those receiving BSC. The effect was independent of other prognostic parameters in multivariable analysis, such as BRAF status and sidedness.
Interestingly, low SATB2 expression in our study was also associated with mutant BRAF status. This is consistent with a recent retrospective study including tumour tissue from 246 patients with CRC [Citation19]. Tumours harbouring both mutated BRAF and low SATB2 expression had shorter OS than the rest, indicating a particularly severe phenotype, not previously reported. Both SATB2 and BRAF were independent prognostic factors in the multivariable analysis.
There are several theories on the mechanism by which SATB2 affects tumour growth and spreading, including SATB2-mediated chromatin rearrangement and differential expression of microRNAs, both of which could affect the expression of genes important for migration and invasion [Citation20]. A metastasis-suppressor microRNA, miRNA-31, binds directly to SATB2-mRNA and blocks its translation into SATB2 protein. This correlated with poor prognosis in patients with CRC [Citation21] and in patients with triple negative breast cancer [Citation22]. SATB2 has a tumour suppressive function in in vitro models, where its expression inhibited the formation of invadopodia, actin-rich protrusions of the plasma membrane that are associated with degradation of the extracellular matrix and reduced invasiveness of cancer cells in a migration assay [Citation20]. SATB2 overexpression is associated with reduced phosphorylation of ERK5, a mitogen-activated protein kinase that promotes aggressive behaviour of tumour cells, including formation of invadopodia [Citation23]. An association between reduced SATB2 expression and more malignant phenotypes has been observed in several cancer types [Citation24]. There is thus overwhelming evidence that SATB2 is directly involved in mechanisms of tumour aggressiveness.
In our cohort, high SATB2 expression in the primary tumour correlated significantly with objective and clinical tumour response to chemotherapy and with longer PFS in patients treated with irinotecan. Although the number of patients receiving irinotecan was small (n = 59), this novel observation is interesting and should be further studied in independent cohorts. No published data exists so far on the interaction between irinotecan and SATB2. Irinotecan is inactivated by cytochrome P450 3A4 (CYP3A4), whose activity can be reduced by miRNA [Citation25]. Since miRNAs are known targets of SATB2, an indirect effect on irinotecan efficacy can be surmised.
SATB2 expression correlated positively with the common pattern of metastasis, i.e. liver and lung, but negatively with metastatic spread to the peritoneum, a finding that might be clinically useful in the follow-up of patients. This could in part be due to the higher prevalence of BRAF-mutated cases in tumours with low SATB2 expression, as BRAF mutated tumours often metastasise to the peritoneum [Citation26,Citation27].
One weakness of the present study is the lack of tissue material from the whole patient cohort – only 450 of 798 tumours could be represented in the TMA. The TMA subgroup had overall better baseline prognostic factors [Citation8] and a slightly longer OS than the non-TMA subgroup (median 11 vs 10 months). However, the proportion and type of treatment offered to the group of patients with tissue material for TMA was similar to that of the whole cohort.
In conclusion, the analysis of SATB2 expression in a unique population-based cohort of patients with mCRC has shown that high expression of SATB2 in primary tumour material is associated with a favourable prognosis and a higher chance of response to chemotherapy. In the multivariable analysis, SATB2 expression had independent prognostic value of similar magnitude to that of BRAF-mutation status. The observed association between SATB2 expression and response to irinotecan needs to be further investigated. Patients with both low SATB2 expression and mutated BRAF had particularly poor prognosis and they could potentially benefit from more aggressive therapies. Further studies are needed to extend the knowledge on prediction of treatment benefit and to develop panels of molecular markers that can transition into clinical utility.
Supplemental Material
Download MS Word (3.7 MB)Disclosure statement
The authors declare no potential conflicts of interest.
Additional information
Funding
Related Research Data
References
- Forman D, Ferlay J. The global and regional burden of cancer. In: Stewart B, Wild C, editors. World Cancer Report. 2014. Lyon: IARC, WHO; 2014. p. 16–53.
- Sorbye H, Kohne CH, Sargent DJ, et al. Patient characteristics and stratification in medical treatment studies for metastatic colorectal cancer: a proposal for standardization of patient characteristic reporting and stratification. Ann Oncol. 2007;18(10):1666–1672.
- Arnold D, Lueza B, Douillard JY, et al. Prognostic and predictive value of primary tumour side in patients with RAS wild-type metastatic colorectal cancer treated with chemotherapy and EGFR directed antibodies in six randomized trials. Ann Oncol. 2017;28(8):1713–1729.
- Goey KKH, Sørbye H, Glimelius B, et al. Consensus statement on essential patient characteristics in systemic treatment trials for metastatic colorectal cancer: supported by the ARCAD Group. Eur J Cancer. 2018;100:35–45.
- Therkildsen C, Bergmann TK, Henrichsen-Schnack T, et al. The predictive value of KRAS, NRAS, BRAF, PIK3CA and PTEN for anti-EGFR treatment in metastatic colorectal cancer: a systematic review and meta-analysis. Acta Oncol. 2014;53(7):852–864.
- Passardi A, Canale M, Valgiusti M, et al. Immune checkpoints as a target for colorectal cancer treatment. Int J Mol Sci. 2017;18(6):pii: E1324.
- Sorbye H, Pfeiffer P, Cavalli-Björkman N, et al. Clinical trial enrollment, patient characteristics, and survival differences in prospectively registered metastatic colorectal cancer patients. Cancer. 2009;115(20):4679–4687.
- Sorbye H, Dragomir A, Sundström M, et al. High BRAF mutation frequency and marked survival differences in subgroups according to KRAS/BRAF mutation status and tumor tissue availability in a prospective population-based metastatic colorectal cancer cohort. PLoS One. 2015;10(6):e0131046.
- Uhlén M, Fagerberg L, Hallström BM, et al. Proteomics. Tissue-based map of the human proteome. Science. 2015;347(6220):1260419.
- Magnusson K, de Wit M, Brennan DJ, et al. SATB2 in combination with cytokeratin 20 identifies over 95% of all colorectal carcinomas. Am J Surg Pathol. 2011;35(7):937–948.
- Dragomir A, de Wit M, Johansson C, et al. The role of SATB2 as a diagnostic marker for tumors of colorectal origin: results of a pathology-based clinical prospective study. Am J Clin Pathol. 2014;141(5):630–638.
- Liu TR, Xu LH, Yang AK, et al. Decreased expression of SATB2: a novel independent prognostic marker of worse outcome in laryngeal carcinoma patients. PLoS One. 2012;7(7):e40704.
- Geng GJ, Li N, Mi YJ, et al. Prognostic value of SATB2 expression in patients with esophageal squamous cell carcinoma. Int J Clin Exp Pathol. 2015;8(1):423–431.
- Guo C, Xiong D, Yao X, et al. Decreased SATB2 expression is associated with metastasis and poor prognosis in human clear cell renal cell carcinoma. Int J Clin Exp Pathol. 2015;8(4):3710–3718.
- Elebro J, Heby M, Gaber A, et al. Prognostic and treatment predictive significance of SATB1 and SATB2 expression in pancreatic and periampullary adenocarcinoma. J Transl Med. 2014;12(1):289.
- Eberhard J, Gaber A, Wangefjord S, et al. A cohort study of the prognostic and treatment predictive value of SATB2 expression in colorectal cancer. Br J Cancer. 2012;106(5):931–938.
- Kampf C, Olsson I, Ryberg U, et al. Production of tissue microarrays, immunohistochemistry staining and digitalization within the human protein atlas. J Vis Exp. 2012;(63):pii: 3620.
- Eisenhauer EA, Therasse P, Bogaerts J, et al. New response evaluation criteria in solid tumours: revised RECIST guideline (version 1.1). Eur J Cancer. 2009;45(2):228–247.
- Ma C, Olevian DC, Lowenthal BM, et al. Loss of SATB2 expression in colorectal carcinoma is associated with DNA mismatch repair protein deficiency and BRAF mutation. Am J Surg Pathol. 2018;42(10):1409–1417.
- Mansour MA, Asano E, Hyodo T, et al. Special AT-rich sequence-binding protein 2 suppresses invadopodia formation in HCT116 cells via palladin inhibition. Exp Cell Res. 2015;332(1):78–88.
- Yang MH, Yu J, Chen N, et al. Elevated microRNA-31 expression regulates colorectal cancer progression by repressing its target gene SATB2. PLoS One. 2013;8(12):e85353.
- Luo LJ, Yang F, Ding JJ, et al. MiR-31 inhibits migration and invasion by targeting SATB2 in triple negative breast cancer. Gene. 2016;594(1):47–58.
- Mansour MA, Hyodo T, Ito S, et al. SATB2 suppresses the progression of colorectal cancer cells via inactivation of MEK5/ERK5 signaling. FEBS J. 2015;282(8):1394–1405.
- Ma YN, Zhang HY, Fei LR, et al. SATB2 suppresses non-small cell lung cancer invasiveness by G9a. Clin Exp Med. 2018;18(1):37–44.
- Sun M, Zhang Q, Yang X, et al. Vitamin D enhances the efficacy of irinotecan through miR-627-mediated inhibition of intratumoral drug metabolism. Mol Cancer Ther. 2016;15(9):2086–2095.
- Lipsyc M, Yaeger R. Impact of somatic mutations on patterns of metastasis in colorectal cancer. J Gastrointest Oncol. 2015;6(6):645–649.
- Jang MH, Kim S, Hwang DY, et al. BRAF-mutated colorectal cancer exhibits distinct clinicopathological features from wild-type BRAF-expressing cancer independent of the microsatellite instability status. J Korean Med Sci. 2017;32(1):38–46.