
 ?Mathematical formulae have been encoded as MathML and are displayed in this HTML version using MathJax in order to improve their display. Uncheck the box to turn MathJax off. This feature requires Javascript. Click on a formula to zoom.
Abstract
Background
Hypoxia dose painting is a radiotherapy technique to increase the dose to hypoxic regions of the tumour. Still, the clinical effect relies on the reproducibility of the hypoxic region shown in the medical image. 18F-EF5 is a hypoxia tracer for positron emission tomography (PET), and this study investigated the repeatability of 18F-EF5-based dose painting by numbers (DPBN) in head and neck cancer (HNC).
Materials and methods
Eight HNC patients undergoing two 18F-EF5-PET/CT sessions (A and B) before radiotherapy were included. A linear conversion of PET signal intensity to radiotherapy dose prescription was employed and DPBN treatment plans were created using the image basis acquired at each PET/CT session. Also, plan A was recalculated on the image basis for session B. Voxel-by-voxel Pearson’s correlation and quality factor were calculated to assess the DPBN plan quality and repeatability.
Results
The mean (SD) correlation coefficient between DPBN prescription and plan was 0.92 (0.02) and 0.93 (0.02) for sessions A and B, respectively, with corresponding quality factors of 0.02 (0.002) and 0.02 (0.003), respectively. The mean correlation between dose prescriptions at day A and B was 0.72 (0.13), and 0.77 (0.12) for the corresponding plans. A mean correlation of 0.80 (0.08) was found between plan A, recalculated on image basis B, and plan B.
Conclusion
Hypoxia DPBN planning based on 18F-EF5-PET/CT showed high repeatability. This illustrates that 18F-EF5-PET provides a robust target for dose painting.
Background
Dose painting is a radiotherapy (RT) technique to escalate the radiation dose to radioresistant regions of the tumour [Citation1–3]. This technique is particularly relevant for head and neck cancers (HNC), as recurrences after radiotherapy are mainly localised within the primary tumour and involved nodes [Citation4,Citation5]. The main medical imaging modality in defining targets for dose painting is positron emission tomography (PET), although, e.g., diffusion-weighted magnetic resonance imaging has also been proposed [Citation6,Citation7]. Clinical results from dose painting of HNC based on PET with the metabolism tracer 18F-fluorodeoxyglucose (18F-FDG) are emerging, indicating high control levels but also rather high toxicity levels [Citation8–11]. Still, patients with HNC treated with conventional RT have good treatment outcomes, especially those with HPV-positive disease in the oropharynx [Citation12]. Moreover, the metabolic tumour volume based on 18F-FDG was recently shown to be prognostic only for patients with HPV unrelated disease [Citation13]. Thus, for HNC, it may be preferable to employ dose painting of targets more closely linked to radioresistance in selected patients with expected poor outcomes from conventional treatment.
Hypoxia is a known cause of clinical radioresistance in patients with HNC [Citation14]. Several PET tracers have been suggested for hypoxia imaging [Citation14,Citation15], where 18F-fluoromisonidazole (18F-FMISO) is the most widely used. 2-(2-nitro-H-1-imidazol-1-yl)-N-(2,2,3,3,3-pentafluoropropyl)-acetamide (18F-EF5) is another hypoxia tracer for PET showing promising results for patients with HNC [Citation16–18]. Previous studies utilising non-labelled 18F-EF5 have comprehensively demonstrated the hypoxia-avidity of this compound [Citation19]. Compared to other hypoxia markers, such as 18F-FMISO and 18F-FAZA, 18F-EF5 has high lipophilicity and rapid clearance from normal neck tissues, resulting in higher or equal hypoxia-specific uptake [Citation20]. This is an obvious advantage in HNC hypoxia dose painting, where the hypoxic regions of the tumour are targeted, thereby potentially increasing the likelihood of tumour control [Citation21–24]. Currently, to the knowledge of the authors, there is one ongoing phase II hypoxia dose painting trial of HNC, where an interim analysis has indicated no excess toxicity compared to conventional RT [Citation25].
There are principally two different dose painting approaches dose painting by contours (DPBC) and dose painting by numbers (DPBN) [Citation26,Citation27]. DPBC requires thresholding of the hypoxic tumour sub-volume in the PET image and is technically the same as a simultaneous integrated boost. On the other hand, DPBN adapts the radiation dose distribution to a dose prescription map reflecting the voxel-by-voxel variation in hypoxia levels evident from the PET image. As such, DPBN is a more tailored treatment than DPBC and is more robust against variations in PET image reconstruction [Citation28].
Although hypoxia dose painting is a promising approach, the treatment efficacy will depend on the geometrical stability of the targeted hypoxia within the tumour. It is common to plan the dose painting treatment based on one imaging session, acquired ∼1 week before the start of treatment. Thus, image noise and potential temporal and spatial variations in tumour hypoxia are not considered. A diagnostic repeatability study indicated that the 18F-EF5 distribution in HNCs was rather stable before treatment [Citation18], but it is not clear how this impacts dose painting. This study aimed to investigate the robustness of 18F-EF5-PET dose painting using a commercial treatment planning system [Citation29] to repeat imaging and changes in 18F-EF5 uptake over a few days. To our knowledge, no studies on EF5-based DPBN have previously been reported, and no studies have investigated the repeatability of DPBN based on a hypoxic PET tracer in general.
Material and methods
During 2013–2016, eight HNC patients who were enrolled in a diagnostic study before RT underwent two 18F-EF5-PET/CT investigations a median of 7 days apart, in addition to standard RT planning with 18F-FDG-PET/CT. All patients gave their signed consent to participate in the study. Patient inclusion criteria, as well as details on the imaging protocol, are found in the paper by Silvoniemi et al. [Citation18]. Images were acquired on a GE D690 PET/CT (General Electric Medical Systems, Milwaukee, WI, USA) in the supine treatment position with thermoplastic mask fixation. Gross target volume (GTV) delineation was, according to current clinical practice, based on the RT planning 18F-FDG-PET/CT images. The GTVs ranged between 9 and 94 cc with a mean of 50 cc (SD 33 cc). Tumour sites were the base of the tongue (n = 3), nasopharynx (2), hypopharynx (1), oropharyngeal wall (1), and tonsillae (1). The T and N stages ranged from T2 to T4 and N0 to N3b, respectively (TNM 8th edition).
For this study, two repeat 18F-EF5-PET/CT acquisitions were used. The first image series is referred to as EF5A/CTA and the second as EF5B/CTB. To manage the transfer of delineated contours from the planning CT as well as the dose recalculation between plans, all three CT image series were rigidly registered to each other in the Varian Eclipse Image Registration workspace version 13 (Varian Medical Systems Palo Alto, CA, USA). The CT series had a voxel size of 1 × 1 × 2.5 mm and a roughly 15 cm field-of-view (FOV) in the craniocaudal direction. The voxel size of the EF5-PET images was 3.65 × 3.65 × 3.27 mm, which corresponds to a volumetric resolution of 0.04 cc. The DPBN treatment planning was performed according to the previous work by Arnesen et al. [Citation29]. Briefly, a dose prescription matrix based on the 18F-EF5 voxel uptake within the delineated GTV was generated. The dose prescription was based on a previously published linear formula relating the dose in a voxel to the corresponding PET intensity [Citation1]. Assuming the treatment to be delivered in 35 fractions, the prescribed minimum, and maximum GTV dose was set to 70 Gy (standard dose from conventional RT) and 90 Gy, respectively. The inverse of the dose prescription matrix was then used as a mock base treatment plan for IMRT optimisation in dose summation mode. For treatment planning, 5–7 coplanar 6 MV IMRT treatment fields for a Varian TrueBeam with Millennium MLC were used. Optimisation and dose calculation were carried out with Eclipse (algorithms DVO 13.7.16 and AAA 13.7.16) with a dose matrix resolution of 0.25 cm. The high-risk CTV was created by a 5 mm expansion of the GTV excluding anatomic barriers. The corresponding PTV was generated by the addition of an isotropic 5 mm margin to the CTV, which resulted in PTVs between 50 and 251 cc (mean 157 cc). The prescribed dose to the PTV was 70 Gy and the GTV maximum was constrained to V90 Gy ≤ 2 cc. No nodal or elective volumes were employed due to the limited craniocaudal FOV of the 18F-EF5-PET/CT scans. The OAR dose constraints used were a spinal canal maximum of 40 EqD2Gy (α/β = 0.9 Gy), brainstem 54 EqD2Gy (α/β = 3.0 Gy), and optical nerves and chiasm 50 EqD2Gy (α/β = 3.0 Gy). For one patient with the tumour adjacent to the chiasm with optical nerves passing through it, the OARs were subtracted from the PTV such that the tolerance doses would not be exceeded. This patient treatment was also planned with seven fields, of which one had a couch angle of 270°.
A total of three DPBN plans were calculated for each patient: (a) DPBNA based on the uptake in EF5A, (b) DPBNB based on EF5B, and (c) DPBNA–B, which was DPBNA recalculated on CTB. Voxel-by-voxel-based analysis of the GTV dose was carried out in Interactive Data Language (IDL 8.5, Harris Geospatial Solutions, Broomfield, CO, USA). To assess DPBN plan quality and repeatability, Pearson’s correlations and quality factors (QFs) were calculated between the two EF5 sessions, treatment plans a–c, and the theoretical dose prescription derived from the EF5 uptakes. The quality factor QF was calculated as:
where n is the total number of voxels within the GTV, Dn the planned dose in voxel n, and (DP)n the prescription dose for voxel n [Citation1]. For an ideal plan, QF equals 0.
To display voxel-by-voxel associations without showing an excessive number of data points, per-patient data was split into seven bins between the minimum and maximum dose value, and standard deviations and mean values were calculated within each bin. We stress that the binning was only performed for data display. All correlations and QFs were calculated for the full voxel-by-voxel distributions.
Results
An example of an EF5 distribution with the corresponding prescribed dose and the resulting optimised DPBN treatment plan is displayed in . All DPBN plans, as well as the recalculated plan, had clinically acceptable and similar parotid and spinal canal doses as seen in . PTV minimum dose (D98%) varied between 62.4 and 67.4 Gy for all patients, which corresponded to 92–96% dose coverage of the prescribed dose, except for patient 2. For patient 2, who had a large tumour (84 cc), the PTV coverage (D98 = 62.4 Gy or 89%) was compromised by the OARs. All GTV dose distributions were well within the set maximum dose constraint D2cc ≤ 90 Gy, and despite patient-wise variations, there were only small differences between the three sets of plans as seen from the population-based dose-volume histograms (DVHs) for GTV (). GTV minimum doses (D98%) were between 72.1 and 72.9 Gy for all three plans and the maximum doses (D2%) between 90.3 and 91.1 Gy. A minor increase (0.6–0.9%) in GTV maximum dose for plan DPBNA–B was found. The individually highest D2% of 93.8 Gy was found for one of the recalculated plans and corresponded to a volume of 0.2 cc.
Figure 1. Example of PET uptake and dose distributions from repeat EF5-PET/CTs A and B (upper/lower row) for one patient. Left: 18F-EF5 PET distributions; centre: corresponding DPBN prescribed doses; right: calculated doses.
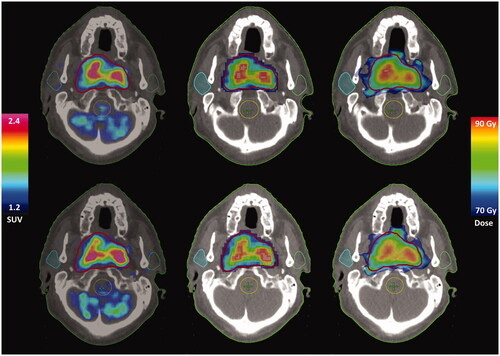
Figure 2. Zoomed mean GTV DVHs between 65 and 95 Gy overall patients for the DPBN plans based on EF5A/B distributions: DPBNA solid, DPBNB dashed, and recalculated dose distribution DPBNA–B dotted line. Error bars represent SDs.
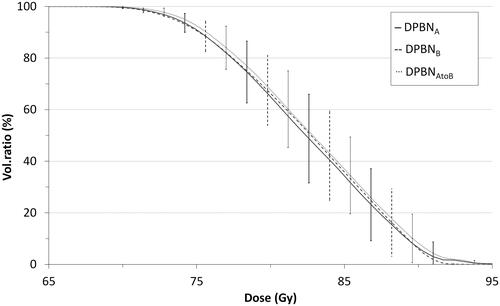
Table 1. Pooled dose characteristics for the calculated DPBN plans.
Voxel-by-voxel analysis of GTV doses showed that DPBN treatment plans agreed well with the prescription doses in terms of correlation (R) and QFs, as seen from and . For a pooled population, the calculated dose DPBNA was slightly higher than the prescription dose by 1–2% for low doses, while differences were <1% for doses higher than 80 Gy (). The DPBNB doses and prescribed doses were within 0.1–1% (data not shown). Despite the larger spread between DPBNA and DPBNB (), a pooled comparison showed mean differences of <0.2%. Comparing the recalculated plans DPBNA–B to DPBNB, the differences were similar to that of DPBNA/B and their prescription doses, which also is reflected by the QFs in (0.03 vs. 0.02). Patient 6 was a slight outlier, with DPBNA–B being 3–5% higher than DPBNB, and this patient also had one of the largest GTVs (92 cc).
Figure 3. Binned paired data for GTV dose in DPBNA vs. prescription EF5A (left), DPBNB vs. DPBNA plan (middle), and recalculated plan DPBNA–B vs. DPBNB (right). The dotted line represents a perfect match x = y. For visualisation the data was split into seven bins, where each point represents the mean value within that bin while the horizontal and vertical lines are the ranges.
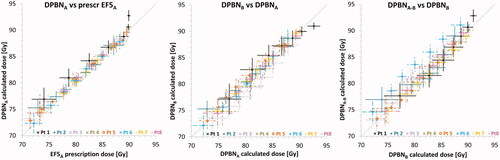
Table 2. Mean (SD) correlation coefficients (R) and quality factors (QF) between EF5A and EF5B SUVs, EF5A/B based prescriptions, and calculated doses (DPBNA/B), as well as for the EF5A based treatment plan recalculated on CTB (DPBNA–B) vs. the EF5B based plan.
Discussion
We have investigated the temporal robustness and feasibility of 18F-EF5-based hypoxia dose painting of HNC. The results indicate that within one week before RT, the tumour hypoxia did not change in a way that would compromise DPBN delivery. The calculated treatment plans will effectively be smoothened by the MV photon dose deposition kernel relative to the raw PET-based prescription map. This is reflected in the slight improvements in both correlations and QFs when crosswise comparing recalculated dose distributions with SUV maps. Therefore, the DPBN plans are expected to be robust to minor changes over time in hypoxic volumes. The achieved quality factors (typically <0.03) are below the limit of 0.05 stated by Duprez et al. for clinically acceptable plans [Citation30]. Although correlations were lower for the recalculated DPBNA–B plans, the quality factors increased minutely and the plans were still within acceptable limits.
In line with the diagnostic imaging results from Silvoniemi et al. [Citation18], the variations between the two 18F-EF5 PET uptake distributions were not pronounced and had only a limited effect on the resulting DPBN treatment plans. Previous studies on18F-fluoromisonidazole (FMISO) PET has reported high reproducibility of SUVs when imaging head and neck [Citation31,Citation32] and lung cancer patients [Citation33] 1–2 days apart. Considering dose painting, van Schie et al. [Citation27] investigated repeat multiparametric MRI-based DPBN for prostate cancer patients with 21 days between imaging sessions. Both image sets were acquired before RT and showed good stability of DP with correlations between 0.82 and 0.98 and QFs of ∼0.04 for the two sessions. In hypoxic HNC, with potentially acute and chronic hypoxic subvolumes, dose painting robustness and imaging accuracy are of even higher importance. For dose painting of HNC, Rasmussen et al. showed no relevant dosimetric impact of changes in 18 F-FDG over time with a three-day interval between PET acquisitions [Citation34]. Despite the small number of patients, our similar results for 18F-EF5-based DPBN imply that this is also the case when targeting hypoxia, indicating that spontaneous changes (before treatment) in acute and chronic hypoxia are not of great concern.
Since all imaging was performed before RT, we have no data on how, e.g., accelerated repopulation and revascularization affect acute and chronic hypoxic sub-volumes. These effects are thought to occur days to weeks after the start of radiotherapy [Citation35]. Therefore, a possible workflow could be to start the treatment course with DPBN and acquire 18 F-EF5-PET/CT control images after the first weeks of treatment. Thereafter, it could be decided whether to continue with the same DPBN, an adapted DPBN based on the new hypoxic sub-volumes, or a conventional approach with a homogeneous dose distribution in case the hypoxic subvolumes are inconsistent or absent [Citation30]. The current work may serve as a guideline for when to adapt the treatment, as treatment-induced changes should be significantly greater than the variations seen before treatment.
Olteanu et al. [Citation8] reported late grade 4 mucosal ulcers after DPBN of HNC patients when the GTV dose was escalated to maximum D2% ≥ 84 Gy. Furthermore, patients with grade 4 ulcer had median tumour volumes of 17 cc, compared to 9 cc for those without grade 4 side effects. From a clinical point of view, especially for larger tumours it might be reasonable to either lower the allowed dose maximum of 90 Gy or decrease the DPBN prescription volume. In the current study, the clinical GTVs (based on FDG-PET and CT) were larger than the hypoxic sub-volumes from the 18F-EF5 images. To reduce the dose-escalation volume, it might be sensible to choose a sub-GTV for dose painting based on e.g., SUV18F-FDG thresholding, similarly to the procedure of Welz et al. [Citation25]. In their study on 18F-FMISO dose painting, also for HNC patients, they concluded that a median of 77 Gy to an ∼2 cc (range 0.3–49 cc) hypoxic tumour volume was well tolerated. In the current study, we obtained CTV median doses of 76–80 Gy (data not shown), which, however, is below the reported tolerated median CTV doses of 80.9 Gy by Madani et al. [Citation9]. Correspondingly, also the reported GTV median doses of about 83 Gy are in line with the 85.9 Gy median dose reported by Madani. The studies by Olteanu [Citation8], Madani [Citation9], and Berwouts [Citation11] all investigated parts of the same patient material and were based on 18F-FDG-PET, which is indicative not of tumour hypoxia but of hypermetabolism. This is a general sign of malignancy (through the Warburg effect) and may as such include larger sub-volumes within the GTV compared to hypoxia. It is, therefore, possible that dose painting with a hypoxia tracer could focus the highest doses better to smaller but radioresistant parts of the tumour, and that the mucosa may thus tolerate 18F-EF5-based DPBN at higher maximum doses than with 18F-FDG-based DPBN.
Conclusions
In conclusion, the current work illustrates that hypoxia dose painting for HNC patients could be performed with 18F-EF5-PET images acquired up to one week before the start of treatment. The DPBN plans were temporally robust, indicating that baseline treatment planning using this hypoxia tracer is highly reliable.
Disclosure statement
No potential conflict of interest was reported by the author(s).
Additional information
Funding
References
- Vanderstraeten B, Duthoy W, De Gersem W, et al. [18F]fluoro-deoxy-glucose positron emission tomography ([18F]FDG-PET) voxel intensity-based intensity-modulated radiation therapy (IMRT) for head and neck cancer. Radiother Oncol. 2006;79(3):249–258.
- Gregoire V, Thorwarth D, Lee JA. Molecular imaging-guided radiotherapy for the treatment of head-and-neck squamous cell carcinoma: does it fulfill the promises? Semin Radiat Oncol. 2018;28(1):35–45.
- Ling CC, Humm J, Larson S, et al. Towards multidimensional radiotherapy (MD-CRT): Biological imaging and biological conformality. Int J Radiat Oncol. 2000;47(3):551–560.
- Johansen S, Norman MH, Dale E, et al. Patterns of local-regional recurrence after conformal and intensity-modulated radiotherapy for head and neck cancer. Radiat Oncol. 2017;12:87.
- Due AK, Vogelius IR, Aznar MC, et al. Recurrences after intensity modulated radiotherapy for head and neck squamous cell carcinoma more likely to originate from regions with high baseline [18F]-FDG uptake. Radiother Oncol. 2014;111(3):360–365.
- Dirix P, Vandecaveye V, De Keyzer F, et al. Dose painting in radiotherapy for head and neck squamous cell carcinoma: value of repeated functional imaging with (18)F-FDG PET, (18)F-fluoromisonidazole PET, diffusion-weighted MRI, and dynamic contrast-enhanced MRI. J Nucl Med. 2009;50(7):1020–1027.
- Houweling AC, Wolf AL, Vogel WV, et al. FDG-PET and diffusion-weighted MRI in head-and-neck cancer patients: implications for dose painting. Radiother Oncol. 2013;106(2):250–254.
- Olteanu LAM, Duprez F, De Neve W, et al. Late mucosal ulcers in dose-escalated adaptive dose-painting treatments for head-and-neck cancer. Acta Oncol. 2018;57(2):262–268.
- Madani I, Duprez F, Boterberg T, et al. Maximum tolerated dose in a phase I trial on adaptive dose painting by numbers for head and neck cancer. Radiother Oncol. 2011;101(3):351–355.
- Rasmussen JH, Hakansson K, Vogelius IR, et al. Phase I trial of 18F-Fludeoxyglucose based radiation dose painting with concomitant cisplatin in head and neck cancer. Radiother Oncol. 2016;120(1):76–80.
- Berwouts D, Madani I, Duprez F, et al. Long-term outcome of 18 F-fluorodeoxyglucose-positron emission tomography-guided dose painting for head and neck cancer: matched case-control study. Head Neck. 2017;39(11):2264–2275.
- Lassen P, Primdahl H, Johansen J, et al. Impact of HPV-associated p16-expression on radiotherapy outcome in advanced oropharynx and non-oropharynx cancer. Radiother Oncol. 2014;113(3):310–316.
- Moan JM, Amdal CD, Malinen E, et al. The prognostic role of 18F-fluorodeoxyglucose PET in head and neck cancer depends on HPV status. Radiother Oncol. 2019;140:54–61.
- Horsman MR, Mortensen LS, Petersen JB, et al. Imaging hypoxia to improve radiotherapy outcome. Nat Rev Clin Oncol. 2012;9(12):674–687.
- Fleming IN, Manavaki R, Blower PJ, et al. Imaging tumour hypoxia with positron emission tomography. Br J Cancer. 2015;112(2):238–250.
- Komar G, Lehtio K, Seppanen M, et al. Prognostic value of tumour blood flow, [¹18F]EF5 and [¹18F]FDG PET/CT imaging in patients with head and neck cancer treated with radiochemotherapy. Eur J Nucl Med Mol Imaging. 2014;41(11):2042–2050.
- Komar G, Seppanen M, Eskola O, et al. 18F-EF5: a new PET tracer for imaging hypoxia in head and neck cancer. J Nucl Med. 2008;49(12):1944–1951.
- Silvoniemi A, Suilamo S, Laitinen T, et al. Repeatability of tumour hypoxia imaging using [18F]EF5 PET/CT in head and neck cancer. Eur J Nucl Med Mol Imaging. 2018;45(2):161–169.
- Koch CJ, Evans SM. Optimizing hypoxia detection and treatment strategies. Semin Nucl Med. 2015;45(2):163–176.
- Minn H, Gronroos TJ, Komar G, et al. Imaging of tumor hypoxia to predict treatment sensitivity. Curr Pharm Des. 2008;14(28):2932–2942.
- Malinen E, Sovik A, Hristov D, et al. Adapting radiotherapy to hypoxic tumours. Phys Med Biol. 2006;51(19):4903–4921.
- Grosu AL, Souvatzoglou M, Roper B, et al. Hypoxia imaging with FAZA-PET and theoretical considerations with regard to dose painting for individualization of radiotherapy in patients with head and neck cancer. Int J Radiat Oncol Biol Phys. 2007;69(2):541–551.
- Thorwarth D, Eschmann SM, Paulsen F, et al. Hypoxia dose painting by numbers: a planning study. Int J Radiat Oncol Biol Phys. 2007;68(1):291–300.
- Chang JH, Wada M, Anderson NJ, et al. Hypoxia-targeted radiotherapy dose painting for head and neck cancer using (18)F-FMISO PET: a biological modeling study. Acta Oncol. 2013;52(8):1723–1729.
- Welz S, Monnich D, Pfannenberg C, et al. Prognostic value of dynamic hypoxia PET in head and neck cancer: Results from a planned interim analysis of a randomized phase II hypoxia-image guided dose escalation trial. Radiother Oncol. 2017;124(3):526–532.
- Meijer G, Steenhuijsen J, Bal M, et al. Dose painting by contours versus dose painting by numbers for stage II/III lung cancer: practical implications of using a broad or sharp brush. Radiother Oncol. 2011;100(3):396–401.
- van Schie MA, Steenbergen P, Dinh CV, et al. Repeatability of dose painting by numbers treatment planning in prostate cancer radiotherapy based on multiparametric magnetic resonance imaging. Phys Med Biol. 2017;62(14):5575–5588.
- Knudtsen IS, van Elmpt W, Ollers M, et al. Impact of PET reconstruction algorithm and threshold on dose painting of non-small cell lung cancer. Radiother Oncol. 2014;113(2):210–214.
- Arnesen MR, Knudtsen IS, Rekstad BL, et al. Dose painting by numbers in a standard treatment planning system using inverted dose prescription maps. Acta Oncol. 2015;54(9):1607–1613. Oct 21
- Duprez F, De Neve W, De Gersem W, et al. Adaptive Dose Painting by Numbers for Head-and-Neck Cancer. Int J Radiat Oncol. 2011;80(4):1045–1055.
- Okamoto S, Shiga T, Yasuda K, et al. High reproducibility of tumor hypoxia evaluated by 18F-fluoromisonidazole PET for head and neck cancer. J Nucl Med. 2013;54(2):201–207.
- Nehmeh SA, Lee NY, Schroder H, et al. Reproducibility of intratumor distribution of (18)F-fluoromisonidazole in head and neck cancer. Int J Radiat Oncol Biol Phys. 2008;70(1):235–242.
- Grkovski M, Schwartz J, Rimner A, et al. Reproducibility of (18)F-fluoromisonidazole intratumour distribution in non-small cell lung cancer. EJNMMI Res. 2016;6(1):79.
- Rasmussen JH, Vogelius IR, Aznar MC, et al. Spatio-temporal stability of pre-treatment 18F-Fludeoxyglucose uptake in head and neck squamous cell carcinomas sufficient for dose painting. Acta Oncol. 2015;54(9):1416–1422.
- Barker HE, Paget JT, Khan AA, et al. The tumour microenvironment after radiotherapy: mechanisms of resistance and recurrence. Nat Rev Cancer. 2015;15(7):409–425.