
 ?Mathematical formulae have been encoded as MathML and are displayed in this HTML version using MathJax in order to improve their display. Uncheck the box to turn MathJax off. This feature requires Javascript. Click on a formula to zoom.
Abstract
Background
The aim is to quantify and analyse tumour motion during a course of treatment for lung SBRT patients.
Material and methods
Peak-to-peak motion of 483 tumours in 441 patients treated with peripheral lung SBRT at a single institution over a two year period was measured on planning CT and at all treatment fractions. Planning 4D-CT scans were analysed using our clinical workflow involving deformable propagation of the delineated target to all phases. Similarly, acquisition of the 4D-CBCT data followed the clinical workflow based on XVI 5.0 available on Elekta linacs. Differences and correlations of the peak-to-peak motion on the planning CT and at treatment were analysed.
Results
On the planning CT, a total of 81.4% of the tumours had a peak-to-peak motion <10 mm, and 96.1% had <20 mm. The largest motion was observed in the CC direction, with largest amplitude for tumours located in the caudal posterior part of the lung. The difference in amplitude in CC between planning CT and first fraction had a mean and standard deviation of 0.3 mm and 3.5 mm, respectively, and the largest differences were observed in the caudal posterior part of the lung. Patients with a difference in tumour motion amplitude exceeding two standard deviations (>7 mm) at the first fraction were evaluated individually, and they all had poor 4DCT image quality. The difference between the first and second/third fractions had a mean and standard deviation of 0.4 mm/0.5 mm and 2.0 mm/1.9 mm.
Conclusion
Tumour motion at first treatment was similar to motion at planning, and motion at subsequent treatments was very similar to motion at first treatment. Large tumour motions are located towards the caudal posterior tumour locations. Patients with poor 4D-CT image quality should be closely followed at the first treatment to verify the motion.
Introduction
Geometrical uncertainties in radiotherapy are typically dealt with by introducing geometrical margins and the irradiation of larger volumes, where the extra irradiated volume consists of healthy tissue. Hence, there is a need to cleverly estimate the smallest margin that, with a high probability, will allow a sufficient dose to the target.
One example of a geometric uncertainty is respiratory motion; respiration will cause motion of a tumour in the lungs. This issue can be handled in different ways. One method is to use advanced techniques at each treatment session to reduce the uncertainty, such as performing daily treatment adaptation utilising the motion measured just before the treatment [Citation1], using tracking methods [Citation2–4], or deep breath-hold treatment [Citation5]. However, a large proportion of patients are treated without any of these methods. In that case, the treatment plan must take into account the respiration motion measured during treatment planning. Different techniques to determine respiratory motion are used prior to treatment planning, such as fluoroscopy, slow computed tomography (CT) and 4 dimensional computer tomography (4D-CT), with some recipe to subsequently estimate necessary margins [Citation6–10]. In common for these later techniques is the assumption that the tumour motion during treatment is accurately estimated prior to treatment planning, i.e., over a time interval of several weeks from planning to the end of the treatment course.
Intrafractional motion of tumours in the lung has been examined previously. A variety of lung tumours were studied by Gottlieb et al. [Citation11], while the motion of small tumours in the lung has been studied by Sarudis et al. [Citation12]. Yvette Seppenwoolde et al. [Citation13] and Bissonnette et al. [Citation14] evaluated tumour motion in small cohorts of patients treated with SBRT, while Liang et al. [Citation15] analysed SBRT treatments on a Cyberknife system. Steiner et al. [Citation16] studied SBRT treatment by means of 4D-CT, 4D-CBCT, and Calypso transponders. These studies revealed similar amplitudes of the respiratory motion of lung tumours but were all on small cohorts.
The current study aims to evaluate the stability of the respiratory motion during a radiotherapy course in a large patient cohort. In the present study, the respiratory motion for 483 tumours located peripherally in the lung and treated with stereotactic body radiotherapy (SBRT). The tumour motions were measured prior to radiotherapy using 4D-CT and during treatment using 4 dimensional cone beam computed tomography (4D-CBCT), and the stability of the respiration motion during treatment was evaluated.
Material and methods
The present study included all the 461 patients that were stereotactically irradiated for a peripheral tumour in the lung for two years (September 2017–August 2019). The majority of patients were treated for a primary lung tumour, but some cases involved metastatic tumours from other cancer sites (). Primary and metastatic tumours entered the analysis in the same manner and are in this article referred to simply as ‘tumours’. All patients were treated in three fractions to a prescribed dose at the edge of the gross tumour volume (GTV) of either 66 Gy (22 Gy per fraction) or 45 Gy (15 Gy per fraction). For seven patients, no proper 4D-CT could be obtained, and further 13 patients did not have a 4D-CBCT at all three fractions; these 20 patients were consequently excluded from the analysis. Some of the patients were treated for multiple targets; thus, motions of 483 tumours in 441 patients were analysed. Patient characteristics are summarised in .
Table 1. Patient characteristics.
For each patient, a spiral CT scan was acquired using a Philips Brilliance Big Bore CT scanner. An elastic belt was positioned around the abdomen that expands and contracts with respiratory motion. The motion signal was then synchronised with the spiral CT in order to obtain the 4D-CT scan [Citation17]. As for our clinical workflow MIM Maestro (MIM Software Inc., Beachwood, OH, USA) was used to extract the motion information from the 4D-CT scans using a customised workflow. The workflow uses an approximate tumour delineation in one respiration phase and propagates this to the remaining nine phases using deformable registration of the tumour position in the lung. The resulting estimated tumour position on each respiration phase is verified by manually inspecting a cine view of the 4D-CT with the propagated tumour delineation superimposed. The centroids of the propagated contours are used to represent the tumour position within each respiration phase. The peak-to-peak distance of the centroid positions was obtained for the primary patient axes: anterior/posterior (AP), left/right (LR), and cranio/caudal (CC). The respiration phase for which the centroid position is closest to the mean centroid position was selected for treatment planning [Citation17] and used for the 4D-CBCT reference match.
A 4D-CBCT scan was acquired prior to each treatment fraction using the on-board kV-CBCT system at an Elekta Synergy or an Elekta Versa HD linear accelerator. Within the XVI software (version 5.0), the respiratory signal was obtained using an algorithm that automatically extracts the position of the diaphragm from the individual projection images [Citation18]. Each of the resulting 10 respiration phases of the 4D-CBCT was within the XVI system rigidly co-registered to the planning CT with a 3D translation. The automatic registration performed within the XVI software was based on the image information within the delineated planning target volume (PTV) – a soft tissue match. The difference between the registration of the 10 phases represents the tumour motion, and the peak-to-peak motion was extracted from the XVI system for all treatment fractions.
The peak-to-peak motion measured in the planning 4D-CT was compared to the peak-to-peak motion measured from the 4D-CBCT from the first treatment fraction for each patient. Furthermore, the peak-to-peak motion from the first treatment fraction was compared to peak-to-peak motion measured at the second and third treatment fraction. The correlation of tumour volume and position with the observed motion and variation in motion over the treatment course was investigated. The associations were described using Pearson’s correlations and linear regression. Parameter selection for the multivariable linear regression model was based on a backward variable selection using a variable removal threshold of 5%.
The tumour volume was measured as the GTV delineated volume during treatment planning. The tumour position within the lungs on the planning CT was for the individual patients measured as the relative position within the minimal box surrounding the lungs, denoted PosAP, PosLR, and PosCC. The box had zero position at the most basal, right, and anterior lung position. Thus, apical, left, and posterior lung positions are represented by values close to unity. An additional lateral parameter, lateral-centre, was calculated to reflect the lateral position relative to the centre of the patient; thus, lateral-centre will be close to unity for very left as well as and right placed tumours (lateral-centre=two times the absolute value of the lateral position minus a half).
Besides, the linear regression model, Scatter and Bland–Altman plots were used to visualise the motion measured on the planning CT and during treatment. Finally, the Brown–Forsythe test was used to measure whether variations between two sets of motion measurements deviate from the variations between another set of observation, e.g., the differences in planning CT and first treatment fraction versus the variation between first and second treatment fractions. The statistical significance level for all test was set at 5%. Due to six multiple uses of the Brown–Forsythe test, the significance levels for these were set to 0.8% based on the Bonferroni correction method.
Results
For the entire cohort, the median and quartiles of the motion on the planning CT in units of cm were 1.3 (0.8–2.2), 2.4 (1.4–3.7), and 4.3 (1.9–8.8) for the LR, AP, and craniocaudal direction, respectively. In the CC-direction, this motion was less than 10 mm for 81.4% of the tumours and less than 20 mm for 96.1% of the tumours. Overall survival from the first day of treatment was: 1 year 82.3%, 2 years 69.5%.
The peak-to-peak motion measured on planning CT and at first, second and third treatment fractions appear quite similar (). For the comparison between planning CT and first treatment fraction, the standard deviation of the CC motion difference shown in is for the entire cohort 3.5 mm with a mean value of 0.3 mm. The fan-shaped Bland–Altman plot visually indicates that the deviation depends on the measured motion, i.e., with small values of motion in the planning CT there is only small variations, and the tumours where there is a large variation between planning CT and first treatment all occur when there is a large tumour motion in the planning CT. To verify this statistically, the deviation values were divided into three groups (1) planning CT motion below 10 mm (n = 375), (2) motion between 10 and 20 mm (n = 68), and (3) motion above 20 mm (n = 18). Within each of these groups, the standard deviation of motion difference between the planning CT and first treatment was 3.2 mm, 5.5 mm, and 7.1 mm for groups 1, 2, and 3, respectively. Although a nominal increase is observed between all three groups, only the difference between group one versus group two and three showed statistically significant differences using the Brown–Forsythe test of equal variance (p < 10−3), whereas comparing groups 2 and 3 resulted in a p value of 0.34.
Figure 1. Upper row: scatter plots of the amplitude of CC motion on planning CT vs. the first fraction, and second and third fractions vs. the first fraction. Lower row: Bland–Altman’s plots of the same three cases. Solid lines show the mean, and dotted lines show twice the standard deviation.
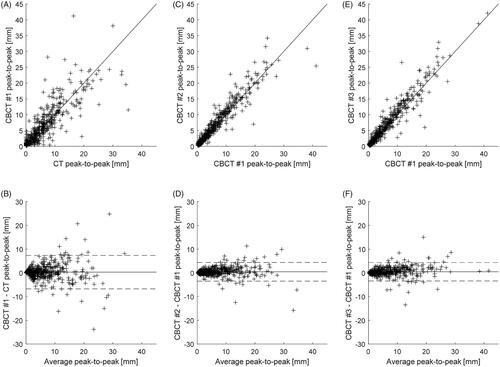
The standard deviation of the difference in peak-to-peak motion between the first treatment fraction versus the second and the third treatment fractions for the entire cohort was 2.0 mm and 1.9 mm, respectively, with related mean values was 0.4 mm and 0.5 mm (). Thus, a larger difference is observed between the planning CT and first treatment () relative to the variation observed between the individual treatments. The Brown–Forsythe test for equal variance showed that the deviation seen in was statistically significantly different from those seen in (p < 10−3), while the p value related to comparison of the standard deviations in resulted in a p value of 0.85.
The tumour volume and tumour location within the lungs as measured in the 4D-CT used for planning is shown in in a coronal and sagittal view. The marker size corresponds to the tumour volume; hence a larger marker size resemble a larger tumour volume (to keep marker size within a reasonable range 13 patients with volumes >30 cm3 are shown as 30 cm3). The marker colour corresponds to peak-to-peak motion measured on the planning CT in the CC direction of: <10 mm (blue), 10–20 mm (green), and >20 mm (red).
Figure 2. Bubble plots of tumour location in the lungs, observed from the front and left of the patient. Bubble size corresponds to tumour volume (limited to 30 mm diameter). Tumours with CC motion amplitude from 0 to 10 mm are coloured green, from 10 to 20 mm coloured blue and larger than 20 mm coloured red.
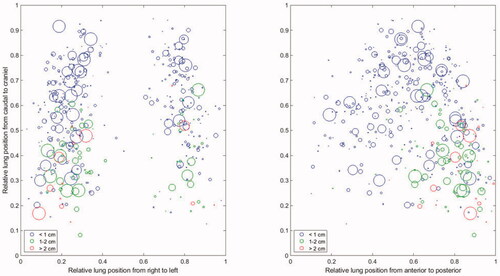
seems to indicate that the tumour motion is larger for tumours located in the posterior and basal part of the lung. A linear model aimed at predicting the CC motion on the planning CT, based on tumour volume and tumour positions as described in the method section, resulted in a model including only the AP and cranio-caudal position parameter:
The observed Pearson correlation between the CC motion and
was 0.495 and −0.597, respectively, and the model R2 was 0.433.
In order to analyse whether it would be possible to predict the patients with the largest difference between measured CC motion on the planning CT and at the first treatment fraction, a linear model aimed at predicting the absolute difference between these two measures was developed. The same predictors as for the motion model above was selected during the backward variable selection:
The observed Pearson correlations between the absolute observed difference and
were only 0.247 and −0.382, respectively, and the model R2 was 0.173.
Discussion
This study is a large-scale evaluation of the respiratory tumour motion amplitude for small pulmonary tumours over a course of stereotactic radiotherapy. For each patient, this amplitude was determined on the planning CT and at each treatment fraction, and the amplitude on the planning CT was compared to the amplitude at the first treatment fraction, and the amplitude at fractions 2 and 3 was compared to the amplitude at the first fraction. Furthermore, the influence of the tumour position in the lung on the tumour motion was examined.
For the comparison between planning CT and first treatment fraction, there is an overall good agreement of the tumour tracking with a mean difference of −0.3 mm and a standard deviation of 3.3 mm in the CC direction. This is despite the two very different image acquisition techniques (4D-CT versus 4D-CBCT) and different ways of determining tumour position in the various respiration phases (deformable versus rigid registration).
The comparison between the first and the subsequent fractions shows even better agreement. The time elapsed from planning CT to first treatment (app. seven days) is comparable to time from first to last fraction (4–6 days). Thus, the difference is likely not related to differences in the time interval. A possible explanation could be that the algorithm for measuring tumour motion on the CBCT [Citation18] is more robust since it uses a more direct measure of respiration to separate the images into respiration phases.
Previous studies have also demonstrated the robustness of the respiratory motion amplitude during a course of SBRT in the lung. Bissonnette et al. [Citation14] evaluated tumour motion in a small cohort of patients treated with SBRT and concluded that the inter-fractional changes in amplitude were small. At the time of that study, 4D-CBCT was not available, and repeat 3D-CBCTs estimated the motion amplitude at the time of treatment. Gottlieb et al. [Citation11] used off-line tools to create 4D-CBCT images from a standard 3D-CBCT, and concluded that tumour motion trajectories are robust during a longer course of radiotherapy. Both Gottlieb et al. [Citation11] and Sarudis et al. [Citation12] concluded that an inferior posterior tumour location was more likely to have a CC motion with a large amplitude. Steiner et al. [Citation16] compared respiratory motion of small lung tumours measured by 4D-CT, 4D-CBCT, and Calypso RF transponders and concluded that 4D-CT and 4D-CBCT underestimate the range of motion. The same was observed by Liang et al. [Citation15] in an analysis of SBRT treatments on a Cyberknife system, where the tumour motion at the time of treatment was estimated by repeated orthogonal kV images and machine log-files. The range of tumour motions found in these various studies was all in line with the present study [Citation11–16].
As part of the study, a simple linear model aimed at predicting the motion during treatment planning was created. The aim of the model was to investigate the possibility, based on available information from diagnostic images available prior to RT, to predict subgroups of patients for which 4DCT might not be needed. The model shows that the two significant predictors were and
with the longitudinal position being the primary predictor (larger regression constant) showing more motion caudal than cranial. However, also the
is significant with more motion for tumours placed posterior in the lungs. Thus, the tumours that move the least is positioned cranially and anteriorly. But, the model's predictability with an R2 of only 0.433 shows that a large variation around the predicted values exists. Therefore, it is challenging to predict subgroups of patients for which 4D-CT is not warranted based on the diagnostic image information. Furthermore, it was analysed if it was possible to predict which patients had an increased tendency of large differences between the motion measured at treatment planning and the first treatment fraction. If so, it would be possible to pay particular attention to that subgroup of patients. As for the overall motion both
and
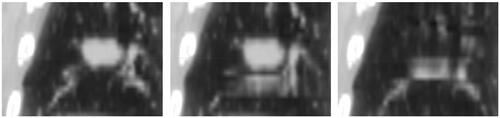
are statistically significant predictors. However, due to the quite low R2 of only 0.173 the clinical impact of such a model would be minimal. Thus, it is not possible based on a simple linear model to predict the tumour motion or tumour motion difference during treatment planning and first treatment fraction based on volume and position information from diagnostic images. Therefore, to study the cause of the observed difference in more detail, tumours with large motion differences (i.e., outside the ±two standard deviation range in the Bland–Altman plots in ) were evaluated individually and was invariably associated with poor 4D image quality, e.g., 4D-CT image artefacts. For some patients, the 4D-CT could even visualise the tumour as split into separate independent volumes during parts of the respiration cycle. It is noteworthy that this did not stem from undesired effects of the deformable registration. A patient example of poor 4D-CT image quality is shown in , where the tumour appears twice or is completely missing in one or several phases. This makes it very changeling to delineate the true tumour shape needed for treatment planning and can result in both an over- and under-estimate of the tumour peak-to-peak motion. Based on this observation, it is recommended to immediately review 4D image quality upon completion of the planning 4D-CT scan. If the image quality is compromised, rescanning the patient should be considered prior to delineation and planning.
Figure 3. Coronal slice in three different respiration phases of a problematic 4D-CT. The present image artefacts were caused by irregular breathing pattern and were not discovered during the 4D-CT but before planning and treatment. Consequently, the 4D-CBCT was examined closely after the first treatment session.
Attention is especially warranted when tumour tracking with poor image quality is used to determine an appropriate treatment margin. When the respiratory tumour motion cannot be properly determined, margins can be estimated either too large, which will result in excessive dose to normal tissue, or too small, which will compromise the target dose. Which of the two issues that are the major problem is partly linked to the prescribed dose. For the patients in the present study who receive 66 Gy in three fractions, a high biological dose, tumour eradication is likely close to total, even if the tumour briefly approaches the limit or even temporarily leaves the irradiated volume. Thus for those patients, the main problem will be a too large irradiation volume. However, the situation could be more mixed for the patients receiving 45 Gy in three fractions, which is a substantially lower biological dose.
With this in mind, a solution for verifying the applied margin could be to thoroughly review the CBCT scan after the first treatment fraction for tumour shape and peak-to-peak motion to determine if either replanning with different margins or a resimulation is needed.
Conclusion
Overall, the tumour motion at first treatment was similar to the motion at planning, and the tumour motion at subsequent treatments was very similar to the motion at first treatment. Tumours with large motions are located towards the caudal and posterior directions. Simple linear models based on tumour position and volume were not able to predict subgroups of patients with limited respiration motion or subgroup with increased likelihood of large motion deviation between treatment planning and treatment. The main reason for the large motion difference in the current cohort seems to be related to poor 4D-CT image quality. Thus, it is recommended that the obtained image quality of the patient-specific 4D-CT is carefully evaluated. Furthermore, evaluation of motion and tumour shape might be relevant during treatment, particularly if the 4D-CT planning scans have reduced image quality.
Disclosure statement
No potential conflict of interest was reported by the author(s).
References
- Al-Ward S, Wronski M, Ahmad SB, et al. The radiobiological impact of motion tracking of liver, pancreas and kidney SBRT tumors in a MR-linac. Phys Med Biol. 2018;63(21):215022.
- Fast MF, Nill S, Bedford JL, et al. Dynamic tumor tracking using the Elekta Agility MLC. Med Phys. 2014;41(11):111719.
- Keall PJ, Aun Ng J, O'Brien R, et al. The first clinical treatment with kilovoltage intrafraction monitoring (KIM): a real-time image guidance method. Med Phys. 2015;42(1):354–358.
- Murtaza G, Toftegaard J, Khan EU, et al. Volumetric modulated arc therapy with dynamic collimator rotation for improved multileaf collimator tracking of the prostate. Radiother Oncol. 2017;122(1):109–115.
- Latty D, Stuart KE, Wang W, et al. Review of deep inspiration breath-hold techniques for the treatment of breast cancer. J Med Radiat Sci. 2015;62(1):74–81.
- van Herk M, Remeijer P, Rasch C, et al. The probability of correct target dosage: dose-population histograms for deriving treatment margins in radiotherapy. Int J Radiat Oncol Biol Phys. 2000;47(4):1121–1135.
- van Herk M. Errors and margins in radiotherapy. Semin Radiat Oncol. 2004;14(1):52–64.
- Keall P, Mageras G, Balter J, et al. The management of respiratory motion in radiation oncology report of AAPM Task Group 76. Med Phys. 2006;3(10):3874–3900.
- Topolnjak R, van Vliet-Vroegindeweij C, Sonke JJ, et al. Breast-conserving therapy: radiotherapy margins for breast tumor bed boost. Int J Radiat Oncol Biol Phys. 2008;72(3):941–948.
- Nielsen TB, Hansen VN, Westberg J, et al. A dual centre study of setup accuracy for thoracic patients based on cone-beam CT data. Radiother Oncol. 2012;102(2):281–286.
- Gottlieb KL, Hansen CR, Hansen O, et al. Investigation of respiration induced intra- and inter-fractional tumour motion using a standard cone beam CT. Acta Oncol. 2010;49(7):1192–1198.
- Sarudis S, Karlsson Hauer A, Nyman J, et al. Systematic evaluation of lung tumor motion using four-dimensional computed tomography. Acta Oncol. 2017;56(4):525–530.
- Yvette Seppenwoolde HS, Kitamura K, Shimizu S, et al. Precise and real-time measurement of 3D tumor motion in lung due to breathing and heartbeat, measured during radiotherapy. Int J Radiat Oncol Biol Phys. 2002;53(4):822–834.
- Bissonnette JP, Franks KN, Purdie TG, et al. Quantifying interfraction and intrafraction tumor motion in lung stereotactic body radiotherapy using respiration-correlated cone beam computed tomography. Int J Radiat Oncol Biol Phys. 2009;75(3):688–695.
- Liang Z, Yang J, Liu H, et al. Real-time tumor motion monitoring and PTV margin determination in lung SBRT treatment. Acta Oncol. 2019;58(12):1786–1789.
- Steiner E, Shieh CC, Caillet V, et al. Both four-dimensional computed tomography and four-dimensional cone beam computed tomography under-predict lung target motion during radiotherapy. Radiother Oncol. 2019;135:65–73.
- Wolthaus JW, Schneider C, Sonke JJ, et al. Mid-ventilation CT scan construction from four-dimensional respiration-correlated CT scans for radiotherapy planning of lung cancer patients. Int J Radiat Oncol Biol Phys. 2006;65(5):1560–1571.
- Sonke JJ, Zijp L, Remeijer P, et al. Respiratory correlated cone beam CT. Med Phys. 2005;32(4):1176–1186.