
 ?Mathematical formulae have been encoded as MathML and are displayed in this HTML version using MathJax in order to improve their display. Uncheck the box to turn MathJax off. This feature requires Javascript. Click on a formula to zoom.
Abstract
Background
Accurate target volume delineation is a prerequisite for high-precision radiotherapy. However, manual delineation is resource-demanding and prone to interobserver variation. An automatic delineation approach could potentially save time and increase delineation consistency. In this study, the applicability of deep learning for fully automatic delineation of the gross tumour volume (GTV) in patients with anal squamous cell carcinoma (ASCC) was evaluated for the first time. An extensive comparison of the effects single modality and multimodality combinations of computed tomography (CT), positron emission tomography (PET), and magnetic resonance imaging (MRI) have on automatic delineation quality was conducted.
Material and methods
18F-fluorodeoxyglucose PET/CT and contrast-enhanced CT (ceCT) images were collected for 86 patients with ASCC. A subset of 36 patients also underwent a study-specific 3T MRI examination including T2- and diffusion-weighted imaging. The resulting two datasets were analysed separately. A two-dimensional U-Net convolutional neural network (CNN) was trained to delineate the GTV in axial image slices based on single or multimodality image input. Manual GTV delineations constituted the ground truth for CNN model training and evaluation. Models were evaluated using the Dice similarity coefficient (Dice) and surface distance metrics computed from five-fold cross-validation.
Results
CNN-generated automatic delineations demonstrated good agreement with the ground truth, resulting in mean Dice scores of 0.65–0.76 and 0.74–0.83 for the 86 and 36-patient datasets, respectively. For both datasets, the highest mean Dice scores were obtained using a multimodal combination of PET and ceCT (0.76–0.83). However, models based on single modality ceCT performed comparably well (0.74–0.81). T2W-only models performed acceptably but were somewhat inferior to the PET/ceCT and ceCT-based models.
Conclusion
CNNs provided high-quality automatic GTV delineations for both single and multimodality image input, indicating that deep learning may prove a versatile tool for target volume delineation in future patients with ASCC.
Background
Anal squamous cell carcinoma (ASCC) is a rare malignancy with increasing global incidence [Citation1], for which chemoradiotherapy is the standard curative treatment [Citation2]. Modern radiotherapy (RT) techniques such as intensity-modulated RT (IMRT) deliver highly conformal dose distributions to the target volume (TV), ensuring high tumour control and reduced normal tissue doses with a subsequent decrease in acute and late toxicities [Citation2]. IMRT has been shown to be superior to three-dimensional (3D) conformal RT in reducing acute toxicity in patients with ASCC [Citation3]. However, the reduced TV margins and steep dose gradients resulting from high precision RT require consistent and precise TV delineations [Citation4,Citation5].
Manual TV delineation is a highly resource-demanding task and has been recognised as a main source of uncertainty within the RT workflow [Citation4]. Inadequate TV definition can potentially lead to under-dosing of the tumour, thereby increasing relapse risk, or result in increased morbidity [Citation5–7]. Guidelines, delineation atlases and quality assurance protocols decrease delineation variability [Citation4–6,Citation8], yet interobserver variations remain an issue, with considerable delineation discrepancies occurring in approximately 10% of RT plans [Citation5].
The optimal imaging modalities for TV delineation remain unclear for many diagnoses [Citation4,Citation5,Citation7], including ASCC [Citation9]. Patients with ASCC may undergo several imaging procedures in conjunction with staging and RT planning, including computed tomography (CT), magnetic resonance imaging (MRI) and/or positron emission tomography (PET) using 18F-fluorodeoxyglucose (FDG) [Citation2,Citation10]. Pelvic MRI is considered state-of-the-art imaging for ASCC and is used routinely for staging at many European centres, as it provides superior soft-tissue contrast resulting in detailed information on local and regional tumour extent [Citation11]. PET has a high sensitivity for detecting primary, regional and metastatic disease [Citation12], and should be considered for RT planning according to U.S. guidelines [Citation10]. TV delineation for ASCC is commonly performed in RT planning CT images. Ideally, the CT images should be co-registered with MR and/or PET images [Citation13], but this practice varies. According to current guidelines [Citation8] all available clinical and image information should be used when contouring gross tumour volumes (GTVs) for IMRT.
The more extensive use of multimodality image interpretation accompanying modern RT techniques as well as the requirement of highly accurate delineations has increased TV contouring time substantially [Citation5,Citation7]. It is therefore of vital importance to develop and evaluate methods to improve the efficacy and accuracy of TV delineation. Deep convolutional neural networks (CNNs) have successfully been used for automatic tumour delineation in a range of diagnoses [Citation14]. Using CNNs to support manual GTV delineations can reduce contouring time and delineation variability [Citation15]. CNNs can further be used for systematic studies of the impact of imaging modality on automatic delineation quality by introducing single or multiple input channels to the network [Citation16,Citation17].
Automated TV delineation for ASCC using deep learning has to our knowledge not yet been explored. However, the widespread use of IMRT and multimodality imaging, as well as the proximity of TVs and critical organs such as the small bowel and bladder [Citation2], suggest that auto-delineation could be advantageous for this group of patients. In this study, we investigated the use of a deep two-dimensional (2D) CNN for fully automatic GTV delineation of ASCC. As ASCC patients may undergo various imaging procedures, we conducted a comprehensive comparison of the effects single modality and multimodality combinations of CT, PET and MRI sequences have on the quality of CNN-generated auto-delineations.
Material and methods
Patient cohort and imaging
ASCC patients scheduled for curative chemoradiotherapy at Oslo University Hospital between 2013 and 2016 and enrolled in the prospective ANCARAD observational study (NCT01937780) [Citation18] were included. The study was approved by the Regional Ethics Committee, and all patients gave written informed consent. Patients with biopsy-proven ASCC and visible tumour on baseline PET, previously included for analysis in [Citation19], were eligible (= 93). Staging was performed according to the 7th edition AJCC tumour–node–metastasis (TNM) system [Citation20]. RT was delivered with volumetric modulated arc therapy/IMRT (n = 62) or 3D conformal RT (n = 31) to doses of 54 or 58 Gy. Concomitant chemotherapy with one or two cycles of mitomycin C and 5-fluorouracil was given to most patients.
Patients without an RT planning contrast-enhanced CT (ceCT) scan acquired with Iomeron® contrast agent were excluded from the present study, resulting in 86 patients with a complete set of pre-treatment PET and planning ceCT images. PET was performed with a non-enhanced low-dose CT (ldCT) scan. A subset of 36 patients had consented to a study-specific 3T MRI examination before treatment, with a dedicated protocol including T2- and diffusion-weighted sequences (T2W and DW, respectively). See Supplementary Table A1 for image acquisition details.
To properly assess the effect of MRI sequences on auto-delineation quality, both in combination and comparison with other modalities, the included patients were analysed as two separate datasets consisting of: (i) PET, ldCT and ceCT images (n = 86) and (ii) PET, ldCT, ceCT, T2W and DW images (n = 36), hereinafter referred to as DS-86 and DS-36 respectively. Patient characteristics are given in .
Table 1. Patient and tumour characteristics for the DS-86 and DS-36 datasets.
Manual contouring
Contouring was performed in the Eclipse Treatment Planning System (Varian Medical Systems – Palo Alto, CA, USA) by a trained oncologist (C.U.) supported when necessary by an experienced MR radiologist (B.H.) and/or a nuclear medicine specialist (E.H.). The GTV was manually delineated to include the visible tumour and the circumference of the anal canal and/or rectum when involved, as seen on axial images, according to current practice [Citation8,Citation21]. GTV contours were defined in the planning ceCT image basis, supported by PET and MR T2W images, where T2W images were acquired with a standard (i.e. not study-specific) MRI protocol. Involved lymph nodes were not evaluated in the present study.
Image pre-processing
Images were imported to the MICE toolkit (NONPI Medical AB, Umeå, Sweden) and co-registered using rigid transformation and mutual information criteria [Citation22]. The image matrices were linearly interpolated to the reference frame and resolution of the planning ceCT. A representative volume of interest (VOI), encompassing approximately the same pelvic region in the image series was selected for all patients (median in-plane matrix dimensions: 188 × 188; median number of image slices per patient: 41) during co-registration. This reduced memory consumption and computational burden throughout the analysis. The VOI was selected to be as large as possible, keeping the patient in the centre of axial image slices, but at the same time excluding irrelevant areas outside the patient.
The DW series was condensed into an apparent diffusion coefficient (ADC) map by regression analysis [Citation23], using b-values of 200, 400, 600, 800 mm2/s, to produce images reflecting water diffusion. The condensation into one single image series also made the impact of this MRI sequence comparable to the other single modality image series.
The study-specific DW sequence did not cover the entire tumour for all patients. This was also the case for some T2W image series. The affected image slices, mostly containing peripheral tumour regions located cranially or caudally, were also removed from the other image series in DS-36, reducing the number of slices in this dataset by about 14%.
Both CT series were pre-processed using a narrow soft-tissue window, with centres and widths defined as the mode and two times the standard deviation, respectively, of the intensity values within manual GTV delineations. This resulted in ldCT and ceCT window settings ({centre, width}) of {32, 220} HU and {70, 300} HU, respectively.
After VOI-definition and elimination of image slices with insufficient MRI field-of-view from DS-36, approximately 50% of the slices in the two datasets did not contain manual GTV delineations. To focus model training on delineation of the GTV, 80% of the slices without manual delineations were randomly removed from the datasets. The resulting number of image slices in DS-86 and DS-36 are given in Supplementary Table A2.
CNN architecture and training
A 2D U-Net CNN architecture [Citation24] with the Dice loss function [Citation25] was implemented for GTV delineation in axial image slices using Python and TensorFlow (see Supplementary Appendix B for architecture details). The U-Net was preferred over more recent architectures as it is a mature network with documented strong performance, often surpassing specialised deep learning pipelines for a wide range of medical applications and diagnoses [Citation26]. Due to the limited number of training samples and the large number of input modalities and combinations thereof, as well as the FOV limitations of the MRI sequences, we used a 2D rather than a 3D architecture, thus reducing the number of trainable parameters and GPU-memory requirements.
Five-fold cross-validation was used to acquire a robust estimate of CNN performance. Each dataset was divided into five cross-validation folds (Supplementary Table A2) using stratified random sampling to ensure comparable GTV distributions across folds. The manual GTV delineations constituted the ground truth used for training and evaluation. Models were trained using the Adam optimiser with standard parameters and a learning rate of 10−4 [Citation27]. The effect of imaging modality and modality combinations was assessed for both datasets by training separate single and multimodality models based on the available image input. In the case of multimodal models, each image modality was treated as a separate network input channel. All evaluated model inputs are specified in (DS-86) and Citation2 (DS-36).
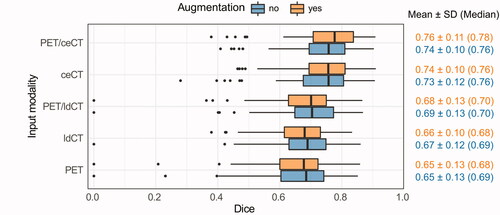
Figure 1. Box plots of the cross-validation Dice scores (DS-86 dataset). CNN models were trained on different modalities (y-axis) with or without image augmentation (orange vs. blue). Dice: Dice similarity coefficient; SD: standard deviation; PET: positron emission tomography; ceCT: contrast-enhanced computed tomography; ldCT: low-dose computed tomography.
Expanding the number of training images by adding modified versions of the existing image data (image augmentation) has been shown to increase CNN model performance for TV delineation [Citation28]. To assess the impact of such increased input variance, all our experiments were run without and with image augmentation, consisting of randomised, excessive elastic image deformation [Citation29] applied on a random subset of 50% of the images during training.
Performance evaluation
CNN performance was first evaluated using the Dice similarity coefficient (Dice) [Citation30], describing the spatial overlap between voxels belonging to the ground truth and the auto-delineations. Perfect and no overlap corresponds to Dice scores of 1 and 0, respectively. Models were further assessed using the 95th percentile Hausdorff distance (HD95) [Citation31] and the average and median Hausdorff surface distances (ASD and MSD) between the ground truth and automatic GTV contours. Performance metrics were calculated on a per-patient basis, as defined in Supplementary Appendix C.
Statistical analysis
Effects of imaging modality and image augmentation on cross-validation Dice were evaluated using the non-parametric Friedman test [Citation32] followed by Nemenyi multiple pairwise comparisons [Citation33] (PMCMRplus R package [Citation34]) and the paired Wilcoxon signed-rank test in R, respectively. Statistical tests were two-sided with a significance level of 0.05.
Results
Cross-validation Dice scores of models based on different image inputs are shown in (DS-86) and Citation2 (DS-36). Several single and multimodality models had good overlap with the ground truth (mean Dice 0.75–80). The highest mean Dice was obtained for PET/ceCT or ceCT (DS-86; ) and PET/ceCT, PET/ceCT/T2W or ceCT (DS-36; ). PET, ldCT and ADC resulted in the poorest overall Dice scores.
Figure 2. Box plots of the cross-validation Dice scores (DS-36 dataset). CNN models were trained on different modalities (y-axis) with or without image augmentation (orange vs. blue). Dice: Dice similarity coefficient; SD: standard deviation; PET: positron emission tomography; ceCT: contrast-enhanced computed tomography; T2W: T2-weighted; ldCT: low-dose computed tomography; ADC: apparent diffusion coefficient.
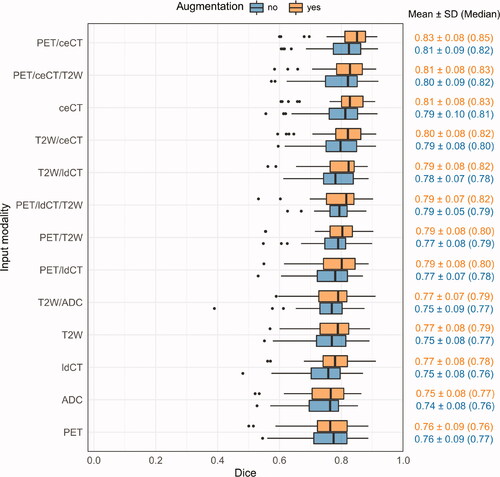
Overall cross-validation Dice performances were somewhat poorer for DS-86 () than for DS-36 (). This was explained by a higher number of difficult delineation cases in DS-86. The most problematic DS-86 patients had a substantial number of image slices without ground truth delineations, where the CNN falsely delineated a contour. The two patients where the PET, ldCT or PET/ldCT models failed completely (Dice ∽ 0–0.2) also had atypical PET uptake or an irregular shape of the ground truth GTV. Such difficult patients were not present in the DS-36 dataset, which contained fewer challenging delineation cases. This was in part attributed to the limited FOV of the DS-36 MRI series (see Material and methods: Image pre-processing). The model rankings according to cross-validation Dice ( and ) were, however, consistent between DS-86 and DS-36, indicating agreement on the effect of the imaging modalities common for both sets.
Randomised image augmentation gave moderate increases in mean and median Dice for most models ( and ; Wilcoxon signed-rank test; DS-86: not significant; DS-36: p < 0.001). Furthermore, the DS-86 models based on PET/ceCT and ceCT obtained significantly better Dice than PET/ldCT, PET and ldCT-based models (Supplementary Table D1), whereas no significant difference was found between the PET/ceCT and ceCT-based models. Similar trends were detected for the smaller DS-36 set, where the PET/ceCT model obtained significantly better Dice than all other models except those based on PET/ceCT/T2W or ceCT (models with image augmentation; Supplementary Table D2). Furthermore, the DS-36 ceCT model (with augmentation) obtained significantly better Dice than all other single-modality models, including T2W.
HD95, ASD and MSD performances of selected single and multimodality models are given in (see Supplementary Table E1 for all model results). The models obtaining the highest mean and median Dice scores generally also gave the lowest distance-based metrics. For both datasets, the PET/ceCT and ceCT models resulted in median MSD smaller than or equal to the slice thickness of the planning ceCT (2.50 mm). As for the Dice metric, the larger distance metrics of DS-86 can be explained by the higher incidence of difficult delineation cases. On a per-patient basis, there was a significant negative correlation between Dice and each distance-based metric for the top-ranked DS-36 and DS-86 PET/ceCT models (Spearman’s rank correlation; Supplementary Figure E1). For DS-86 a small sub-group of patients with smaller and less distinct tumours (stage T1–T2) showed poor performance (Supplementary Figure E1 (a)). No other tumour stage groupings were seen.
Table 2. Distance-based performance metrics for selected single and multimodality models (with image augmentation).
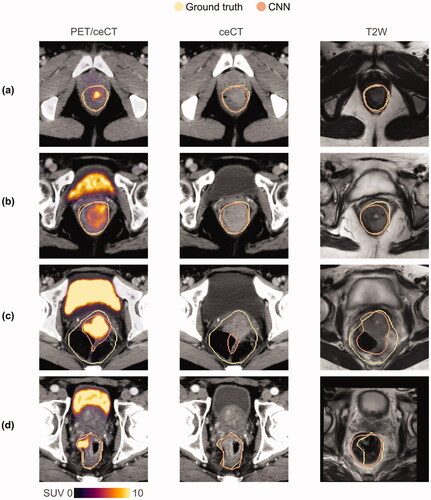
Example auto-delineations are shown in for models based on PET/ceCT, ceCT and T2W images, respectively (see also Supplementary Videos E1 and E2). All three models gave high-quality GTV auto-delineations for most image slices (), but the T2W model generally had a somewhat lower overlap with the ground truth (). The models could result in poor auto-delineations for atypical image slices. Particularly very large ground truth GTVs, often including heterogeneous regions with up to several substantial air-filled zones were challenging (). All models were also prone to delineating false-positive regions encompassing the rectum or anal canal circumference in slices not containing a ground truth delineation (see Supplementary Videos E1 and E2 for examples). Though the PET/ceCT and ceCT models resulted in very similar auto-delineations, the PET/ceCT model generally gave the most refined auto-delineations for somewhat atypical GTVs ().
Figure 3. Manual ground truth (yellow) and CNN-generated (orange) GTV contours in representative image slices (a–d) for the DS-36 dataset. CNN-generated auto-delineations were based on (from left) PET/ceCT, ceCT and T2W images, respectively. These DS-36 auto-delineations were representative of the corresponding DS-86 results. CNN: convolutional neural network; GTV: gross tumour volume; PET: positron emission tomography; ceCT: contrast-enhanced computed tomography; T2W: T2-weighted; SUV: standardised uptake value.
Discussion
In this study, deep learning for automatic GTV contouring in patients with ASCC was evaluated for the first time. The 2D U-Net approach produced high-quality GTV delineations for a range of single or multimodality CT, PET and/or MR image inputs (mean Dice 0.75–0.80). Our results suggest that deep learning tools could be useful for GTV contouring in ASCC patients, regardless of the exact imaging regimens.
Multimodality PET/ceCT images provided the highest mean agreement with the ground truth, but single modality ceCT models performed comparably well. Though the T2W-only models were inferior to ceCT-only models, the T2W-based model with image augmentation provided an acceptable mean Dice of 0.77. Combining all three modalities (PET/ceCT/T2W) did not increase DS-36 Dice performance, compared to PET/ceCT or ceCT-based models.
Using either PET/ceCT, ceCT or MRI for TV delineation could simplify the RT workflow, compared to using both MRI and ceCT or all three modalities. Both PET/ceCT and MRI-based auto-delineation is highly clinically relevant, as these modalities represent state-of-the-art practice in the U.S. and Europe. Single modality imaging with ceCT, on the other hand, is not considered state-of-the-art for ASCC diagnosis and staging [Citation2,Citation10], but TV delineation based solely on RT planning ceCT images could be relevant in some clinical settings due to cost and efficiency benefits. MRI is the imaging modality of choice for visualisation of tumour and normal tissue anatomy in the pelvic region, and MRI-only RT planning could therefore be relevant for patients with ASCC. The feasibility of MRI-only RT planning using synthetic CT (sCT) for dose calculations was recently studied for anorectal cancer patients, where results indicate that conditional generative adversarial networks can produce clinically acceptable sCT images [Citation35]. An MRI-only RT approach has certain potential advantages compared to using CT as primary and MRI as secondary RT planning modality, the most important being the avoidance of geometric uncertainties introduced by registration of CT and MRI and the possible cost and efficiency benefits of avoiding the CT scan [Citation36]. The latter could be particularly relevant within an adaptive RT workflow based on MR-only imaging [Citation36], where auto-delineation may play a key role in making the required replanning feasible. Further exploration of MRI-based auto-delineation of both TVs and OARs in patients with ASCC is, therefore, warranted.
The lowest mean Dice was obtained for models based solely on PET or ADC. As the manual GTV delineation in this study, following clinical practice, included the anal canal and/or rectum circumference, the ground truth may include areas of non-affected tissues and air volumes. This influences the CNN learning process, particularly for models based solely on functional imaging (PET, ADC) which is generally more cancer-specific than anatomical imaging with clearer boundaries between visible tumour tissue and surrounding regions included in the GTV. For example, FDG PET images have a higher correlation with tumour specimens than CT and MR (T2W) images [Citation37]. Moreover, manual tumour delineations based on ADC maps are significantly smaller than T2W-based delineations [Citation38]. Hence, our slightly poorer results for PET and ADC models could be related to the GTV definition, and our ranking of modalities may not translate to auto-delineation of visible tumour tissue only.
The limited number of training samples available in our datasets may have affected the generalisability and robustness of our models. Though the evaluated CNN generally performed well, the network failed on certain images. There are two main modes of failure, both likely related to the few representative training samples. First, the network delineates a false positive region encompassing the rectum and/or anal canal in many image slices without ground truth delineations. Second, the network struggles to correctly delineate atypical GTVs in general and particularly very large GTV contours, encompassing heterogeneous regions with multiple substantial air-filled areas, typical for patients with an anal abscess and/or fistula. Cross-institutional studies involving more patients, potentially using distributed learning for cross-centre training [Citation39], or using transfer learning [Citation40] based on other tumour sites could potentially alleviate some of these difficulties, thereby increasing model robustness and generalisability. A two-step procedure where image slices with tumour tissue are pre-selected, either manually or by a separate deep learning classification [Citation41], could further limit the former failure mode. For ASCC patients presenting with abscess, fistula or other conditions where the tumour is not fully visible, special attention to manual revision of the auto-delineated GTV contours would still be recommended.
For the more frequently occurring pelvic cancers, cervical squamous cell carcinoma, and rectal adenocarcinoma, CNNs for TV delineation have been explored but only for single modality PET [Citation42], T2W [Citation28,Citation43–47], or combined T2W/DW images [Citation48]. Reported mean Dice scores for T2W-based CNN auto-delineation of the visible rectal or cervical tumour volume (0.72–0.84) [Citation28,Citation43–47] are comparable to our T2W-based results (0.75–0.77). Combining T2W and DW images for auto-delineation of the visible rectal tumour did not improve mean Dice (0.70 [Citation48]), relative to the above T2W-only studies [Citation28,Citation43–47], which is consistent with our results for T2W and ADC. U-Net delineation of cervical tumours in PET images [Citation42] gave a mean Dice of 0.80, which is higher than our PET-only models (mean Dice: 0.65–0.76). This discrepancy is likely related to differences in TV definition. For auto-delineation of the rectum, previous studies obtained mean Dice values of 0.90–0.94 [Citation28,Citation45] for T2W and 0.79 [Citation49] for ceCT. The latter is comparable to our result for ceCT (0.73–0.81). Note that in [Citation28] and [Citation45] a very limited number of representative image slices (1–3) were selected from each patient, potentially affecting performance.
Few studies have evaluated the impact of imaging modality on interobserver variability for manual tumour delineations in ASCC [Citation9,Citation50,Citation51], where only [Citation9] included PET and ceCT images in addition to MRI sequences. Rusten et al. [Citation9] investigated the interobserver and inter-modality variability for PET/ceCT vs. MRI/ceCT-based delineations of the GTV and the visible tumour tissue in a subset of the patients (=19) included in our current study. The reported interobserver agreement was 0.80 and 0.74 (median Dice) for GTV delineations based on PET/ceCT and MRI/ceCT (including T2W and DW), respectively, which is somewhat lower than the median Dice obtained by our CNN approach for DS-36 (PET/ceCT: 0.82–0.85; T2W/ceCT: 0.80–0.82). Furthermore, the inter-modality agreement between PET/ceCT and MRI/ceCT corresponded to a median Dice of 0.75 for the GTV [Citation9], indicating good agreement between PET/ceCT and MRI/ceCT-based manual delineations. The latter is in accordance with our current results, where PET/ceCT and T2W/ceCT models provided similar auto-delineations.
In conclusion, our proposed CNN approach provided high-quality fully automatic GTV delineations in ASCC patients, based on either single or multimodality images. The overlap between CNN-generated auto-delineations and the ground truth was comparable to the interobserver agreement between experts performing manual GTV delineation in ASCC. This demonstrates the potential of CNN as a versatile tool for automatic TV delineation.
Supplemental Material
Download QuickTime Video (1.3 MB)Supplemental Material
Download QuickTime Video (1.3 MB)Supplemental Material
Download PDF (771.1 KB)Acknowledgements
We thank Ph.D. Per-Ivar Lønne and MD Kathinka Schmidt Slørdahl for assistance with the patient characteristics data.
Disclosure statement
No potential conflict of interest was reported by the author(s).
Additional information
Funding
References
- Islami F, Ferlay J, Lortet-Tieulent J, et al. International trends in anal cancer incidence rates. Int J Epidemiol. 2017;46(3):924–938.
- Rao S, Guren MG, Khan K, et al. Anal cancer: ESMO clinical practice guidelines for diagnosis, treatment and follow-up⋆. Ann Oncol. 2021;32(9):1087–1100.
- Kachnic LA, Winter K, Myerson RJ, et al. RTOG 0529: a phase 2 evaluation of dose-painted intensity modulated radiation therapy in combination with 5-fluorouracil and mitomycin-C for the reduction of acute morbidity in carcinoma of the anal canal. Int J Radiat Oncol Biol Phys. 2013;86(1):27–33.
- Segedin B, Petric P. Uncertainties in target volume delineation in radiotherapy – are they relevant and what can we do about them? Radiol Oncol. 2016;50(3):254–262.
- Cox S, Cleves A, Clementel E, et al. Impact of deviations in target volume delineation – time for a new RTQA approach? Radiother Oncol. 2019;137:1–8.
- Chang ATY, Tan LT, Duke S, et al. Challenges for quality assurance of target volume delineation in clinical trials. Front Oncol. 2017;7:221.
- Vinod SK, Jameson MG, Min M, et al. Uncertainties in volume delineation in radiation oncology: a systematic review and recommendations for future studies. Radiother Oncol. 2016;121(2):169–179.
- Ng M, Leong T, Chander S, et al. Australasian gastrointestinal trials group (AGITG) contouring atlas and planning guidelines for intensity-modulated radiotherapy in anal cancer. Int J Radiat Oncol Biol Phys. 2012;83(5):1455–1462.
- Rusten E, Rekstad BL, Undseth C, et al. Target volume delineation of anal cancer based on magnetic resonance imaging or positron emission tomography. Radiat Oncol. 2017;12(1):147.
- Benson AB, Venoo AP, Al-Hawary MM, et al. Anal carcinoma, version 2.2018, NCCN clinical practice guidelines in Oncology. J Natl Compr Canc Netw. 2018;16(7):852–871.
- Goh V, Gollub FK, Liaw J, et al. Magnetic resonance imaging assessment of squamous cell carcinoma of the anal canal before and after chemoradiation: can MRI predict for eventual clinical outcome? Int J Radiat Oncol Biol Phys. 2010;78(3):715–721.
- Jones M, Hruby G, Solomon M, et al. The role of FDG-PET in the initial staging and response assessment of anal cancer: a systematic review and meta-analysis. Ann Surg Oncol. 2015;22(11):3574–3581.
- Glynne-Jones R, Tan D, Hughes R, et al. Squamous-cell carcinoma of the anus: progress in radiotherapy treatment. Nat Rev Clin Oncol. 2016;13(7):447–459.
- Cardenas CE, Yang J, Anderson BM, et al. Advances in auto-segmentation. Semin Radiat Oncol. 2019;29(3):185–197.
- Lin L, Dou Q, Jin YM, et al. Deep learning for automated contouring of primary tumor volumes by MRI for nasopharyngeal carcinoma. Radiology. 2019;291(3):677–686.
- Guo Z, Li X, Huang H, et al. Deep learning-based image segmentation on multimodal medical imaging. IEEE Trans Radiat Plasma Med Sci. 2019;3(2):162–169.
- Guo Z, Guo N, Gong K, et al. Gross tumor volume segmentation for head and neck cancer radiotherapy using deep dense multi-modality network. Phys Med Biol. 2019;64(20):205015.
- Slørdahl KS, Klotz D, Olsen JÅ, et al. Treatment outcomes and prognostic factors after chemoradiotherapy for anal cancer. Acta Oncol. 2021;60(7):921–930.
- Rusten E, Rekstad BL, Undseth C, et al. Anal cancer chemoradiotherapy outcome prediction using 18F-fluorodeoxyglucose positron emission tomography and clinicopathological factors. BJR. 2019;92(1097):20181006.
- Edge SB, Compton CC. The American Joint Committee on Cancer: the 7th edition of the AJCC cancer staging manual and the future of TNM. Ann Surg Oncol. 2010;17(6):1471–1474.
- Glynne-Jones R, Goh V, Aggarwal A, et al. Anal carcinoma. In: Grosu AL, Nieder C, editors. Target volume definition in radiation oncology. Berlin: Springer; 2015. p. 193–218.
- Maes F, Collignon A, Vandermeulen D, et al. Multimodality image registration by maximization of mutual information. IEEE Trans Med Imaging. 1997;16(2):187–198.
- Freiman M, Voss SD, Mulkern RV, et al. In vivo assessment of optimal b-value range for perfusion-insensitive apparent diffusion coefficient imaging. Med Phys. 2012;39(8):4832–4839.
- Ronneberger O, Fischer P, Brox T, et al. U-Net: Convolutional networks for biomedical image segmentation. In: Navab N, Hornegger J, Wells W,., editors. Medical image computing and Computer-Assisted intervention – MICCAI 2015. MICCAI 2015. Munich: Springer; 2015. p. 234–241.
- Milletari F, Mavab N, Ahmadi S. V-net: Fully convolutional neural networks for volumetric medical image segmentation. In: 2016 Fourth International Conference on 3D vision (3DV); 2016 Oct 25–28; Stanford (CA). IEEE; 2016. p. 565–571.
- Isensee F, Jaeger PF, Kohl SAA, et al. nnU-Net: a self-configuring method for deep learning-based biomedical image segmentation. Nat Methods. 2021;18(2):203–211.
- Kingma DP, Ba JL. ADAM: A Method for Stochastic Optimization. arXiv:1412.6980 [Preprint]. 2014 [cited 2021 June 9]: [15 p.]. Available from: https://arxiv.org/abs/1412.6980
- Lee J, Oh JE, Kim MJ, et al. Reducing the model variance of a rectal cancer segmentation network. IEEE Access. 2019;7:182725–182733.
- Simard PY, Steinkraus D, Platt JC. Best practices for convolutional neural networks applied to visual document analysis. In: Proceedings of the Seventh International Conference on Document Analysis and Recognition; 2003 Aug 6; Edinburgh. New York (NY): IEEE; 2003. p. 958–63.
- Dice LR. Measures of the amount of ecologic association between species. Ecology. 1945;26(3):297–302.
- Huttenlocher DP, Klanderman GA, Rucklidge WJ. Comparing images using the hausdorff distance. IEEE Trans Pattern Anal Machine Intell. 1993;15(9):850–863.
- Friedman M. The use of ranks to avoid the assumption of normality implicit in the analysis of variance. J Am Stat Assoc. 1937;32(200):675–701.
- Hollander M, Wolfe DA, Chicken E. Nonparametric statistical methods. 3rd ed. Hoboken (NJ): Wiley; 2014.
- Pohlert T. PMCMRplus: Calculate Pairwise Multiple Comparisons of Mean Rank Sums Extended [software]. R package version 1.9.0; 2021. [cited 2021 June 9]. Available from: https://CRAN.R-project.org/package=PMCMRplus
- Bird D, Nix MG, McCallum H, et al. Multicentre, deep learning, synthetic-CT generation for ano-rectal MR-only radiotherapy treatment planning. Radiother Oncol. 2021;156:23–28.
- Jonsson J, Nyholm T, Söderkvist K. The rationale for MR-only treatment planning for external radiotherapy. Clin Transl Radiat Oncol. 2019;18:60–65.
- Buijsen J, van den Bogaard J, Janssen MHM, et al. FDG-PET provides the best correlation with the tumor specimen compared to MRI and CT in rectal cancer. Radiother Oncol. 2011;98(2):270–276.
- Rosa C, Delli Pizzi D, Augurio A, et al. Volume delineation in cervical cancer with T2 and diffusion-weighted MRI: agreement on volumes between observers. In Vivo. 2020;34(4):1981–1986.
- Choudhury A, Theophanous S, Lønne PI, et al. Predicting outcomes in anal cancer patients using multi-centre data and distributed learning – a proof-of-concept study. Radiother Oncol. 2021;159:183–189.
- Karimi D, Warfield SK, Gholipour A. Critical Assessment of Transfer Learning for Medical Image Segmentation with Fully Convolutional Neural Networks. arXiv:2006.00356v1 [Preprint]. 2020. [cited 2021 June 9]: [11 p.]. Available from: https://arxiv.org/abs/2006.00356v1
- Zhu S, Dai Z, Wen N. Two-Stage approach for segmenting gross tumor volume in head and neck cancer with CT and PET imaging. In: Andrearczyk V, Oreiller V, Depeursinge A, editors. Head and neck tumor segmentation. First Challenge, HECKTOR 2020, Held in Conjunction with MICCAI 2020, Lima, Peru, October 4, 2020, Proceedings. Cham: Springer; 2021. p. 22–27.
- Chen L, Shen C, Zhou Z, et al. Automatic PET cervical tumor segmentation by combining deep learning and anatomic prior. Phys Med Biol. 2019;64(8):085019.
- Wang J, Lu J, Qin G, et al. Technical note: a deep learning-based autosegmentation of rectal tumors in MR images. Med Phys. 2018;45(6):2560–2564.
- Wang M, Xie P, Ran Z, et al. Full convolutional network based multiple side-output fusion architecture for the segmentation of rectal tumors in magnetic resonance images: a multi-vendor study. Med Phys. 2019;46(6):2659–2668.
- Kim J, Oh JE, Lee J, et al. Rectal cancer: toward fully automatic discrimination of T2 and T3 rectal cancers using deep convolutional neural network. Int J Imaging Syst Technol. 2019;29(3):247–259.
- Soomro MH, Coppotelli M, Conforto S, et al. Automated segmentation of colorectal tumor in 3D MRI using 3D multiscale densely connected convolutional neural network. J Healthc Eng. 2019;2019:1075434.
- Bnouni N, Islem R, Rhim MS, et al. Dynamic multi-scale CNN Forest learning for automatic cervical cancer segmentation. In: Shi Y, Suk HI, Liu M, editors. Machine learning in medical imaging. MLMI 2018. Granada: Springer; 2018. p. 19–27.
- Trebeschi S, van Griethuysen JJM, Lambregts DMJ, et al. Deep learning for fully-automated localization and segmentation of rectal cancer on multiparametric MR. Sci Rep. 2017;7(1):5301.
- Liu Z, Liu X, Xiao B, et al. Segmentation of organs-at-risk in cervical cancer CT images with a convolutional neural network. Phys Med. 2020;69:184–191.
- Prezzi D, Mandegaran R, Gourtsoyianni S, et al. The impact of MRI sequence on tumour staging and gross tumour volume delineation in squamous cell carcinoma of the anal canal. Eur Radiol. 2018;28(4):1512–1519.
- Min LA, Vacher YJL, Dewit L, et al. Gross tumour volume delineation in anal cancer on T2-weighted and diffusion-weighted MRI – reproducibility between radiologists and radiation oncologists and impact of reader experience level and DWI image quality. Radiother Oncol. 2020;150:81–88.