
Abstract
Background
Acute myeloid leukemia (AML) is characterized by blocked or aberrant differentiation of hematopoietic stem cells. The MECOM gene overexpression in hematopoietic progenitors induces myeloid differentiation block, resulting in increased self-renewal and survival of these transformed progenitors. However, its exact role in AML remains unclear. We aimed to estimate the prevalence of MECOM overexpression among pediatric AML patients, and assess its impact on clinical outcome.
Patients and Methods
Real-time quantitative polymerase chain reaction and Livak method (2ΔΔCt) were used to determine relative MECOM expression level among 243 pediatric patients with AML. MECOM overexpression was considered if the cumulative relative expression was above 1 (2-ΔΔCt) and was designated as MECOMpos.
Results
Of 243 AML patients tested 57(23.5%) demonstrated MECOMpos. Patients with MECOMpos had significantly lower median age. The frequency of MECOMpos was significantly higher among AML patients with 11q23 abnormalities, complex karyotypes and among high- and intermediate-risk groups compared to low-risk group (p = .014). MECOMpos patients had significantly lower overall survival (OS) (38.7 vs. 78.9%, p < .001), event-free survival (EFS) (37.3% vs. 68.4%, p < .001), and had higher cumulative incidence of relapse (49.5% vs. 23.5%, p = .002) at 36 months compared to MECOMneg patients. Multivariate analysis revealed that MECOMpos was an adverse prognostic factor for OS (hazards ratio (HR) = 2.11, 95% confidence interval (CI) 1.24–3.60, p = .006) and EFS (HR= 1.71, 95% CI 1.07–2.75, p = .025). The logistic regression model showed that MECOMpos was an independent prognostic factor regardless of minimal residual disease status post first induction therapy in the intermediate-risk group (odds ratio 2.89; 95% CI 1.19–6.57, p = .018).
Conclusion
The aberrant MECOM gene expression is an adverse prognostic factor, especially in patients without previously known cytogenetic risk factors. Our results suggest the potential benefit from pretreatment screening for MECOM gene overexpression in newly diagnosed AML patients for better risk stratification and treatment adjustment.
Introduction
Acute myeloid leukemia (AML) is characterized by blocked or aberrant differentiation of hematopoietic stem cells. AML accounts for 20% of childhood leukemia with 5-year overall survival rate of 68% for children younger than 15 years [Citation1,Citation2], Overexpression of certain hematopoietic-associated genes is commonly found in AML and can define clinically relevant biological subsets that lack other previously identified prognostic markers [Citation3].
The MDS1 and EVI1 complex locus protein (MECOM) gene is located on chromosome 3q26 and encodes a zinc-finger protein that functions as a transcriptional regulator of hematopoietic stem cell self-renewal and long-term activity [Citation3]. The gene was first identified as a common site of viral integration in retrovirus-induced murine leukemia, suggesting its role in the transformation of hematopoietic cells [Citation4]. Overexpression of the MECOM gene in hematopoietic progenitors induces a myeloid differentiation block, resulting in increased self-renewal and survival of these transformed progenitors [Citation5].
MECOM gene overexpression reportedly occurs in approximately 8–15% of pediatric patients with AML and has been associated with an adverse prognosis in both adult and pediatric myeloproliferative neoplasms [Citation6–8]. Therefore, assessment of MECOM gene expression, in addition to other known molecular and cytogenetic abnormalities, could provide a wider biological landscape and further clinical information that will help in the application of a better risk stratified therapy, especially in patients with AML that lack other known genetic abnormalities [Citation9]. Previous studies of MECOM expression in pediatric AML from European cooperative groups and from the Children Oncology Group (COG) study AAML03P1 reported that its overexpression adversely impacted event-free survival (EFS) and overall survival (OS) in univariate analyses, but not in multivariate analyses [Citation8,Citation10].
The aim of the current study was to estimate the prevalence of MECOM gene overexpression in pediatric patients with AML at a single large pediatric oncology center treating children with the modified COG protocol (AAML-1031) and to assess the prognostic impact of MECOM gene overexpression on survival and disease outcome.
Patients and methods
This was a retrospective study that included 248 pediatric patients diagnosed with AML who have been treated at the Children’s Cancer Hospital Egypt (CCHE-57357) from January 2015 to October 2017, with a minimum one-year follow-up from the end of treatment. The institutional review board approved the study, and informed consent was obtained before diagnostic assessment or therapy was initiated.
Patients with acute promyelocytic leukemia (APML), Down syndrome myeloid neoplasm, myelodysplastic syndrome (MDS), therapy-related AML (t-AML), relapsed AML, and myeloid sarcoma were excluded. Patients who died before response assessment during induction I were also excluded from the analysis.
The following data were collected: age at presentation, initial total leukocyte count (TLC), French-American-British (FAB) classification, cytogenetics, and molecular abnormalities.
Patients were initially classified according to modified COG protocol AAML 1031 into:
Low Risk (LR): Favorable cytogenetics - (t8;21), inversion 16, nucleophosmin (NPM1), CEBPA
Intermediate Risk (IR): Neither favorable nor unfavorable criteria
High risk (HR): Unfavorable cytogenetics, monosomy 7, monosomy 5, complex karyotype (more than three chromosomal aberrations), FLT3 internal tandem duplications (FLT3/ITD) with high allelic ratio defined as > 0.4 (FLT3/ITD positive)
Using flow cytometry after induction I, patients in the IR group were further classified into HR and LR according to the minimal residual disease (MRD) response, with LR defined as MRD <0.1%.
Treatment protocols
Patients were registered onto the CCHE 57357 AML protocol adopted from the modified COG protocol AAML 1031. The details of the chemotherapy regimens and doses are provided in ‘Supplementary Table 1.’
Definitions
Complete remission (CR) was defined as bone marrow (BM) blasts <5%. Refractory disease was defined as the persistence of BM blasts ≥5% at the end of induction II.
Allogenic hematopoietic stem cell transplantation (Allo-HSCT) from a matched sibling donor was offered to high-risk patients in complete remission 1 (CR1), refractory disease, and relapsing cases if they reached a second complete remission (CR2). Busulfan and cyclophosphamide were used as conditioning regimens.
Identification of MECOM expression using real-time quantitative PCR
Total RNA was extracted from the BM samples using the RNeasy Mini Kit (Qiagen, Germany).
Assessment for RNA quantity used Nanodrop 2000 (Thermoscientific, US), quality was tested by gel electrophoresis. A total of 1 µg of RNA was transcribed into cDNA using high-capacity reverse transcriptase (Life Technologies, Merelbeke, Belgium). Real-time quantitative PCR amplification was performed using QuantStudio 5 (Applied Biosystems, Thermo Scientific) with 20 µL mix containing: 12.5 µL TaqMan™ Universal Master Mix II, with UNG (Applied Biosystems Thermo Scientific), 7.5 pmol of forward and reverse primers each (Eurofins Genomics), 10 nM dual-labeled probe HPLC grade (Eurofins Genomics), labeled at the 5′ end with the reporter dye molecule FAM (6-carboxy-fluorescein) and at the 3′ end with the quencher dye molecule TAMRA (6-carboxy-tetramethylrhodamine; Eurofins Genomics) for EVI1, EVI1/MDS, and ABL genes), and 50 ng of cDNA. The thermal cycling conditions included 10 min at 95 °C, followed by 40 cycles of denaturation for 15 s at 95 °C and annealing/extension at 60 °C for 60 s. To determine the expression levels in AML, all samples were tested in duplicates and the average values were used for quantification, and all the results were subjected to the Livak method for relative gene expression determination [Citation11]. In addition to 15 healthy BM samples, the relative expression of EVI1 and EVI/MDS transcripts was calculated using the comparative cycle time (ΔCt) method, with the ABL gene as the housekeeping gene. We used the ΔΔCt value to calculate the cumulative relative expression (2-ΔΔCt). The sample was considered to have MECOM overexpression if the cumulative relative expression was above 1 [Citation12]. MECOM overexpression was designated as MECOMpos, with the remainder of the samples designated as MECOMneg . Five samples had low RNA concentrations after extraction and were therefore excluded. The analysis cohort comprised 243 patients.
The oligonucleotide sequences of the primers and probes used for EVI1, EVI1/MDS, and ABL are shown in ‘Supplementary Table 2.’
Statistical analysis
The characteristics of patients who were MECOMpos and MECOMneg were compared using the chi-square test with Bonferroni multiple hypothesis P-value adjustment. Logistic regression was performed to evaluate the impact of MECOM gene overexpression and MRD on relapse in the IR group. Overall and event-free survival probabilities were calculated using Kaplan-Meier analysis, and comparisons between patients who were MECOMpos and MECOMneg were performed using the log-rank test. OS was defined as the duration from the date of registration to the date of death or last contact date. EFS was defined as the duration from the registration date until the event date where the event was either relapse, refractory (induction failure), or death. The effects of different risk factors on death and events were tested using univariate Cox regression, and the statistically significant variables were reevaluated using a multivariate Cox regression model. The cumulative incidence of relapse (CIR) was estimated for MECOMpos and MECOMneg groups and compared using the Gray test.
Results
Prevalence of MECOM gene overexpression among pediatric patients with AML
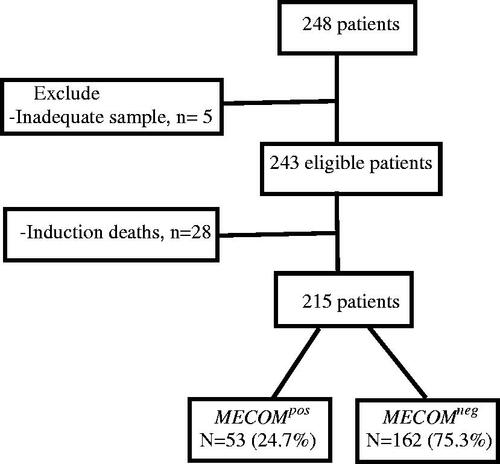
Of the 215 eligible patients, 53 (24.7%) had MECOM overexpression ().
Figure 1. Prevalence of MECOM overexpression gene among pediatric patients with AML.
Patient characteristics and patterns of MECOM gene overexpression
As shown in , the median age for the entire cohort was 7 years (range, 0.2–17.9 years). Patients who were MECOMpos had a lower median age (range, 0.2–16.3 years) at diagnosis than those who were MECOMneg (range, 0.4–17.9 years) (66% of MECOMpos <7 vs. 44% of MECOMneg <7 years; p = .042).
Table 1. Distribution of MECOM gene overexpression depending on patient’s characteristics with multiple hypothesis adjustment.
Regarding FAB classification, M7 was frequently encountered with MECOM overexpression (15/53, 28.3% vs. 7/162, 4.3%; p = .014). The rate of mixed lineage leukemia (MLL) gene rearrangement was significantly higher in patients who were MECOMpos (12/53, 22.6%) versus those who were MECOMneg (10/162, 6%) (p = .014), as well as those with complex karyotypes (10/53 18.8% vs. 4/162 2%, p = .014 in MECOMpos vs. MECOMneg, respectively). No significant association was found among monosomy 7, trisomy 8, trisomy 21, or FLT3/ITD and MECOM overexpression.
Using the COG risk classification, patients with MECOM overexpression were more often in the IR (35/53 66% vs. to 78/162 48%) and HR groups (16/53 30% vs. 20/162 12%) (p = .014). Only two patients with MECOM overexpression were classified as LR.
MECOM gene overexpression and survival
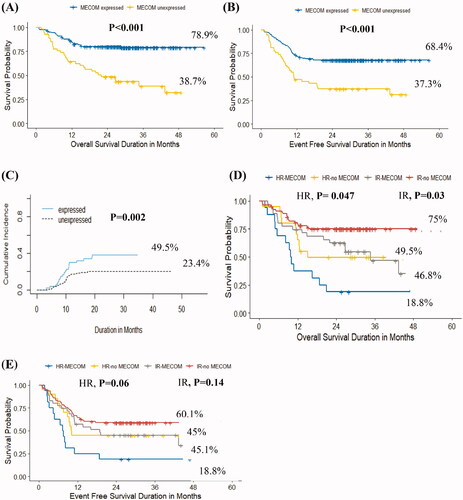
Patients with MECOM gene overexpression had significantly lower 3-year OS (38.7% vs. 78.9%, p < .001) and EFS (37.3% vs. 68.4%, p < .001), and significantly higher cumulative incidence of relapse (49.5% vs. 23.5%, p = .002) than patients who were MECOMneg ( respectively, Supplementary Tables 3(A–C)).
Figure 2. Impact of MECOM gene overexpression on survival. (A) Kaplan–Meier curves of overall survival of patients with MECOMpos vs MECOMneg among the whole cohort, (B) Kaplan–Meier curves of event-free survival of patients with with MECOMpos vs MECOMneg among the whole cohort, (C) Cumulative incidence of relapse among patients with MECOMpos vs MECOMneg among the whole cohort, (D) Kaplan–Meier curves of overall survival of patients with MECOMpos vs MECOMneg within disease risk group, (E) Kaplan–Meier curves of event-free survival of patients with MECOMpos vs MECOMneg within disease risk group.
As expected, in the entire cohort, patients in the HR group had lower OS and EFS (35.4% and 33.3%, respectively) than patients in the IR and LR groups (OS 64.4% and 91.9%, respectively; EFS 55.4% and 84.8%, respectively) (p < .001) (Supplementary Figures 1(A,B)).
MECOM gene overexpression influences overall survival in high risk and intermediate risk groups
Within the risk groups, MECOMpos conferred a negative impact on OS (HR: 18.8% vs. 49.5%, p = .047; IR: 46.8% vs. 75%, p = .03). However, the differences in EFS among the groups were not statistically significant (, Supplementary Table 4).
Univariate and multivariate cox regression analyses
MECOM gene overexpression, MLL gene-r, complex karyotype, and initial disease risk were significant predictors of survival rates in the univariate analysis (). However, only two factors were associated with lower OS and EFS in the multivariate analysis: MECOM gene overexpression for OS (hazard ratio (HR) = 2.11, 95% confidence interval [CI], 1.24–3.60, p = .006) and for EFS (HR = 1.71, 95% CI 1.07–2.75, p = .025), and initial risk stratification for OS (p < .001) and EFS (p < .001) ().
Table 2. Cox regression for univariate and multivariate analyses of MECOM overexpression, FAB, MLL-r, complex karyotype, and initial risk.
MECOM gene overexpression as a poor prognostic factor in the intermediate risk group regardless of minimal residual disease response
In the current study, MECOM gene overexpression did not affect the MRD response after induction I in the IR group (Supplementary Table 5). However, 19 out of 57 patients had no identifiable marker to follow post-induction I; thus, MRD could not be assessed, and according to the modified COG protocol AAML1031, these patients were considered MRD-negative ().
Figure 3. MECOM overexpression among patients in the intermediate risk group.
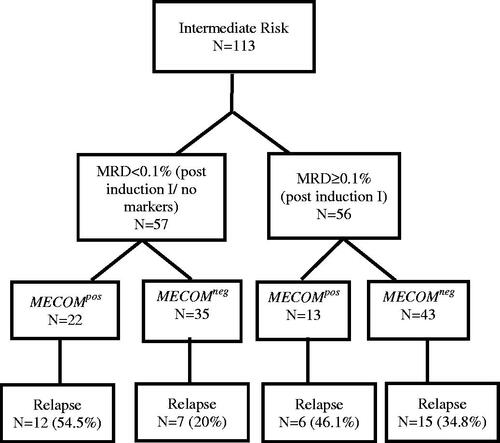
We analyzed the impact of MECOM gene overexpression and MRD on relapse using a logistic regression model in the IR group. MECOMpos had a significant impact on relapse regardless of MRD status post induction I (odds ratio 2.79, 95% CI 1.19–6.56, p = .018) (Supplementary Table 6).
MECOM gene overexpression in patients transplanted to the HR group
Twenty-nine patients underwent Allo-HSCT, 9 of whom were MECOMpos (4 in CR1 and 5 in CR2), while the remaining 20 were MECOMneg (13 in CR1 and 7 in CR2). Seven patients relapsed after Allo- HSCT (three of whom were MECOMpos and four MECOMneg). Due to the small sample size, definitive conclusions regarding the impact of MECOM gene overexpression on relapse after Allo- HSCT could not be made.
Discussion
Risk stratification in AML continues to evolve as new information emerges about both the role of biological factors identified at diagnosis and the response to up-front therapy. The ELN guidelines, updated in 2017, classify patients into ‘favorable,’ ‘intermediate,’ and ‘adverse’ groups based on cytogenetics and molecular mutations [Citation13]. Research on molecular testing has attempted to further refine the prognosis of intermediate cases by identifying new mutations to explain the heterogeneity of outcomes in this group [Citation14].
When fused with MDS1, the ecotropic viral integration site 1 (EVI1) creates MECOM, a unique protein that acts as a proto-oncogene controlling transcription in early hematopoietic development. Aberrant EVI1 expression has been reported in 8–10% of adult AML cases and up to 27% of pediatric mixed-lineage leukemia (MLL). The prevalence of MECOM gene overexpression in childhood AML reportedly ranges from 9% to 28%, which was similar to our results (23.5%) [Citation8,Citation10]. We found that MECOM gene overexpression was strongly associated with the FAB M7 morphologic subtype of AML (28.3% of MECOMpos cases were M7), similar to what was found in some previous pediatric studies [Citation10,Citation15]. This result contrasts with that of other pediatric studies where MECOM gene expression is associated with FAB M4 and M5 [Citation16].
Cytogenetic aberrations in relation to MECOM overexpression have also been observed. MLL gene rearrangements on 11q23 were found in 15–20% of de novo pediatric AML cases. Several studies have shown a high incidence of MECOM expression and MLL-r, ranging from 28% to 40% [Citation8,Citation10,Citation17]. In the current study, over half of MLL rearranged cases were MECOMpos, and the complex karyotype where almost three-quarters of patients had MECOM gene overexpression.
Monosomy 7 is a common cytogenetic abnormality frequently found in myeloid malignancies, and its association with MECOM overexpression has been reported in adult and pediatric AML, which may be explained by the presence of MECOM on 3q26, a region commonly involved in rearrangements in monosomy 7 [Citation8,Citation10,Citation18]. In our study, although small numbers precluded a detailed analysis, five out of eight patients with monosomy 7 were MECOMpos.
Importantly, this study found that patients with MECOMpos had significantly lower OS and EFS than those who were MECOMneg, mostly due to a higher cumulative incidence of relapse among patients who were MECOMpos. Ho et al. reported that high EVI1 gene expression adversely influenced OS (51 ± 14% vs. 68 ± 8%, p = .015) and EFS (40 ± 13% vs. 52 ± 8%, p = .042) [Citation10]. While Balgobind showed that patients with MECOM gene overexpression had significantly worse EFS (28% vs. 44%, p = .04), this did not extend to OS (56% vs. 64%, p = .34), as confirmed by multivariate analysis, including favorable karyotype, age, and WBC count [Citation8].
Many factors contribute to AML outcomes and survival, including initial risk stratification and response assessment after induction therapy by flow cytometry. In our cohort, high MECOM gene expression remained a significant predictor of inferior survival after adjustment for other variables, including initial risk stratification.
We also found that the majority of patients with MECOM overexpression were classified as IR (35/53 patients), whereas only two patients were considered as LR. Ho et al. reported similar results, wherein 81% of patients with EVI1 belonged to the intermediate-risk group, lacking other cytogenetic or molecular prognostic markers, whereas patients in the favorable-risk group accounted for only 4% of the patients with EVI1 [Citation10].
One of the main goals of this study was to identify a subgroup of patients within the IR group with an increased risk of relapse and poor outcomes, thus setting the stage for different approaches to upfront therapy for this group. We noticed that MECOM gene overexpression adversely affected the survival in patients from the IR group, resulting in outcomes similar to those in the HR group (OS: 46.8% vs. 49.5%, EFS 45.1% vs. 45%). Within the limits of our ability to identify markers for MRD, MECOMpos remained an independent predictor of poor outcome regardless of MRD status post-induction I. Among the HR group, patients with MECOM overexpression had significantly worse OS (18.8% vs. 49.5%, p = .047) and EFS (18% vs. 45%, p = .06%) than those without MECOM expression.
Conclusion
Despite advances in the treatment of AML, relapse remains a major problem. While some children can be risk-stratified based on cytogenetic or molecular findings, a large percentage of children lacks these markers and are thus categorized into the IR group. Our study shows that MECOM overexpression is an adverse prognostic marker in pediatric patients with AML and can identify patients in the IR group that have a poorer prognosis. More studies are still needed to prove the need of more intensified treatment for this group of patients including Allo-HSCT in CR1.Opportunities for targeted therapy also exist; in 2011, Saito showed that overexpression of MECOM gene was linked to aberrant overexpression of CD52, a target of the monoclonal antibody alemtuzumab, and a study by De Weer showed the MIR4494 was a crucial target of EVI1 involved in the pathogenesis of leukemia. Another study by Heller et al found 56 unique genes responsive to EVI1 in the human myeloid cell line U937T using gene expression microarray analysis in which 27 genes were up-regulated, and 29 genes down-regulated. The most strongly (∼16-fold) repressed gene was MS4A3. In additional support of the regulatory relationship between EVI1 and MS4A3, analysis of gene expression omnibus (GEO) microarray data sets GSE35159, GSE6891, GSE14471, and GSE35784 revealed that human myeloid cell lines and primary AML patient samples with high EVI1 mRNA levels exhibited low expression of MS4A3 and vice versa [Citation19–21]. Our results suggest screening for MECOM gene overexpression in pediatric patients newly diagnosed with AML may be of use and serve as a potential prognostic variable for risk stratification and treatment adjustment.
Institutional review board statement
This Study was approved by the Scientific Advisory Committee (SMAC) and the institutional review board (IRB) approved the study, informed consent was obtained before diagnostic assessment or therapy was initiated.
Supplemental Material
Download MS Word (1.6 MB)Disclosure statement
The authors declare no conflict of interest.
Additional information
Funding
References
- Ferrara F, Palmieri S, Leoni F. Clinically useful prognostic factors in acute myeloid leukemia. Crit Rev Oncol Hematol. 2008; 66(3):181–193.
- Smith MA, Altekruse SF, Adamson PC, et al. Declining childhood and adolescent cancer mortality. Cancer. 2014;120(16):2497–2506.
- Martinelli G, Ottaviani E, Buonamici S, et al. Association of 3q21q26 syndrome with different RPN1/EVI1 fusion transcripts. Haematologica. 2003;88(11):1221–1228.
- Kataoka K, Sato T, Yoshimi A, et al. Evi1 is essential for hematopoietic stem cell self-renewal, and its expression marks hematopoietic cells with long-term multilineage repopulating activity. J Exp Med. 2011;208(12):2403–2416.
- Morishita K, Parker DS, Mucenski ML, et al. Retroviral activation of a novel gene encoding a zinc finger protein in IL-3-dependent myeloid leukemia cell lines. Cell. 1988;54(6):831–840.
- Laricchia-Robbio L, Nucifora G. Significant increase of self-renewal in hematopoietic cells after forced expression of EVI1. Blood Cells Mol Dis. 2008;40(2):141–147.
- Haas K, Kundi M, Sperr WR, et al. Expression and prognostic significance of different mRNA 5'-end variants of the oncogene EVI1 in 266 patients with de novo AML: EVI1 and MDS1/EVI1 overexpression both predict short remission duration . Genes Chromosomes Cancer. 2008;47(4):288–298.
- Balgobind BV, Lugthart S, Hollink IH, et al. EVI1 overexpression in distinct subtypes of pediatric acute myeloid leukemia. Leukemia. 2010;24(5):942–949.
- Roberto R, Capela DM, Moneeb AK, et al. Molecular approaches identify a cryptic MECOM rearrangement in a child with a rapidly progressive myeloid neoplasm. Cancer Genetics. 2018;221:25–30.
- Ho PA, Alonzo TA, Gerbing RB, et al. High EVI1 expression is associated with MLL rearrangements and predicts decreased survival in paediatric acute myeloid leukaemia: a report from the children’s oncology group. Br J Haematol. 2013; 162(5):670–677.
- Livak KJ, Schmittgen TD. Analysis of relative gene expression data using Real-Time quantitative PCR and the 2−ΔΔCT method. Methods. 2001;25(4):402–408.
- Rao X, Huang X, Zhou Z. An improvement of the 2^(–delta delta CT) method for quantitative real-time polymerase chain reaction data analysis. Biostat Bioinforma Biomath. 2013;3(3):71–85.
- Döhner H, Estey E, Grimwade D, et al. Diagnosis and management of AML in adults: 2017 ELN recommendations from an international expert panel. Blood. 2017;129(4):424–447.
- Yohe S. Molecular genetic markers in acute myeloid leukemia. J Clin Med. 2015;4(3):460–478.
- Jo A, Mitani S, Shiba N, et al. High expression of EVI1 and MEL1 is a compelling poor prog. nostic marker of pediatric AML. Leukemia. 2015;29(5):1076–1083.
- Matsuo H, Kajihara M, Tomizawa D, et al. EVI1 overexpression is a poor prognostic factor in pediatric patients with mixed lineage leukemia-AF9 rearranged acute myeloid leukemia . Haematologica. 2014;99(11):e225–e227.
- Sadeghian MH, Rezaei Dezaki Z. Prognostic value of EVI1 expression in pediatric acute myeloid leukemia: a systematic review. Iran J Pathol. 2018; 12(3):294–300.
- Groschel S, Lugthart S, Schlenk RF, et al. HighEVI1 expression predicts outcome in younger adult patients with acute myeloid leukemia and is associated with distinct cytogenetic abnormalities. J Clin Oncol. 2010;28(12):2101–2107.
- Saito Y, Nakahata S, Yamakawa N, et al. CD52 as a molecular target for immunotherapy to treat acute myeloid leukemia with high EVI1 expression. Leukemia. 2011;25(6):921–931.
- Weer AD, Van der Meulen J, Rondou P, et al. EVI1-mediated down regulation of MIR449A is essential for the survival of EVI1 positive leukaemic cells. Br J Haematol. 2011;154(3):337–348.
- Heller G, Rommer A, Steinleitner K, et al. EVI1 promotes tumor growth via transcriptional repression of MS4A3. J Hematol Oncol. 2015;8:28.