
Abstract
Background
Obesity seems to be associated with a poorer response to adjuvant chemotherapy in breast cancer (BC); however, associations in the neoadjuvant chemotherapy (NACT) setting and according to menopausal status are less studied. This study aims to investigate the association between pretreatment body mass index (BMI) and pathological complete response (pCR) following NACT in BC according to menopausal and estrogen receptor (ER) status.
Material and Methods
The study cohort consisted of 491 patients receiving NACT in 2005–2019. Based on pre-NACT patient and tumor characteristics, the association between BMI and achieving pCR was analyzed using logistic regression models (crude and adjusted models (age, tumor size, and node status)) with stratification by menopausal and ER status.
Results
In the overall cohort, being overweight (BMI ≥25) compared by being normal-weight (BMI <25), increased the odds of accomplishing pCR by 15%. However, based on the 95% confidence interval (CI) the data were compatible with associations within the range of a decrease of 30% to an increase of 89%. Stratification according to menopausal status also showed no strong association: the odds ratio (OR) of accomplishing pCR in overweight premenopausal patients compared with normal-weight premenopausal patients was 1.76 (95% CI 0.88–3.55), whereas for postmenopausal patients the corresponding OR was 0.71 (95% CI 0.35–1.46).
Discussion
In a NACT BC cohort of 491 patients, we found no evidence of high BMI as a predictive factor of accomplishing pCR, neither in the whole cohort nor stratified by menopausal status. Given the limited precision in our results, larger studies are needed before considering BMI in clinical decision-making regarding NACT or not.
Background
The global obesity rates have nearly tripled since 1975 and globally more than one-third of the adult population is considered overweight (body mass index (BMI) ≥ 25 kg/m2) and 13% obese (BMI ≥ 30 kg/m2) [Citation1]. High BMI may increase the risk of cancer development as well as worsen the prognosis in several cancer types, including postmenopausal breast cancer (BC) [Citation2,Citation3]. The incidence of BC in postmenopausal women with high BMI is elevated, which might be related to increased plasma levels of estradiol from adipose tissue. Estradiol synthesis in adipose tissue increases with age and obesity due to increased expression of aromatase [Citation4]. Obesity is also often associated with adverse tumor characteristics including higher rates of hormone receptor-negative and triple-negative BC tumors [Citation5,Citation6]. Obesity in patients with BC has been associated with advanced stage at diagnosis and worse recurrence-free survival and overall survival rates [Citation7,Citation8].
Neoadjuvant chemotherapy (NACT) was initially used to reduce local tumor burden and, thereby, enable less radical surgery while still achieving local tumor control [Citation9]. NACT is now a well-established therapy to increase the rate of breast-conserving surgery for patients with BC with locally advanced tumors that required extended resection or were inoperable at the time of diagnosis [Citation10] and elicits an opportunity to monitor the tumor response in vivo, thus allowing treatment alterations in non-responders, while also providing a prediction of prognosis [Citation11–13]. In addition, the concept of salvage adjuvant therapy has also been added to the list of NACT benefits [Citation14–16]. The desired outcome of NACT is a pathological complete response (pCR), an established independent predictive factor for BC survival and improved long-term prognosis [Citation17,Citation18]. Overweight have been linked to lower rates of pCR in patients with BC compared with under-/normal-weight patients [Citation19]. Recent studies confirm the negative association between overweight and obtaining pCR [Citation19], but a possible different association depending on menopausal status and tumor characteristics is less studied [Citation20]. Therefore, in this study, we aim to investigate the association between BMI and pCR in relation to menopausal status and estrogen receptor (ER) status in patients with BC. Our pre-study hypothesis was that the association between high BMI and low pCR rate following NACT would be most prominent in the subgroup of overweight postmenopausal patients with ER-positive tumors.
Material and methods
Cohort
A total of 495 patients receiving NACT for BC were included in this study. For this study, two cohorts of patients receiving NACT for BC at Skåne University Hospital, Sweden were merged: a retrospective, consecutive cohort (N = 302) consisting of patients receiving NACT treatment during 2005–2016 [Citation21] and a prospective study cohort (N = 200) consisting of patients receiving NACT during 2014–2019 [Citation22]. A total of seven patients were in both cohorts and, hence, were excluded from the retrospective cohort (). A flow chart has previously been published along with details of the two cohorts [Citation23] and are here briefly described.
Figure 1. Flow chart.
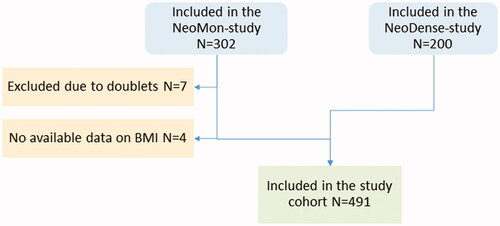
The inclusion criteria were female patients treated with NACT undergoing the intended breast surgery. Medical charts and study-specific patient questionnaires (filled out upon diagnosis) were reviewed and data on patients’ characteristics were retrieved. For the analyses in this study, when menopausal status was unknown, the patient was considered postmenopausal if > 55 years old and otherwise premenopausal. Patients received oncological treatment according to prevailing Swedish clinical guidelines: the standard NACT contained a three series of fluorouracil, epirubicin, and cyclophosphamide or epirubicin and cyclophosphamide followed by three series of taxanes (docetaxel or paclitaxel) and, in the case of human epidermal growth factor receptor 2 (HER2)-overexpressing tumors, a HER2-blockade (trastuzumab/pertuzumab). Further details on the cohort are available in the literature [Citation23].
Overweight and obesity was defined as BMI ≥ 25 and BMI ≥ 30, respectively, according to the WHO guidelines [Citation1]. For the N = 291 from the retrospective cohort, baseline BMI was abstracted from medical charts, whereas for the N = 200 patients in the prospective cohort, baseline BMI was prospectively collected from self-reported study-specific forms.
Baseline tumor pathology data from breast core biopsies along with pathology data from surgical specimens were retrieved from clinical pathology reports. Tumor ER positivity was defined accordingly: staining positive in >10% of the tumor cells with immunohistochemistry, and HER2 status was defined as either 3+ with immunohistochemistry and/or amplified with fluorescence in situ hybridization. Tumor proliferation (Ki67) was reported as a percentage, depending on the proportion of the tumor cells that stained positive. A Ki67 value >20% was considered highly proliferative and otherwise lowly proliferative. pCR was defined as no remaining invasive cancer in the resected breast specimen and all sampled regional lymph nodes following the completion of NACT.
Statistical analyses
We summarized baseline patient characteristics for the cohort by both BMI and pCR. Categorical variables were summarized as counts and percentages, and continuous variables as medians and interquartile ranges (IQRs). In order to steer away from significance testing, we only present point estimates and IQR/95% confidence intervals (CI) and purposely abstained from presenting p values [Citation24]. Later, we estimated the association between BMI (BMI <25 vs. BMI ≥25) and pCR by using logistic regression models with the expression of odds ratios (ORs). Crude and multivariable-adjusted models were used, including all cases and complete cases, respectively. Adjustments were made for age at baseline (years), logarithmically transformed (ln) tumor size (mm, mammography) and node status (yes/no). The linearity between continuous variables (age and tumor size) and their respective log odds was assessed through visual assessment of scatter plots (y axis with the log-odds, x axis the continuous variable in categories). The variable age did not violate the assumption of linearity, whereas for tumor size the logarithmically transformed variable was used in order to fulfill the assumption of linearity. We present models of the association for both the whole cohort and subgroups defined by menopausal and ER status. Post hoc analysis of the association between obesity (BMI <30 vs. BMI ≥30) and pCR was performed. Likewise, a post hoc analysis of the association between BMI as a continuous variable and pCR was performed and a analysis of the association between overweight (BMI <25 vs. BMI ≥25) and pCR stratified according to St Gallen subtype. All analyses were carried out using IBM SPSS Statistics for Windows, version 26 (IBM Corp., Armonk, NY, USA).
Results
Descriptive results
The patient and tumor characteristics of the 491 patients included in this study are presented according to menopausal status and body constitution (). There was an equal distribution of pre- and postmenopausal patients in the study cohort, N = 268 (55%) and N = 223 (45%), respectively. The mean BMI was 26 kg/m2 (95% CI 20–34 kg/m2) and the median BMI was 25 kg/m2 (range 16–51 kg/m2). A total of 277 (56%) and 94 (19%) patients were considered overweight and obese, respectively. The proportion of overweight patients was lower among premenopausal patients in comparison to postmenopausal patients (53% vs. 60%). No difference in pre-NACT tumor size was seen according to BMI or menopausal status. Premenopausal patients had a larger proportion of ER-positive tumors compared with postmenopausal patients (63% vs. 57%). The normal-weight premenopausal patients had the highest rate of ER-positive tumors in the study population (68%) compared with the total cohort. The progesterone receptor-status followed ER status to a high degree. Premenopausal patients had a lower rate of HER2-overexpressing tumors compared with postmenopausal patients (25% vs. 33%), most pronounced among normal-weight postmenopausal patients (40%). Premenopausal patients had a higher rate of highly proliferative tumors (Ki67 > 20%) relative to postmenopausal patients (81% vs. 74%). Overweight postmenopausal patients had the highest rate of lymph node metastases at baseline (73%) compared with the total cohort (68%).
Table 1. Patients and tumor characteristics at baseline according to menopausal status and body constitution (N = 491).
Prediction model: the association between BMI and pCR
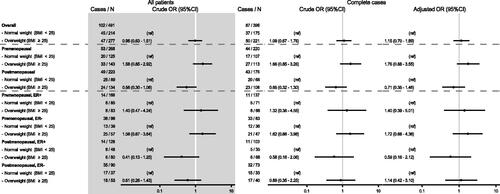
A total of 396 patients had complete study data and were included in the logistic regression models () addressing the association between overweight (BMI ≥ 25) and pCR following NACT in two different models (crude and an adjusted model). In the overall cohort, we found that between being overweight (BMI ≥ 25) compared by being normal-weight (BMI < 25), increased the odds of accomplishing pCR by 15%. However, the estimate was wide and based on the 95% confidence interval (CI) the data were compatible with associations within the range of a decrease of 30% to an increase of 89% (adjusted model OR 1.15 (95% CI 0.70–1.89)) (). By stratification according to menopausal status, no precise associations were measured: the OR of accomplishing pCR in overweight premenopausal patients compared with normal-weight premenopausal patients was 1.76 (95% CI 0.88–3.55), whereas for postmenopausal patients the corresponding OR was 0.71 (95% CI 0.35–1.46). Further subgroup analyses based on ER status showed a similar association as in the whole cohort (Supplementary Material 1) and in the pre- and postmenopausal subgroups (). Post hoc analysis of the association between obesity and pCR (BMI ≥ 30 vs. BMI <30) showed imprecise estimates (Supplementary Material 2a). Moreover, we found only imprecise estimates for the association between BMI as a continuous variable and pCR following NACT (Supplementary Material 2b) or between overweight (BMI < 25 vs. BMI ≥ 25) and pCR in any of the surrogate St Gallen subtypes (including separating HER2-positive, ER-positive from HER2-positive, ER-negative) (Supplementary Material 3c).
Figure 2. Forest plot: Associations between BMI at baseline and pCR following NACT- stratification according to menopausal status and ER status.
Discussion
In this study, we investigated the association between being overweight and the prospect of accomplishing pCR. We found no strong evidence of high BMI (overweight or obesity) being a predictive factor for accomplishing pCR following NACT in neither the whole cohort, nor stratified according to menopausal status. While ER negative status per se was associated with the prospect of accomplishing pCR (data not shown), our results indicate that the association between normal/high BMI and pCR did not differ within neither the ER-positive nor the ER-negative strata.
To the best of the authors’ knowledge, this is the largest study presenting data stratified according to menopausal status. Although our results are not well-supported by strong statistical data, we believe our rational is helpful for future analysis and our data adds a small piece to understanding the association between obesity and BC. Taking into account the imprecise data from the St Gallen subgroup analysis, our results are at this point merely descriptive, and no firm conclusion can be drawn. We encourage future inclusion of our results in meta-analyses to approach the question at issue.
Comparison to other studies
A study by Chen et al. (N = 307) [Citation20] showed a significantly lower pCR rate in overweight postmenopausal patients, while no association was found in premenopausal patients. To address the association between BMI and pCR, some studies have adjusted for menopausal status in logistic regression models (Litton et al. [Citation25], N = 1169; Karatas et al. [Citation26], N = 295, and Erbes et al. [Citation27], N = 324); however, an association dependent on menopausal status is not further discussed. Still, some studies on survival after NACT have adjusted for, but not stratified according to, menopausal status (Kogawa et al. [Citation28], N = 1,002, Arce-Salinas et al. [Citation29], N = 819). Our approach to stratify by menopausal and ER status, and subsequently adjust the different strata for biologically relevant variables, resulted in in-depth data and an easily accessible way to ‘see’ the associations [Citation30]. The aforementioned recent meta-analysis [Citation19] in which many of the recently referred studies were included, concluded that high BMI is associated with a lower pCR rate after NACT, while no conclusion was drawn for pre- and postmenopausal patients separately. In a thorough review by Trestini et al. [Citation31], the complex association between body weight, body composition and BC outcome is meritorious summarized, including the NACT setting.
Predictive markers of NACT
Tumor characteristics and immunohistochemical markers are important predictive markers, and the heterogeneous BC subtypes are differentially responsive to chemotherapy, including NACT [Citation32]. Triple negative and HER2-positive BC is considered most responsive to NACT [Citation32], whereas luminal BC is associated with lower pCR rates. High Ki67 expression increase the probability of pCR, most importantly in luminal BC [Citation33]. Immunological biomarkers, e.g., tumor-infiltrating lymphocytes [Citation34], tumor genetic profiles [Citation35], and possibly younger age [Citation36] are associated with higher pCR rates. The local microenvironment with soluble elements and differences in structure/stiffness, as well as systemic host characteristics, might also influence chemotherapy response, yet these properties are not routinely evaluated as biomarkers nor included in medical decision-making and treatment algorithms [Citation37,Citation38]. To offer patients with BC personalized treatments, more predictive biomarkers are needed.
Rationale for stratification
Menopausal status
The current understanding is that obesity is mainly associated with the risk of postmenopausal BC, whereas most studies report a null or inverse association of obesity with BC risk in premenopausal women [Citation39,Citation40]. While risk and prognostic/predictive factors are different entities, their underlying biological explanation might share common grounds. The mechanistic links between adiposity and BC, sex hormone metabolism, insulin IGF-signaling, adipokine pathobiology, and subclinical inflammation [Citation41] might also cause a less favorable response to NACT, as investigated in this study. The fostering and fueling factors underlying tumor initiation and growth might prohibit an adequate response to chemotherapy. For example, in the breasts of overweight women, the tumor microenvironment is influenced by a larger adipocyte population, causing different cytokine profiles, a hypoxic environment, and locally enhanced stiffness due to remodeling of the matrix [Citation42,Citation43]. In a recently published exploratory study (N = 62), both obesity and high tumor expression of the adipokine apelin were independently associated with lower pCR rates, indicating that specific adipokines are associated with NACT response [Citation44]. In overweight patients with BC, we hypothesize that the focally stiffer environment, in an otherwise mostly fatty breast, might mechanically hinder the transport of NACT’s active cytotoxic elements.
Estrogen receptor
Evidence suggests the association between obesity and postmenopausal BC is strongest for ER-positive BC [Citation45]. In addition, it is well known that ER-positive and ER-negative tumors respond differently to NACT [Citation32]. Our pre-study hypothesis was that the association between high BMI and low pCR rate following NACT would be most prominent in the subgroup of overweight postmenopausal patients with ER-positive tumors, and we, therefore, stratified according to both menopausal status and ER status. After considering the adjacent point estimates and overlapping CI from the logistic regression models, we found no such association. An exploratory analysis of the NeoALTTO-trial, based on a NACT-treated HER2-positive cohort, found no overall association between BMI and pCR, whereas, in the subgroup analysis of hormone receptor-positive tumors, overweight was associated with a decreased likelihood of achieving pCR [Citation46]. Also, our results do not contradict the results of a pooled analysis of eight prospective NACT trials presented by Fontanella et al. [Citation47] in 2015, reporting an association between BMI and pCR in luminal-like BC.
Strengths and weaknesses
We present results of a well-characterized merged NACT-BC cohort treated according to clinical routine. Inevitably, the merging of a prospective and a retrospective could lead to confounding, more specifically selection bias. The exclusion of not operated patients, potentially excluding non-responsive patients, may be a source of bias, possibly effecting the results. Estimates for subgroup analyses were associated with large CIs due to smaller groups, and further subgroup analysis according to the surrogate St. Gallen subtypes showed imprecise results in this study cohort. Since BMI is time-dependent, dynamic changes in BMI was explored by Kogawa et al. [Citation28]. In this study, the prevailing dichotomous endpoint pCR was used. However, several systems exist that consider also partial pathological response post-NACT, of which residual cancer burden (RCB) is the most commonly used [Citation48]. Obese patients may receive a reduced chemotherapy dose due to dose-capping. Unfortunately, we did not have access to data on dosing of chemotherapy. We purposedly abstained from using multiple imputation since we assume missing data completely at random, thus not introducing bias by using complete cases [Citation49]. Moreover, the data set is statistically considered too small to reliably build a multiple imputation model. In the cardiovascular society, the “obesity paradox”, referring to the implication that it could be healthier and prognostically protective to be overweight than to be normal-weight, is a well-known phenomenon [Citation50,Citation51]. The present BC cohort was not afflicted with many severe co-morbidities, and thus, we consider the obesity paradox to be of little influence.
Future perspectives
There is an urgent need to identify responders from non-responders in NACT treatment for BC. We believe that a wider approach that goes beyond classical staging and the immunohistochemical properties of the tumor, is important to identify more predictive markers or build predictive models for NACT treatment. However, in this study we found no solid evidence of our hypothesis of BMI as a predictive marker of NACT treatment for BC. Moreover, we suggest that the broader concept of biomarkers should also include host factors.
Conclusions
In a NACT BC cohort of 491 patients, we found no evidence of BMI as a predictive factor of accomplishing pCR, neither in the whole cohort nor stratified by menopausal status. Given the limited precision in our results, larger studies are needed before considering BMI in clinical decision-making.
Supplemental Material
Download MS Word (29.4 KB)Supplemental Material
Download MS Word (38.4 KB)Supplemental Material
Download PDF (289.4 KB)Acknowledgments
The authors express their gratitude to the study participants. They acknowledge the exceptional work performed by research nurse Lina Zander and the valuable statistical input from Dr. Uffe Heide-Jørgensen. Lastly, they thank all the personnel at Unilabs Malmö and Helsingborg for their cooperation.
Disclosure statement
SZ has received speakers’ fees and travel support from Siemens Healthcare AG, and consultancy fees from Collective Minds Radiology AB. The other authors declare they have no relevant competing interests.
Additional information
Funding
References
- WHO. Obesity and Overweight [cited 2021 Mar 18]. Available from: https://www.who.int/news-room/fact-sheets/detail/obesity-and-overweight
- Pfeiffer RM, Park Y, Kreimer AR, et al. Risk prediction for breast, endometrial, and ovarian cancer in white women aged 50 y or older: derivation and validation from population-based cohort studies. PLoS Med. 2013;10(7):e1001492.
- Picon-Ruiz M, Morata-Tarifa C, Valle-Goffin JJ, et al. Obesity and adverse breast cancer risk and outcome: Mechanistic insights and strategies for intervention. CA Cancer J Clin. 2017;67(5):378–397.
- Cleary MP, Grossmann ME. Minireview: Obesity and breast cancer: the estrogen connection. Endocrinology. 2009150(6):2537–2542.
- Yang XR, Chang-Claude J, Goode EL, et al. Associations of breast cancer risk factors with tumor subtypes: a pooled analysis from the breast cancer association consortium studies. J Natl Cancer Inst. 2011;103(3):250–263.
- Kwan ML, Kushi LH, Weltzien E, et al. Epidemiology of breast cancer subtypes in two prospective cohort studies of breast cancer survivors. Breast Cancer Res. 2009;11(3):R31.
- Warren LE, Ligibel JA, Chen YH, et al. Body mass index and locoregional recurrence in women with early-stage breast cancer. Ann Surg Oncol. 2016;23(12):3870–3879.
- Dawood S, Broglio K, Gonzalez-Angulo AM, et al. Prognostic value of body mass index in locally advanced breast cancer. Clin Cancer Res. 2008;14(6):1718–1725.
- Bonadonna G, Valagussa P, Brambilla C, et al. Primary chemotherapy in operable breast cancer: eight-year experience at the Milan cancer institute. J Clin Oncol. 1998;16(1):93–100.
- Senkus E, Kyriakides S, Ohno S, et al. Primary breast cancer: ESMO clinical practice guidelines for diagnosis, treatment and follow-up. Ann Oncol. 2015;26 Suppl 5:v8–v30.
- Untch M, Fasching PA, Konecny GE, et al. Pathologic complete response after neoadjuvant chemotherapy plus trastuzumab predicts favorable survival in human epidermal growth factor receptor 2-overexpressing breast cancer: results from the TECHNO trial of the AGO and GBG study groups. J Clin Oncol. 2011;29(25):3351–3357.
- von Minckwitz G, Blohmer JU, Costa SD, et al. Response-guided neoadjuvant chemotherapy for breast cancer. J Clin Oncol. 201331(29):3623–3630.
- von Minckwitz G, Untch M, Blohmer JU, et al. Definition and impact of pathologic complete response on prognosis after neoadjuvant chemotherapy in various intrinsic breast cancer subtypes. J Clin Oncol. 2012;30(15):1796–1804.
- von Minckwitz G, Huang CS, Mano MS, et al. Trastuzumab emtansine for residual invasive HER2-positive breast cancer. N Engl J Med. 2019;380(7):617–628.
- Masuda N, Lee SJ, Ohtani S, et al. Adjuvant capecitabine for breast cancer after preoperative chemotherapy. N Engl J Med. 2017;376(22):2147–2159.
- Denduluri N, Chavez-MacGregor M, Telli ML, et al. Selection of optimal adjuvant chemotherapy and targeted therapy for early breast cancer: ASCO clinical practice guideline focused update. J Clin Oncol. 2018;36(23):2433–2443.
- Kong X, Moran MS, Zhang N, et al. Meta-analysis confirms achieving pathological complete response after neoadjuvant chemotherapy predicts favourable prognosis for breast cancer patients. Eur J Cancer. 2011;47(14):2084–2090.
- Houssami N, Macaskill P, von Minckwitz G, et al. Meta-analysis of the association of breast cancer subtype and pathologic complete response to neoadjuvant chemotherapy. Eur J Cancer. 201248(18):3342–3354.
- Wang H, Zhang S, Yee D, et al. Impact of body mass index on pathological complete response following neoadjuvant chemotherapy in operable breast cancer: a Meta-analysis. Breast Cancer. 2021;28(3):618–629.
- Chen S, Chen CM, Zhou Y, et al. Obesity or overweight is associated with worse pathological response to neoadjuvant chemotherapy among Chinese women with breast cancer. PLoS One. 2012;7(7):e41380.
- Skarping I, Fornvik D, Sartor H, et al. Mammographic density is a potential predictive marker of pathological response after neoadjuvant chemotherapy in breast cancer. BMC Cancer. 2019;19(1):1272.
- Skarping I, Fornvik D, Heide-Jorgensen U, et al. Mammographic density changes during neoadjuvant breast cancer treatment: NeoDense, a prospective study in Sweden. Breast. 2020;53:33–41.
- Skarping I, Fornvik D, Heide-Jorgensen U, et al. Mammographic density as an image-based biomarker of therapy response in neoadjuvant-treated breast cancer patients. Cancer Causes Control. 2021;32(3):251–260.
- Greenland S, Senn SJ, Rothman KJ, et al. Statistical tests, P values, confidence intervals, and power: a guide to misinterpretations. Eur J Epidemiol. 2016;31(4):337–350.
- Litton JK, Gonzalez-Angulo AM, Warneke CL, et al. Relationship between obesity and pathologic response to neoadjuvant chemotherapy among women with operable breast cancer. J Clin Oncol. 2008;26(25):4072–4077.
- Karatas F, Erdem GU, Sahin S, et al. Obesity is an independent prognostic factor of decreased pathological complete response to neoadjuvant chemotherapy in breast cancer patients. Breast. 2017;32:237–244.
- Erbes T, Stickeler E, Rucker G, et al. BMI and pathologic complete response to neoadjuvant chemotherapy in breast cancer: a study and meta-analysis. Clin Breast Cancer. 2016;16(4):e119–e132.
- Kogawa T, Fouad TM, Wei C, et al. Association of body mass index changes during neoadjuvant chemotherapy with pathologic complete response and clinical outcomes in patients with locally advanced breast cancer. J Cancer. 2015;6(4):310–318.
- Arce-Salinas C, Aguilar-Ponce JL, Villarreal-Garza C, et al. Overweight and obesity as poor prognostic factors in locally advanced breast cancer patients. Breast Cancer Res Treat. 2014;146(1):183–188.
- Kahlert J, Gribsholt SB, Gammelager H, et al. Control of confounding in the analysis phase: an overview for clinicians. Clin Epidemiol. 2017;9:195–204.
- Trestini I, Carbognin L, Monteverdi S, et al. Clinical implication of changes in body composition and weight in patients with early-stage and metastatic breast cancer. Crit Rev Oncol Hematol. 2018;129:54–66.
- Cortazar P, Zhang L, Untch M, et al. Pathological complete response and long-term clinical benefit in breast cancer: the CTNeoBC pooled analysis. Lancet. 2014;384(9938):164–172.
- Denkert C, Loibl S, Muller BM, et al. Ki67 levels as predictive and prognostic parameters in pretherapeutic breast cancer core biopsies: a translational investigation in the neoadjuvant GeparTrio trial. Ann Oncol. 2013;24(11):2786–2793.
- Denkert C, von Minckwitz G, Darb-Esfahani S, et al. Tumour-infiltrating lymphocytes and prognosis in different subtypes of breast cancer: a pooled analysis of 3771 patients treated with neoadjuvant therapy. Lancet Oncol. 2018;19(1):40–50.
- Soliman H, Wagner S, Flake DD 2nd, et al. Evaluation of the 12-gene molecular score and the 21-gene recurrence score as predictors of response to neo-adjuvant chemotherapy in estrogen Receptor-Positive, HER2-Negative breast Cancer. Ann Surg Oncol. 2020;27(3):765–771. Mar
- Chou HH, Kuo WL, Yu CC, et al. Impact of age on pathological complete response and locoregional recurrence in locally advanced breast cancer after neoadjuvant chemotherapy. Biomed J. 2019;42(1):66–74.
- Korde LA, Somerfield MR, Carey LA, et al. Neoadjuvant chemotherapy, endocrine therapy, and targeted therapy for breast cancer: ASCO guideline. J Clin Oncol. 2021;39(13):1485–1505.
- Bröstcancer-Nationellt vårdprogram. 2020. [cited 4 June 2021]. Available from: https://kunskapsbanken.cancercentrum.se/globalassets/cancerdiagnoser/brost/vardprogram/nationellt-vardprogram-brostcancer.pdf.
- Matthews SB, Thompson HJ. The Obesity-Breast Cancer Conundrum: an analysis of the issues. Int J Mol Sci. 2016;17(6):989.
- Schoemaker MJ, Nichols HB, Wright LB, et al. Association of body mass index and age with subsequent breast cancer risk in premenopausal women. JAMA Oncol. 2018;4(11):e181771.
- Renehan AG, Zwahlen M, Egger M. Adiposity and cancer risk: new mechanistic insights from epidemiology. Nat Rev Cancer. 2015;15(8):484–498.
- Arendt LM, Kuperwasser C. Working stiff: how obesity boosts cancer risk. Sci Transl Med. 2015;7(301):301fs34.
- Seo BR, Bhardwaj P, Choi S, et al. Obesity-dependent changes in interstitial ECM mechanics promote breast tumorigenesis. Sci Transl Med. 2015;7(301):301ra130.
- Gourgue F, Derouane F, van Marcke C, et al. Tumor apelin and obesity are associated with reduced neoadjuvant chemotherapy response in a cohort of breast cancer patients. Sci Rep. 2021; 11(1):9922.
- Neuhouser ML, Aragaki AK, Prentice RL, et al. Overweight, obesity, and postmenopausal invasive breast cancer risk: a secondary analysis of the women's health initiative randomized clinical trials. JAMA Oncol. 2015;1(5):611–621.
- Di Cosimo S, Porcu L, Agbor-Tarh D, et al. Effect of body mass index on response to neo-adjuvant therapy in HER2-positive breast cancer: an exploratory analysis of the NeoALTTO trial. Breast Cancer Res. 2020;22(1):115.
- Fontanella C, Lederer B, Gade S, et al. Impact of body mass index on neoadjuvant treatment outcome: a pooled analysis of eight prospective neoadjuvant breast cancer trials. Breast Cancer Res Treat. 2015150(1):127–139.
- Symmans WF, Peintinger F, Hatzis C, et al. Measurement of residual breast cancer burden to predict survival after neoadjuvant chemotherapy. J Clin Oncol. 2007;25(28):4414–4422.
- Sterne JA, White IR, Carlin JB, et al. Multiple imputation for missing data in epidemiological and clinical research: potential and pitfalls. BMJ. 2009;338:b2393.
- Banack HR, Kaufman JS. From bad to worse: collider stratification amplifies confounding bias in the obesity paradox. Eur J Epidemiol. 2015;30(10):1111–1114.
- Sperrin M, Candlish J, Badrick E, et al. Collider bias is only a partial explanation for the obesity paradox. Epidemiology. 2016;27(4):525–530.