
Introduction
Accurate determination of the stopping power ratio (SPR) of the tissues along the beam path is required for calculations of dose deposition in proton therapy. Schneider et al. [Citation1] proposed a stoichiometric calibration method to convert computed tomography (CT) numbers to SPRs via a fitted calibration curve, which is commonly used [Citation2]. However, this conversion introduces an uncertainty of 3–3.5% in proton range [Citation2–6]. To minimize the impact of range uncertainty on treatment plans, either larger margins distal and proximal to the tumor are added or robust optimization must be performed [Citation7,Citation8]. This practice may result in irradiating surrounding healthy tissues more than necessary.
Dual-source dual energy CT (DECT) was proposed to address such challenges [Citation6,Citation9]. SPR can be calculated on the basis of the Bethe formula utilizing the relative electron density (ρe) and mean excitation energy (Im) of tissues. Yang et al. [Citation6] first proposed to use ρe and the effective atomic number (Zeff) obtained from DECT to calculate SPR with a linear fit between Zeff and ln Im. Bourque et al. [Citation10] later proposed a continuous association between Zeff and Im, which was well adopted in subsequent studies to estimate Im from Zeff [Citation3,Citation11]. Hudobivnik et al. [Citation12] demonstrated a higher accuracy in SPR derived from DECT than from single-energy CT (SECT). The accuracy of DECT approach was validated in a ground-truth anthropomorphic phantom [Citation13], and its clinical relevance was demonstrated in patient-cohort analyses [Citation14]. The root-mean-square error (RMSE) of SPR with a DECT approach was ≤1%, in comparison with proton beam measurements [Citation15,Citation16].
Dual-layer CT (DLCT) is a newer type of DECT with a novel detector design [Citation17]. DLCT splits the polychromatic X-ray spectrum of a single CT scan into low- and high-energy spectra on a detector level to generate ρe, Zeff, and virtual monoenergetic (MonoE, 40–200 keV) images. A recent evaluation of the first commercial DLCT system reported that the accuracy of ρe was better than 1%, as compared with that of reference values, and the deviation in Zeff was within ±2%, except for lung tissues [Citation18].
Studies on DLCT for particle therapy applications are scarce. Feller et al. [Citation19] reported 0.6% accuracy of SPR prediction for tissue-mimicking materials (TMMs) by comparing calculated and measured SPRs with carbon ion beams. Landry et al. [Citation20] showed that <1% RMSE in SPR can be achieved with DLCT for TMMs. Nevertheless, lung TMM inserts exhibited larger errors for all quantities in their study and were therefore excluded from the reported RMSE values. The chemical compositions of fresh tissues differ from those of TMMs, which can affect the proton beam transport. The experimental validation of proton range with DLCT using real tissues is pertinent and much needed.
In this study, we determined the accuracy of SPR estimated from DLCT and performed the first experimental validation of proton ranges calculated in a treatment-planning system (TPS) for both TMMs and animal tissues.
Materials and methods
The Supplemental materials contain additional details on materials and methods.
CT scans and preparation of phantoms and animal tissues
Both SECT and DLCT data were simultaneously acquired with a Philips IQon spectral CT scanner with the following settings: 120 kVp, 18.9 mGy CTDIvol, 16 × 0.625 mm collimation, and 1.5-mm slice thickness. CT numbers of images were generated by using iDose4 level-3 iterative reconstruction.
Eleven types of TMMs from a tissue characterization phantom (Gammex Model 467, Sun Nuclear, Middleton, WI, USA) were scanned (see ).
Table 1. Percent difference in SPR from reference values with SECT and DLCT for TMMs of a tissue characterization phantom (Gammex 467).
Seven fresh bovine (lung, liver, and kidney) and porcine (brain, meat [muscle], shoulder, and bone) tissues and two frozen animal tissues (liver and lung) were also scanned. The meat was pure soft tissues. The shoulder contained soft tissues and bones inside. The animal samples were reasonable tightly packed into the container with reasonable efforts and with added water added subsequently. Lung samples were as packed with care to avoid deformation with no water added. Extra care was taken using a utility cart to maintain the container stability during the transfer of moving the samples between CT room and adjacent irradiation rooms. The time between scan and irradiation was minimized by performing the experiments when both rooms were available.
Calibration and SPR calculations
SPR calculations with SECT followed the stoichiometric calibration method proposed by Schneider et al. [Citation1]. A tissue characterization phantom (Gammex 467) with TMM inserts was scanned to extract the TMM-specific CT numbers. To avoid the partial volume effect at the boundary of each insert, we included approximately 80% of the insert volume in the volumes of interest. DLCT does not require a prior calibration for monoenergetic images. Comparisons of measured CT numbers and those calculated by the theoretical mass attenuation coefficients are provided in Supplemental Section S.3. SPRs with DLCT were derived from ρe and Zeff by applying a combination of the Saito [Citation21] and Zhu–Penfold [Citation22] methods to a pair of 70 keV and 100 keV MonoE images. The reference SPRs for TMMs were calculated for 221 MeV proton beams using vendor-provided chemical compositions.
Treatment planning
Treatment plans for the proton beam delivery system PROBEAT-V (Hitachi America, Ltd., Tarrytown, NY, USA) were designed in Varian Eclipse TPS. The proton range R90 corresponding to the 90% dose at the distal edge of the spread-out Bragg peak was determined from the plan and used to calculate tissue water equivalent thickness (WET).
Proton range measurements with TMM and animal tissues
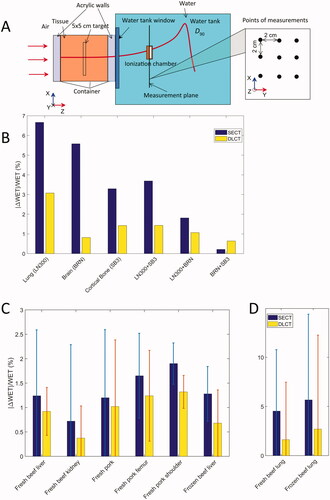
The ranges of proton beams of 200.4 and 221.3 MeV passing through the TMMs and tissues were measured with multi-layer ionization chamber and water tank with an Advanced Marcus chamber, respectively. The single-spot proton beams were aligned with the central axis of the TMM cylinder. For animal tissues, nine measurement positions were marked with 2-cm spacing in a grid of 3 × 3 on the surface of the container () in the center of the uniform field. Treatment plans generated with TPS for experiments were optimized to deliver a uniform dose to a 5 × 5 cm2 target in the center of the tissues by a field of single energy spots.
Figure 1. (A) Experiments with animal tissues placed in containers. The target 5 × 5 cm is the structure used for plan optimization in TPS. (B) Percent deviation of WET for TMMs of a tissue characterization phantom (Gammex 467) with SECT- and DLCT-based methods. The “+” symbol on the X-axis indicates that two types of TMMs were placed one after another in the direction of the beam. (C) and (D) Percent deviation of WET for fresh and frozen animal tissues with SECT- and DLCT-based methods. The error bars are calculated from the measurements at 9 points for 200.4 MeV and 221 MeV.
Results
We summarized the reference SPR values for TMMs and the calculated SPRs with SECT- and DLCT-based methods in . The percent deviation from the reference SPR values was smaller for the DLCT method than it was for the SECT method. The improved accuracy of the SPR calculations was particularly substantial for lung and brain TMMs. For bone and soft tissue TMMs, DLCT produced a <1% deviation in SPR, whereas SECT resulted in up to 2.77% for IB3 (inner bone), 2.63% for BRN (brain), and 2.63% in B200 (bone material) TMMs. The percent deviation for the lung TMM was 5.99% for LN300 and 7.21% for LN450 with SECT, and was reduced to 2.17% and 1.07% for DLCT.
The percent deviations in WET with the SECT and DLCT methods for TMMs are plotted in . The RMSE calculated over six TMMs was 4.15% and 1.62% for the SECT- and DLCT-based methods, respectively. The reduction in the percent deviation of WET from SECT to DLCT for the TMMs in was also observed for the animal tissues in . For all the soft tissues measured, the RMSE was 1.05% and 0.77% with SECT and DLCT, respectively. For the bone tissue (femur), the estimated error was 1.78% and 1.28% with SECT and DLCT, respectively. The largest difference between DLCT and SECT occurred in lung tissues. The percent deviation was reduced from 4.25% to 1.63% for fresh lung and from 5.67% to 2.70% for frozen lung.
Discussion
This is the first experimental validation of SPR calculation with animal tissues for DLCT. The Saito and Zhu–Penfold methods originally proposed for dual-source DECT systems to calculate ρe and Zeff were applied to the MonoE images of DLCT. Substantial improvements in SPR accuracy of lung and brain TMMs were observed. Significant reductions in the differences between calculated and measured proton ranges for animal lung tissues were demonstrated for the first time with DLCT.
Similar to the findings by Bär et al. [Citation15] for dual-source DECT, our study revealed that the SECT method performed reasonably well in SPR estimations for soft tissues, which explains why the gain with DECT was marginal for these tissues.
By using a polymer gel for proton range measurements, Niepel et al. [Citation23] reported that the SECT approach yielded an overall greater mean deviation of 1.2% in SPR calculations, whereas the dual-source DECT method resulted in a 0.2% deviation for all animal tissue samples in their study. In our animal tissue experiments, the derived SPR errors were 1.05% and 0.77% with SECT and DLCT, respectively.
Landry et al. [Citation20] reported the results of SPR calculations for TMMs with DLCT based on MonoE image pairs of 50 keV and 200 keV from 140 kV scans. The SPRs were calculated for a carbon ion beam, and lung TMMs were excluded from their RMSE calculations. They concluded that an accuracy value below 1% can be achieved for SPR calculations with DLCT. We used different MonoE photon images of 70 keV and 100 keV for proton SPR calculations of both TMMs and animal tissues to avoid relying on synthesized MonoE images in the extreme ends of the CT energy range. Our findings on SPR accuracy are consistent with theirs, demonstrating that DLCT is beneficial for deriving SPRs for particle therapy. Our results with lung TMM show that the deviation in SPR was greatly reduced from up to 7% with SECT to up to 2% with DLCT. The large standard deviation in measured SPRs of animal tissues may be associated with the inhomogeneity of the animal tissue samples, causing variations in the WET among 9 measurement points. This is a limitation of the study. Importantly, the DLCT method produced a smaller deviation than did the SECT method.
Feller et al. [Citation19] calculated SPRs of TMMs based on the Bethe equation using ρe and Zeff generated directly from commercial spectral basis images of DLCT. The predicted SPR values were reported to have a mean accuracy of 0.6% compared to measurements with carbon ion beams. We used proton beams and observed percentage deviations ranging from 0.02% (liver) to 1.15% (brain) with a mean value of 0.78% for soft tissue and bone TMMs. Our measurements with the lung TMMs had a larger deviation (up to 2.2%) compared to theirs but demonstrated a greater improvement over the SECT method.
Recent studies evaluating DECT performance on SPR or proton range estimation with animal tissues are summarized in Supplementary Table S.2. Despite differences in the DECT scanners, methods of SPR estimation, and metrics of evaluation, the evidence is strong that DECT, including DLCT, outperforms SECT for SPR and range prediction.
Conclusion
The Saito and Zhu–Penfold methods originally developed for estimating ρe and Zeff, respectively, from high and low kVp images of dual-source DECT were applicable to MonoE images of DLCT. The improved proton range estimation with DLCT was demonstrated, particularly for lung tissues. The improved range estimation with the DLCT method warrants continued investigation of its dosimetric benefits in patients.
Supplemental Material
Download MS Word (500.7 KB)Acknowledgments
The authors thank ALSAC and Philips Healthcare for research support, Nisha Badders, PhD, ELS, for scientific editing, Paul Klahr, MS, of Philips Healthcare for conceptualization, Radhe Mohan, PhD, of MD Anderson Cancer Center for valuable suggestions, Jiahua Zhu, PhD and David Sobczak for assisting experimental measurements and calculations, Cristel Baiu of Sun Nuclear for providing phantom TMMs and their batch-specific properties, and Wei Liu, PhD, at Mayo Clinic Arizona for his valuable discussions on proton range uncertainty.
Disclosure statement
C. H. received research support from Philips Healthcare and Y. Y. is a current employee of Philips Medical Systems.
Data availability statement
Data presented in this manuscript are available upon reasonable request.
References
- Schneider U, Pedroni E, Lomax A. The calibration of CT Hounsfield units for radiotherapy treatment planning. Phys Med Biol. 1996;41(1):111–124.
- Taasti VT, Baumer C, Dahlgren CV, et al. Inter-centre variability of CT-based stopping-power prediction in particle therapy: survey-based evaluation. Phys Imaging Radiat Oncol. 2018;6:25–30.
- Li B, Lee H, Duan X, et al. Comprehensive analysis of proton range uncertainties related to stopping-power-ratio estimation using dual-energy CT imaging. Phys Med Biol. 2017;62(17):7056–7074.
- Moyers MF, Miller DW, Bush DA, et al. Methodologies and tools for proton beam design for lung tumors. Int J Radiat Oncol Biol Phys. 2001;49(5):1429–1438.
- Paganetti H. Range uncertainties in proton therapy and the role of Monte Carlo simulations. Phys Med Biol. 2012;57(11):R99–R117.
- Yang M, Virshup G, Clayton J, et al. Theoretical variance analysis of single- and dual-energy computed tomography methods for calculating proton stopping power ratios of biological tissues. Phys Med Biol. 2010;55(5):1343–1362.
- Li H, Zhang XD, Park P, et al. Robust optimization in intensity-modulated proton therapy to account for anatomy changes in lung cancer patients. Radiother Oncol. 2015;114(3):367–372.
- van der Voort S, van de Water S, Perko Z, et al. Robustness recipes for minimax robust optimization in intensity modulated proton therapy for oropharyngeal cancer patients. Int J Radiat Oncol Biol Phys. 2016;95(1):163–170.
- van Elmpt W, Landry G, Das M, et al. Dual energy CT in radiotherapy: current applications and future outlook. Radiother Oncol. 2016;119(1):137–144.
- Bourque AE, Carrier J-F, Bouchard H. A stoichiometric calibration method for dual energy computed tomography. Phys Med Biol. 2014;59(8):2059–2088.
- Su K-H, Kuo J-W, Jordan DW, et al. Machine learning-based dual-energy CT parametric mapping. Phys Med Biol. 2018;63(12):125001.
- Hudobivnik N, Schwarz F, Johnson T, et al. Comparison of proton therapy treatment planning for head tumors with a pencil beam algorithm on dual and single energy CT images. Med Phys. 2016;43(1):495–504.
- Wohlfahrt P, Mohler C, Richter C, et al. Evaluation of stopping-power prediction by dual- and single-energy computed tomography in an anthropomorphic ground-truth phantom. Int J Radiat Oncol Biol Phys. 2018;100(1):244–253.
- Wohlfahrt P, Mohler C, Stutzer K, et al. Dual-energy CT based proton range prediction in head and pelvic tumor patients. Radiother Oncol. 2017;125(3):526–533.
- Bär E, Lalonde A, Zhang R, et al. Experimental validation of two dual-energy CT methods for proton therapy using heterogeneous tissue samples. Med Phys. 2018;45(1):48–59.
- Taasti V, Michalak GJ, Hansen DC, et al. Validation of proton stopping power ratio estimation based on dual energy CT using fresh tissue samples. Phys Med Biol. 2017;63(1):015012.
- Johnson TRC. Dual-energy CT: general principles. AJR Am J Roentgenol. 2012;199*(5 Suppl):S3–S8.
- Hua C, Shapira N, Merchant TE, et al. Accuracy of electron density, effective atomic number, and iodine concentration determination with a dual-layer dual-energy computed tomography system. Med Phys. 2018;45(6):2486–2497.
- Faller FK, Mein S, Ackermann B, et al. Pre-clinical evaluation of dual-layer spectral computed tomography-based stopping power prediction for particle therapy planning at the Heidelberg Ion Beam Therapy Center. Phys Med Biol. 2020;65(9):095007.
- Landry G, Dorringer F, Si-Mohamed S, et al. Technical note: relative proton stopping power estimation from virtual monoenergetic images reconstructed from dual-layer computed tomography. Med Phys. 2019;46(4):1821–1828.
- Saito M. Potential of dual-energy subtraction for converting CT numbers to electron density based on a single linear relationship. Med Phys. 2012;39(4):2021–2030.
- Zhu J, Penfold SN. Dosimetric comparison of stopping power calibration with dual-energy CT and single-energy CT in proton therapy treatment planning. Med Phys. 2016;43(6):2845–2854.
- Niepel KB, Stanislawski M, Wuerl M, et al. Animal tissue-based quantitative comparison of dual-energy CT to SPR conversion methods using high-resolution gel dosimetry. Phys Med Biol. 2021;66(7):075009.