
Abstract
Introduction
Treatment with 2-weekly docetaxel 50 mg/m2 was shown to improve overall survival and was better tolerated than the standard 75 mg/m2 3-weekly regimen in men with metastatic castration-resistant prostate cancer (mCRPC) in the original randomised PROSTY trial. The aim of this study was to investigate, whether quality of life (QoL) effects would differ between the 2-weekly docetaxel 50 mg/m2 regimen from the standard 3-weekly 75 mg/m2 treatment.
Materials and Methods
QoL data were collected with the Functional Assessment of Cancer Therapy – Prostate (FACT-P) and Functional Assessment of Cancer Therapy Advanced Prostate Symptom Index − 8 Item version (FAPSI-8). Pain was measured using the Visual Analogue Scale (VAS). A total of 743 forms from 163 patients were analysed in Arm A (2-weekly docetaxel), and 704 forms from 173 patients were analysed in Arm B (3-weekly docetaxel). The data were analysed using both the Wilcoxon signed rank test (with Holm–Bonferroni adjustment) and Mann–Whitney U models.
Results
No major differences were found in total QoL. Total QoL was higher at month 8 in Arm B (p = .020), but this was reversed in the following month (p = .043), and no statistically significant differences were found during other months. Compared to Arm A, participants in Arm B had longer-lasting deterioration in FAPSI-8 scores and emotional well-being subdomain at the beginning of treatment (p < .05). Various one-month differences were found in FACT-P subdomains (except for functional well-being), and these favoured participants in Arm A, except for the prostate-cancer subdomain. There were no differences in pain.
Conclusion
Based on our results, 2-weekly docetaxel was not inferior to 3-weekly docetaxel in terms of total health-related QoL and seemed to be superior at least in terms of the FAPSI-8 and emotional well-being subdomain in the first three to four months of treatment. More research on the topic is suggested to confirm the results.
Introduction
Although novel therapeutics have emerged, docetaxel remains a mainstay in the treatment of metastatic castration-resistant prostate cancer (mCRPC) [Citation1–5]. The expected treatment response and tolerance are moderate with the standard 75 mg/m2 3-weekly regimen. As drug-related toxicity does exist, it is still important to search for new alternatives for these patients [Citation6,Citation7].
The PROSTY trial was a phase III, prospective randomised multinational trial that compared 2-weekly administration of docetaxel 50 mg/m2 to the standard 75 mg/m2 3-weekly regimen [Citation7]. The 2-weekly regimen had a favourable Grade 3–4 toxicity profile on Common Toxicity Criteria (CTC) of National Cancer Institute (NCI) version 2.0 and led to 2.5 months gain in median overall survival (OS, p = .021) when compared to the standard 3-weekly regimen [Citation7,Citation8]. This led to an acknowledgement in the National Comprehensive Cancer Network® (NCCN) guideline on prostate cancer as an alternative dosing for mCRPC, as well as in the European Association of Urology (EAU). Moreover, International Society of Geriatric Oncology (SIOG) guidelines on prostate cancer recommended 2-weekly regimen particularly for elderly patients [Citation3,Citation4,Citation9]. However, the 2-week regimen is not mentioned in the American Urological Association/American Society for Radiation Oncology/Society of Urologic Oncology (AUA/ASTRO/SUO), European Association of Urology (EAU) or European Society of Medical Oncology (ESMO) guidelines [Citation5,Citation10]. Furthermore, only 10% of experts preferred 2-weekly regimen over 3-weekly or weekly dosing in Advanced Prostate Cancer Consensus Conference (APCCC) 2017 [Citation11]. Perhaps this is because the health-related quality of life (HRQoL) results have not been previously published. The aim of this study was to investigate, whether 2-weekly docetaxel 50 mg/m2 would differ from the standard 75 mg/m2 3-weekly regimen in terms of HRQoL, and thus find out if HRQoL effects would support the use of 2-weekly docetaxel or not. The quality of life (QoL) was classified as a secondary endpoint of PROSTY trial. The null hypothesis was that QoL would not differ (clinically) significantly between the treatment groups.
Material and methods
The PROSTY trial was a multicentre investigator-initiated study that took place in 11 hospitals in Finland, Ireland and Sweden. All participants signed a written, informed consent form. The trial was registered to the clinicaltrials.gov database (number NCT00255606) before the enrolment period. The study was approved by ethics committees in each participating country. Patient accrual and data collection were conducted between 2004 and 2009. The rate of treatment failures was 100% at the end of the study. Treatment failure was defined as disease progression, intolerable toxicity, patient refusal to continue treatment or death. Time to treatment failure was the primary endpoint in the study. The power calculations were based on the primary endpoint purposes [Citation7]. Consolidated Standards of Reporting Trials (CONSORT) guidelines were used in the reporting of this trial [Citation12].
The main inclusion criteria for the study were adult men with World Health Organisation (WHO) performance scores of 0–2, the presence of distant metastases of prostate cancer (M1) on (conventional) imaging and biochemically confirmed castration-resistant status by plasma testosterone levels under 1.7 nmol/l and elevating prostate-specific antigen (PSA) during castration treatment. No previous chemotherapy except estramustine was allowed. Exclusion criteria are described in detail in the primary publication [Citation7]. Individuals with a previous history of other malignancies, significantly increased serum creatinine or major blood count or liver enzyme abnormalities were not allowed.
QoL instrument used in this study was the Finnish, English or Swedish version of the Functional Assessment of Cancer Therapy – Prostate (FACT-P) questionnaire [Citation13,Citation14]. This is a validated tool for evaluating QoL in patients with prostate cancer, and it contains 39 questions that are divided into physical, social/family, emotional and functional well-being subdomains and the prostate cancer specific subdomain [Citation13]. Additionally, FACT Advanced Prostate Symptom Index-8 (FAPSI-8) data were analysed [Citation15,Citation16]. The FAPSI-8 contains eight key questions derived from the FACT-P questionnaire and is specifically designed for men with advanced prostate cancer, which was the reason it was used along with the complete FACT-P questionnaire [Citation15]. Higher scores indicate better QoL in the FACT-P and its subdomains. Both FACT-P and FAPSI-8 are validated to evaluate QoL during the treatment [Citation13,Citation15,Citation17]. Pain was assessed with the Visual Analogue Scale (VAS) [Citation18]. Possible VAS values range from 0 to 100 mm, where 0 mm equals for no pain and 100 mm the worst imaginable pain.
According to the power calculations, which were conducted for the primary end-point purposes, 361 patients were randomised to either 2-weekly docetaxel 50 mg/m2 (Arm A, N = 177) or docetaxel 75 mg/m2 every three weeks (Arm B, N = 184). The number of the treatment cycles was not limited, but the treatment was continued until complete response, treatment failure or the end of study (the treatment failure rate was 100% at the end of the study). After randomisation, 15 noneligible patients according to the inclusion and exclusion criteria were additionally identified, meaning that the cohorts consisted of 170 patients in Arm A and 176 patients in Arm B. However, only 163 men in Arm A and 173 men in Arm B returned FACT-P questionnaires, meaning that seven patients in Arm A and three patients in Arm B were lost to HRQoL follow-up.
According to the protocol, FACT-P forms were collected every six weeks (before docetaxel infusion), at the end of treatment and every two months after treatment failure until subsequent therapy was initiated. The collected data were analysed for every month, up to a year, to increase accuracy in relation to time. The early responders were considered to be similar to the late responders except for the probability of progression and treatment burden. These both correlate with time and are likely less biased due to this procedure. The patients responded to the questionnaires in paper format at home. The patients visited doctor every six weeks during the treatment, within a month after the treatment failure and every 12 weeks during the follow-up (after the treatment failure) in both arms. A nurse checked the patient before infusion, made sure that the patient had received the possible premedication (e.g., antiemetic agents), administered docetaxel and followed the patient during the intravenous administration for possible side-effects.
Statistical analysis
The method for handling the missing data in the study was a pattern mixture model with a patient subdomain mean substitution. Patients with ≥50% nonresponse in any subdomain were excluded (N = 45), as suggested by Fairclough et al. [Citation19]. Nonresponse in the final model was 2.1%, which is acceptable [Citation19]. Only one form for each patient for a single time period was allowed. If the patient returned more than one form for a single month, the form included in the analysis was chosen by lot (N = 28). The majority of forms returned in this manner were of the same content, meaning that a patient had filled two identical copies, one for the last treatment and one for the required end of treatment evaluation. The end of treatment FACT-P questionnaires and follow-up visits after treatment failure were not analysed separately for this study design, but along with patients still in active treatment of the corresponding month.
All the exclusions are depicted graphically in . Qualitative analysis of the returned questionnaires by the type of visit is available in . Overall, 743 forms in Arm A and 704 forms in Arm B were analysed. The distributions were highly skewed, meaning that parametric models could not be used. The data were analysed using both the paired Wilcoxon signed rank test (comparisons within groups towards the baseline value) and the independent Mann–Whitney U-test (direct comparisons between groups). The multiplicity adjustment was made for in-group comparisons towards the baseline since a repeated measure was used for comparison 12 times [Citation20]. The multiplicity adjustment was made using the Holm–Bonferroni method [Citation21]. For VAS, which also had skewed distributions, only Mann–Whitney U-tests were performed.
Figure 1. Flowchart depicting included and excluded FACT-P questionnaires. Additional two forms were excluded from the in-group model only due to a missing baseline questionnaire. Arm A: docetaxel 50 mg/m2 every two weeks; Arm B: docetaxel 75 mg/m2 every three weeks.
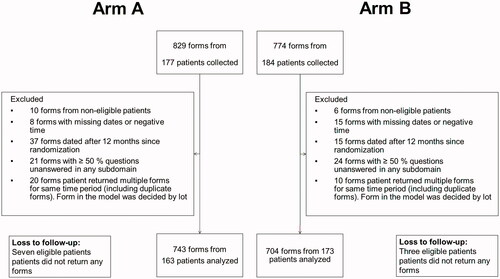
Table 1. Forms by type of the visit for each Arm.
Although QoL was classified as a secondary endpoint in PROSTY trial per protocol, the minimally clinically important differences (MCIDs) were not defined in protocol but decided prior the statistical analysis according to the current scientific knowledge on HRQoL analysis of FACT-P published after the initiation of PROSTY trial [Citation22–24]. MCIDs were defined as 6 points in mean for the total FACT-P score, 2 points for the FAPSI-8 and each subdomain, with exceptions of the social/family well-being (SWB) score and emotional well-being (EWB) score, for which 1-point limits were used. MCIDs for FACT-P total score, prostate cancer subscale (PCS) and FAPSI-8 were based on the study by Cella et al. with patients with metastatic castration-resistant prostate cancer [Citation22]. MCIDs for the remaining subdomains were based on the meta-analysis by King et al., which consisted of patients from 71 trials with different kinds of cancer surveyed with Functional Assessment of Cancer Therapy – General (FACT-G), which is identical to FACT-P except it omits the PCS subdomain [Citation23,Citation24]. Studies determining MCID for other FACT-P subdomains than PCS consisting of mCRPC patients do not exist to our knowledge. VAS was defined as a 23 mm difference in medians, based on Olsen et al. [Citation25]. The statistical analysis was conducted using IBM® SPSS® version 26 and R-software version 4.1.1. The post hoc power analysis was conducted using G*Power software version 3.1.9.7.
Power analysis
Power calculations were originally made for primary end-point purposes. Power analysis was performed post hoc to interpret the results reliably within this trial, and its results are available in the supplementary material (Supplementary Material Table S1). The number of returned forms diminished steadily towards the end of follow-up, reflecting mortality and the rate of treatment failures, and was more prominent in Arm B.
Considering comparisons within groups compared to the baseline, the power remained acceptable (with one exception at 5 months at Arm B) until 7 months, which means that direct comparisons towards the baseline considering differences between arms are recommended only until 7 months, and tabulated results for in-group comparisons towards the baseline are reported only until 7 months in the main article to avoid misinterpretation. The tabulated results for the remaining timepoints are available in the supplementary material and are described for the significant part.
The power does not affect similarly to the comparability of head-to-head model, which means all the statistically significant differences are to be interpreted in terms of superiority or inferiority regardless of power. However, the observed power was over 80% only at baseline and months 2, 3 and 4, warranting caution when drawing conclusions outside these perimeters due to the potential type-II error. We recommend using in-group data for interpretation until the seven-month timepoint, after which we recommend using head-to-head comparisons as complementary data.
Results
There were no statistically significant differences at baseline in total FACT-P scores, FAPSI-8 scores, VAS scores or any FACT-P subdomains. The median age of the participating patients was 68 years in Arm A (range 46–85 years) and 69 years in Arm B (range 45–87 years). In Arm A, 62% of the patients and in Arm B, 60% belonged to WHO performance status category 1 (‘restricted in strenuous activity’), while 32% and 34% (respectively) belonged to performance status category 0 (‘normal performance’). The remainders (6% in both arms) belonged to category 2 (‘unable to work, up and about over a half of the day’). The total FACT-P score means at baseline were 46.8 in Arm A and 46.6 in Arm B (medians 43.0 and 44.0, respectively, p > .99), while the FAPSI-8 score means were 9.5 and 10.0 (p = .64). A total of 147 men in Arm A and 149 men in Arm B completed the baseline questionnaire.
The baseline characteristics were similar in both Arms. The median serum PSA was 116 nanograms per microlitre (ng/ml) in arm A and 109 ng/ml in arm B, and the difference was statistically nonsignificant. Twelve percent in Arm A and 13% in Arm B had previous prostatectomy, 58% versus (vs.) 53% had received radical-intent radiotherapy, 91% vs. 93% had been treated with hormonal therapy and 7% vs. 11% had been treated with estramustine.
The first seven months
There were no clinically significant changes in total HRQoL during the first seven months of follow-up in either model (). In Arm B, there was a decline compared to the baseline HRQoL not exceeding the clinically significant threshold in the first month (difference in means −4.8, p < .012, adjusted for multiplicity [adj.]). In the FAPSI-8, however, differences compared to the baseline were observed (). In Arm B, QoL measured in the FAPSI-8 remained both clinically and statistically decreased for the first three months (mean differences −2.6, −2.9, −2.9; adj. P-values <.012, .012, <.012). In Arm A, however, FAPSI-8 scores decreased both clinically and statistically significantly only for the first month (−2.7; adj. p < .012). In the following two months, the FAPSI-8 score decreased statistically but not clinically significantly (−1.9 and −1.9; adjusted P-values <.012 and <.012). At the remaining time points, statistically significant differences were not found (adj. P-values >.05). The results for direct comparisons between groups for total FACT-P and FAPSI-8 are available in Supplementary Material Table S2 (there were no significant differences). Graphical boxplot presentations of median, interquartile range (IQR) and range values between arms are shown for total FACT-P score in Supplementary Material Figure S1 and for FAPSI-8 in Supplementary Material Figure S2 for the entire analysis period.
Table 2. Total FACT-P scores compared to the baseline values for months 1 − 7 and directly between groups for months 8 − 12.
Table 3. FAPSI-8 compared to the baseline values for months 1 − 7 and directly between groups for months 8 − 12.
In the emotional well-being subdomain, Arm B suffered a longer-lasting decrease in EWB, which lasted for the first four months (-1.5, −1.3, −1.6 and −1.2; adj. P-values < .012, .020, < .012 and .020). In Arm A, the decrease in EWB was clinically significant only for months 2 and 5 (−1.1 and −1.6; adj. P-values .012 and .027). Additionally, there was one non-clinically significant decrease in month 3 (−0.9, adj. p < .012). The complete tabulated results are available in Supplementary Material Table S3. In head-to-head comparisons, there was only one not clinically significant but statistically significant difference favouring Arm A in the third month (6.3 points vs. 5.5 points; p = .031; Supplementary Material Table S4) during the first seven months.
In physical well-being (PWB) scores, there was one solitary clinically significant improvement in Arm B in month 4 (+2.1, adj. p = .022) compared to the baseline (Supplementary Material Table S5). In addition, there was one non-clinically significant improvement in month 6 (+1.5, adj. p = .012). Participants in Arm A had a consistent trend of statistically significant, but clinically unimportant improvements between months 4 − 7 (+0.8, +1.0, +1.97 and +0.9; adj. P-values < .012, .040, < .012 and < .012). There were no statistically significant differences in direct comparison between the groups in PWB during the first seven months (Supplementary Material Table S6).
In the PCS score, participants in both groups suffered similar deterioration compared to the baseline in month 1 (Arm A: −2.8 and Arm B: −3.5, adj. p < .012 for both) and 3 (Arm A: −2.8 and Arm B: −3.2, adj. p < .012 for both). Additionally, there was one clinically insignificant deterioration in Arm A in month 2 (-1.8, adj. p = .040). The complete results are shown in Supplementary Material Table S7. There were also no statistically significant differences in PCS in direct comparison between groups during the first seven months (Supplementary Material Table S8).
In functional well-being (FWB) scores, there was one solitary, clinically nonsignificant improvement in the fourth month in Arm B (+1.0, adj. p < .012, Supplementary Material Table S9) and no differences in the head-to-head model (Supplementary Material Table S10). In social/family well-being, there were no statistically significant differences in either model during the first seven months (Supplementary Material Tables S11 and S12) or in VAS (Supplementary Material Table S13). Graphical boxplot presentations depicting medians, interquartile ranges and total ranges for the entire analysis period are available in Supplementary Material Figures S3 − S7 (for PCS, PWB, EWB, FWB and SWB, respectively).
Months 8−12
In the head-to-head model, total FACT-P scores favoured Arm B in month 8 (means Arm A: 39.9 vs. Arm B: 51.5 points, p = .020). However, in the following month, the results were reversed (Arm A: 44.2 vs. Arm B: 31.4, p = .043). At eight months, differences were seen in EWB (Arm A: 4.7 vs. Arm B: 6.0, p = .022) and PCS (Arm A: 13.7 vs. Arm B: 16.5, p = .022). The FAPSI-8 behaved in a borderline significant manner (Arm A: 6.3 vs. Arm B: 8.7, p = .053). In the ninth month, Arm A was superior in PWB (Arm A: 7.1 vs. Arm B: 4.7, p = .034) and SWB (Arm A: 6.6 vs. 4.0, p = .029), meaning the differences were attributed to different subdomains of FACT-P. In the last three months, the rate of participation was quite low due to the progression of the disease (remaining greater in Arm A, reflecting the difference in OS), but there was one additional clinically significant difference in PWB in the final month (N = 20) of the analysis period (Arm A: 8.1 vs. Arm B: 4.1, p = .048). The VAS scores remained similar (grand means 1.9 for Arm A and 1.7 for Arm B) in both groups for months 8 − 12 (p > .05). As discussed previously, the in-group comparisons are not comparable after the seventh month due to the decreasing number of patients in both groups. However, no statistically significant deteriorations compared to the baseline were observed with these sample sizes in months 8 − 12. A clinically nonsignificant improvement trend in PWB persisted in Arm A from 8 months until 10 months (difference in means: +0.4, +1.1, +1.2; adj. P-values < .012, .040, .042). The remaining total FACT-P scores and FAPSI-8 scores compared to the baseline scores are shown in Supplementary Material Table S14. No statistically significant differences were present in total FACT-P or FAPSI-8 even in unadjusted (exact) P values. A summary of the complete results for the entire analysis period is shown in .
Table 4. Summary of the clinically and statistically significant results from both models.
Discussion
Since it was already known that patients who received docetaxel 50 mg/m2 with 2-weekly dosing gained a 2-month-benefit in OS compared to those receiving the standard regimen, the most important matter to investigate was if these patients would have inferior QoL compared to those who received 75 mg/m2 of docetaxel every three weeks [Citation7]. Our results do not support this view regarding the total QoL and key elements of QoL measured by the FAPSI-8. Only for PCS, non-inferiority could not be shown, as Arm B outranked Arm A once in the eight months in head-to-head model, and declines compared to the baseline values were similar in both groups. However, similar one-month differences were also found to favour Arm A in EWB, SWB and PWB scores. In the FIRSTANA and PROSELICA trials, which studied cabazitaxel for mCRPC, a deterioration or improvement had to be present in two subsequent measurements to confirm the results [Citation26]. Arguments for such a definition were not given, but as seen in this study, the QoL in patients with mCRPC can fluctuate somewhat, and such a definition may indeed be reasonable [Citation26]. If the results confirmed in this manner had been considered significant, the declines in QoL would have only been observed in the FAPSI-8 and EWB in Arm B during the first months. This would support the claim that biweekly docetaxel is not inferior and, based on our results, seems to be superior to triweekly docetaxel, at least in the FAPSI-8 and EWB, during the beginning of treatment.
The biweekly docetaxel 50 mg/m2 had reduced incidence of grade 3–4 neutropenia and febrile neutropenia compared to triweekly 75 mg/m2 [7]. In QoliTax trial, which investigated the impact of adverse effects of docetaxel on QoL in cancer patients in general (of which 48.1% were PC patients), grade 3–4 leukopenia during docetaxel treatment did not affect significantly QoL [Citation27]. However, grade 3–4 infections did have a negative impact on patients’ total HRQoL, although not linked to emotional functioning [Citation27]. On the other hand, grade 3–4 nausea was associated with a detrimental effect on patients’ emotional functioning as well as total HRQoL [Citation27]. In PROSTY trial, biweekly docetaxel had no reduced rate of grade 3–4 nausea compared to the triweekly docetaxel, but there was smaller incidence of grade 1–2 nausea (34% vs. 48%). Whether milder nausea is also associated with worse emotional QoL, requires more study. There could also be other explanations to differences: more frequent visits to the hospital required by biweekly dosing could give a stronger sense of safety, which could be linked to the EWB.
The shifting behaviour of the total FACT-P in the eighth and ninth months was interesting. The total QoL remained rather stable in Arm A (means 39.9 and 44.2, Ns 30 and 29), although 39.9 was the minimum QoL in Arm A during the analysis period. In Arm B, the QoL was at the maximum in the eighth month (51.5, N = 26) and then dropped to the minimum in the ninth month (31.4, N = 19). Small sample sizes are known to overestimate effect sizes (absolute differences); however, this does not erase significance [Citation28]. The proportion of end of treatment (EoT) evaluations was high in the eighth month in Arm B (42.3%). However, no similar effect was found in the fifth month, when the proportion of EoT evaluations was even higher (44.4%). The reason for EoT was also collected, and we noticed that in the fifth month, most EoT decisions in Arm B were due to progression (68.7%), while in the eighth month, the majority (54.5%) were due to other reasons, that is, side effects or an individual decision by the patient. This could suggest that QoL could decrease more substantially in the subsequent follow-ups if the treatment failure is due to a patient refusal to continue or side effects compared to those with progression. More research on the topic is needed.
The statistical method (a pattern-mixture model with patient subdomain mean substitution) is the least biased method possible for FACT-P to our knowledge, meaning that the results are very accurate when the power is over 80% [Citation19]. Mixed models are mostly used in similar studies. However, they produce biased results when the data are not missing at random (MNAR), for example, if the missingness is related to mortality [Citation29,Citation30]. We postulated that missingness was related to mortality in this setting and that patients near death would return fewer forms and have weaker quality of life, thus representing another MNAR mechanism. Another issue in mixed models is related to the handling of missing data, which still frequently go unreported in clinical trials [Citation31]. If the exclusion is based on a relatively low nonresponse (over 20%, for example), this will lead to unnecessary loss of power and larger bias if the nonresponse is not due to random factors [Citation32,Citation33]. Fairclough et al. demonstrated that nonresponse is associated with higher age and living alone, so a mixed model approach would have been biased towards younger men and men living with a partner [Citation19]. However, a linear mixed model produced similar results to the pattern mixture model in the AFFIRM trial comparing enzalutamide versus placebo in men with mCRPC [Citation34]. The non-parametric approach may be difficult to fathom, and solutions based on the categorical classification into groups (‘maintained QoL’, ‘deteriorated QoL’, ‘improved QoL’), which make the data more parametric, have been used [Citation26]. However, such procedures reduce statistical power and have a higher rate of type-I and type-II errors [Citation35,Citation36].
Limitations of the study and design
Our study has several limitations as well. The most obvious concern is the declining power after 7 months, a phenomenon also depicted in other similar studies [Citation26]. The power calculations were not made for QoL data for which it is expected that response rate is more around 50% than close to 100% [Citation37]. The MCIDs were not defined until before the statistical analysis, not per protocol. This is understandable from the historical perspective, since the first consensus statements about the use of MCIDs were not published until year after the initiation of the trial in 2005, although there had been a consensus meeting in 2002, which only mainly concluded that more research on the topic was needed at the time [Citation38,Citation39]. Even if the MCIDs would have been defined per protocol, the contemporary definitions from 2000s based on the standard deviation would be outdated now. However, due to the aforementioned limitations, it could be argued that the design was not truly developed to substantiate QoL differences, and the present study can be considered exploratory in this regard. The evidence presented would therefore benefit from support from other trials designed to investigate exclusively QoL.
Towards the end of the analysis period the sample sizes are small due to the incurable nature of mCRPC. However, this is emphasised in the interpretation. If the analysis period were selected solely based on power, then months 8 and 9 would not have been analysed, and many significant findings would have been lost. Collecting QoL information of patients in their final months of life from trials is difficult but important for the general view [Citation40]. Combining data for several studies may be the only solution to yield powerful results. However, QoL of patients after treatment failure was followed more seldom than patients in ongoing treatment, and in retrospect, if the follow-up schedule had been equal, slightly more power would have been preserved. Treatment cycles differed in duration between arms, which means that cumulative dose at the time of average response also differ slightly. The difference in cumulative dose was highest in month 7 (800 mg/m2 in Arm A and 750 mg/m2 in Arm B), with no apparent effect on QoL results.
Another limitation is the age of the study. The trial was conducted between 2004 and 2009, and the primary results were published in 2013 [Citation7]. Over the past 10 years, the second- and third-line treatment of mCRPC has improved, and thus, the QoL of patients with mCRPC in clinical practice may be different compared to that 10 to 15 years ago [Citation41–46]. However, because fewer patients received second-line treatment, fewer patients were lost to follow-up since this was an exclusion criterion, although some patients enrolled in subsequent trials. Imaging was based on conventional methods, and the results may not be extrapolated to patients who are negative for M1 disease on conventional imaging but positive on prostate-specific membrane antigen (PSMA) -labelled positron emission tomography or PSMA-labelled computer tomography [Citation3]. Because of greatly changing landscape of PC treatment due to the developments in radioisotope imaging, we suggest the future trials on the topic to be based on PSMA-imaging. The results also apply only to those patients who receive docetaxel in first-line chemotherapy for mCRPC or after estramustine.
This study also was not intended to compare the cost-effectiveness of biweekly docetaxel treatment to the triweekly treatment in relation to the benefit gained. Since biweekly regimen requires 1.5 times more frequent visits to the hospital, it also increases the costs. The patent of docetaxel has expired in Europe, and it is currently quite affordable, meaning that the increased costs would mainly be caused by personnel costs, which greatly vary between different countries [Citation47]. The rate of febrile neutropenic infections was also higher with the standard triweekly docetaxel (p = .001) [Citation7]. As these infections usually require ward care in the hospital, they are also costly.
Conclusions
Based on our results, two-weekly docetaxel 50 mg/m2 is equal to the standard 75 mg/m2 every three weeks in terms of total HRQoL and seems to be superior at least in terms of the FAPSI-8 and emotional well-being in the first three to four months. However, we suggest additional research with QoL-exclusive design to confirm the results.
Institutional review board statement
The study was conducted in accordance with the Declaration of Helsinki and approved by the Institutional Ethics Committees in all participating countries (Decision No. ETL R03165M).
Informed consent statement
Written informed consent has been obtained from the patients to publish this paper.
Appendices
CONSORT statement; Supplementary material including Figures S1 − S5 and Tables S1 − S14.
Supplemental Material
Download MS Word (26 KB)Supplemental Material
Download MS Word (13.8 MB)Acknowledgments
To all patients and participating centres of PROSTY trial.
Disclosure statement
RMcD: honoraria from Bayer, Sanofi, Janssen, Astellas Pharma, Bristol-Myers Squibb, Merch Sharp & Dohme, Pfizer, Novartis and Clovis Oncology. Speaker’s Bureau from MSD Oncology. Travel expenses from Pfizer, Janssen-Cilag, Roche and Ipsen. JT: founder and part owner of Docrates Hospital in Helsinki. P.K.: honoraria from BMS, Merck and travel expenses from Sanofi.
Data availability statement
The anonymized version of the data presented in this are available on a reasonable request from the corresponding author. The data are not publicly available due to statutory reasons.
Additional information
Funding
References
- Ryan CJ, Smith MR, Fizazi K, et al. Abiraterone acetate plus prednisone versus placebo plus prednisone in chemotherapy-naive men with metastatic castration-resistant prostate cancer (COU-AA-302): final overall survival analysis of a randomised, double-blind, placebo-controlled phase 3 study. Lancet Oncol. 2015;16(2):152–160.
- Beer TM, Armstrong AJ, Rathkopf DE, et al. Enzalutamide in metastatic prostate cancer before chemotherapy. N Engl J Med. 2014;371(5):424–433.
- Mottet N, Cornford P, van den Bergh RCN, et al. EAU-EANM-ESTRO-ESUR-ISUP-SIOG Guidelines on Prostate Cancer. Edn. presented at the EAU Annual Congress Milan 2021. Arnhem, the Netherlands, EAU Guidelines Office.Available from: https://uroweb.org/guideline/prostate-cancer/.
- Schaeffer E, Srinivas S, Antonarakis ES National Comprehensive Cancer Network (NCCN). NCCN Clinical Practice Guidelines in Oncology (NCCN Guidelines ®): Prostate Cancer. Version 2.2021. [cited, et al. 2021. Aug 24];Available from: https://www.nccn.org/professionals/physician_gls/pdf/prostate.pdf.
- Lowrance WT, Breau RH, Chou R, et al. Advanced prostate cancer: AUA/ASTRO/SUO guideline PART II. J Urol. 2021;205(1):22–29.
- Berthold DR, Pond GR, Soban F, et al. Docetaxel plus prednisone or mitoxantrone plus prednisone for advanced prostate cancer: Updated survival in the TAX 327 study. J Clin Oncol. 2008;26(2):242–245.
- Kellokumpu-Lehtinen PL, Harmenberg U, Joensuu T, PROSTY study group, et al. 2-weekly versus 3-weekly docetaxel to treat castration-resistant advanced prostate cancer: a randomised, phase 3 trial. Lancet Oncol. 2013;14(2):117–124.
- National Cancer Institute (NCI): Division of Cancer Treatment & Diagnosis (DCTD). Common Toxicity Criteria (CTC). Version 2.0 1999. [cited 2021 Dec 8]; Available from: https://ctep.cancer.gov/protocoldevelopment/electronic_applications/docs/ctcv20_4-30-992.pdf.
- Boyle HJ, Alibhai S, Decoster L, et al. Updated recommendations of the international society of geriatric oncology on prostate cancer management in older patients. Eur J Cancer. 2019;116:116–136.
- Parker C, Castro E, Fizazi K, ESMO Guidelines Committee. Electronic address: [email protected], et al. Prostate cancer: ESMO clinical practice guidelines for diagnosis, treatment and follow-up†. Ann Oncol. 2020;31(9):1119–1134.
- Gillessen S, Attard G, Beer TM, et al. Management of patients with advanced prostate cancer: the report of the advanced prostate cancer consensus conference APCCC 2017. Eur Urol. 2018;73(2):178–211.
- Schulz KF, Altman DG, Moher D, for the CONSORT group CONSORT 2010 statement: Updated guidelines for reporting parallel group randomised trials. BMC Med. 2010;8:18.
- Esper P, Mo F, Chodak G, et al. Measuring quality of life in men with prostate cancer using the functional assessment of cancer therapy-prostate instrument. Urology. 1997;50(6):920–928.
- FACT-P: Functional Assessment of Cancer Therapy – Prostate. For patients with Prostate cancer. [cited 2021. May 15];Available from: https://www.facit.org/measures/FACT-P.
- Yount S, Cella D, Banik D, et al. Brief assessment of priority symptoms in hormone refractory prostate cancer: the FACT advanced prostate symptom index (FAPSI). Health Qual Life Outcomes. 2003;1(1):69.
- FAPSI: Functional Assessment of Cancer Therapy Prostate Cancer Symptom Index - 8 Item Version [cited 2021. Dec 9];Available from: https://www.facit.org/measures/FAPSI.
- Cella DF, Tulsky DS, Gray G, et al. The functional assessment of cancer therapy scale: Development and validation of the general measure. J Clin Oncol. 1993;11(3):570–579.
- Delgado DA, Lambert BS, Boutris N, et al. Validation of digital visual analog scale pain scoring with a traditional paper-based visual analog scale in adults. JAAOS Glob Res Rev. 2018;2(3):e088.
- Fairclough DL, Cella DF. Functional assessment of cancer therapy (FACT-G): non-response to individual questions. Qual Life Res. 1996;5(3):321–329.
- Li G, Taljaard M, Van Den Heuvel ER, et al. An introduction to multiplicity issues in clinical trials: the what, why, when and how. Int J Epidemiol. 2017;46(2):746–755.
- Holm S. A simple sequentially rejective multiple test procedure. Scand J Stat. 1979;6:65–70.
- Cella D, Nichol MB, Eton D, et al. Estimating clinically meaningful changes for the functional assessment of cancer therapy—prostate: Results from a clinical trial of patients with metastatic Hormone-Refractory prostate cancer. Value Health. 2009;12(1):124–129.
- King MT, Cella D, Osoba D, et al. Meta-analysis provides evidence-based interpretation guidelines for the clinical significance of mean differences for the FACT-G, a cancer-specific quality of life questionnaire. Patient Relat Outcome Meas. 2010;1:119–126.
- King MT, Stockler MR, Cella DF, et al. Meta-analysis provides evidence-based effect sizes for a cancer-specific quality-of-life questionnaire, the FACT-G. J Clin Epidemiol. 2010;63(3):270–281.
- Frahm Olsen M, Bjerre E, Hansen MD, et al. Minimum clinically important differences in chronic pain vary considerably by baseline pain and methodological factors: systematic review of empirical studies. J Clin Epidemiol. 2018;101:87–106.e2.
- Thiery-Vuillemin A, Fizazi K, Sartor O, et al. An analysis of health-related quality of life in the phase III PROSELICA and FIRSTANA studies assessing cabazitaxel in patients with metastatic castration-resistant prostate cancer. ESMO Open. 2021;6(2):100089.
- Al-Batran SE, Hozaeel W, Tauchert FK, et al. The impact of docetaxel-related toxicities on health-related quality of life in patients with metastatic cancer (QoliTax). Ann Oncol. 2015;26(6):1244–1248.
- Gelman A, Carlin J. Beyond power calculations: Assessing type S (sign) and type M (magnitude) errors. Perspect Psychol Sci. 2014;9(6):641–651.
- Wang C, Hall CB. Correction of bias from non-random missing longitudinal data using auxiliary information. Stat Med. 2010;29(6):671–679.
- Ibrahim JG, Molenberghs G. Missing data methods in longitudinal studies: a review. Test (Madr). 2009;18(1):1–43.
- Fielding S, Ogbuagu A, Sivasubramaniam S, et al. Reporting and dealing with missing quality of life data in RCTs: has the picture changed in the last decade? Qual Life Res. 2016;25(12):2977–2983.
- Bell ML, Kenward MG, Fairclough DL, et al. Differential dropout and bias in randomised controlled trials: when it matters and when it may not. BMJ. 2013;346(1):e8668–e8668.
- Kumle L, Võ MLH, Draschkow D. Estimating power in (generalized) linear mixed models: an open introduction and tutorial in R. Behav Res Methods. 2021;53:2528–2543.
- Cella D, Ivanescu C, Holmstrom S, et al. Impact of enzalutamide on quality of life in men with metastatic castration-resistant prostate cancer after chemotherapy: additional analyses from the AFFIRM randomized clinical trial. Ann Oncol. 2015;26(1):179–185.
- Altman DG, Royston P. Statistics notes: the cost of dichotomising continuous variables. BMJ. 2006;332(7549):1080.
- Mabikwa OV, Greenwood DC, Baxter PD, et al. Assessing the reporting of categorised quantitative variables in observational epidemiological studies. BMC Health Serv Res. 2017;17(1):201.
- Neve OM, van Benthem PPG, Stiggelbout AM, et al. Response rate of patient reported outcomes: the delivery method matters. BMC Med Res Methodol. 2021;21(1):9.
- Wyrwich KW, Bullinger M, Aaronson N, Clinical Significance Consensus Meeting Group, et al. Estimating clinically significant differences in quality of life outcomes. Qual Life Res. 2005;14(2):285–295.
- Frost MH, Bonomi AE, Ferrans CE, Clinical Significance Consensus Meeting Group, et al. Patient, clinician, and population perspectives on determining the clinical significance of quality-of-Life scores. Mayo Clin Proc. 2002;77(5):488–494.
- Haslam A, Herrera-Perez D, Gill J, et al. Patient experience captured by quality-of-Life measurement in oncology clinical trials. JAMA Netw Open. 2020;3(3):e200363–e200363.
- De Bono JS, Oudard S, Ozguroglu M, et al. Prednisone plus cabazitaxel or mitoxantrone for metastatic castration-resistant prostate cancer progressing after docetaxel treatment: a randomised open-label trial. Lancet. 2010;376(9747):1147–1154.
- Beer TM, Armstrong AJ, Rathkopf D, et al. Enzalutamide in men with chemotherapy-naïve metastatic castration-resistant prostate cancer: Extended analysis of the phase 3 PREVAIL study. Eur Urol. 2017;71(2):151–154.
- Scher HI, Fizazi K, Saad F, et al. Increased survival with enzalutamide in prostate cancer after chemotherapy. N Engl J Med. 2012;367(13):1187–1197.
- Parker C, Nilsson S, Heinrich D, et al. Alpha emitter radium-223 and survival in metastatic prostate cancer. N Engl J Med. 2013;369(3):213–223.
- Sartor O, de Bono J, Chi KN, et al. Lutetium-177–PSMA-617 for metastatic Castration-Resistant prostate cancer. N Engl J Med. 2021;385(12):1091–1103.
- de Bono J, Mateo J, Fizazi K, et al. Olaparib for metastatic Castration-Resistant prostate cancer. N Engl J Med. 2020;382(22):2091–2102.
- National Instititures of Health (NIH). The National Center for Advancing Translational Sciences (NCATS). Inxight Drugs Database. Docetaxel [cited 2022. May 27]; https://drugs.ncats.io/drug/15H5577CQD