
Abstract
Background
Prior biomarker studies have mainly been restricted to advanced RCC patients treated in clinical trials or have had limited integration of immunotherapy features such as programmed death ligand (PD-L)-1 with gene expression signatures intended to capture other canonical pathways to confirm their prognostic value.
Material and methods
PD-L1 and PD-L2 by immunohistochemistry (IHC), PD-L2 messenger RNA (mRNA), and 10 gene expression profile (GEP) signatures targeting immune, angiogenesis and canonical pathways were analyzed in nephrectomy specimens from 227 advanced clear cell RCC (ccRCC) and 42 non-clear cell RCC (nccRCC) patients treated with targeted therapies including VEGF and mTOR inhibitors. Biomarker association with best overall response (BOR), progression-free survival (PFS), and overall survival (OS) were evaluated using multivariable modeling. Except for PD-L1 IHC and angiogenesis, tested with a nominal p-value of .05, multiplicity control was applied with a 0.1 significance level given limited experience in this setting.
Results
The strongest biomarker correlations were observed for hypoxia inducible factor (HIF)-2a and angiogenesis signatures (rho = 0.860 [ccRCC], 0.819 [nccRCC]); hypoxia and glycolysis signatures (rho = 0.943 [ccRCC], 0.973 [nccRCC]); PD-L2 mRNA and T-cell-inflamed GEP signatures (rho = 0.764 [ccRCC], 0.897 [nccRCC]); and PD-L2 mRNA and monocytic myeloid-derived suppressor cell signature (rho = 0.787 [ccRCC], 0.815 [nccRCC]). For ccRCC, higher angiogenesis expression was associated with improved BOR (OR:2.85 [95%CI:1.37, 5.93]), longer PFS (HR:0.61 [95%CI:0.45, 0.82]) and OS (HR:0.74 [95%CI:0.54, 1.00]); higher PD-L1 expression with shorter OS (HR:1.44 [95%CI:1.01, 2.07]). For nccRCC, there was more than a two-fold increased risk with longer OS associated with lower angiogenesis (HR:2.43 [95%CI:1.04, 5.68]), glycolysis (HR:7.03 [95%CI:1.51, 32.76]) and hypoxia (HR:8.83 [95%CI:1.69, 46.05]) gene signature expression.
Conclusion
Data pointed at PD-L1 IHC and angiogenesis expression in ccRCC and hypoxia, glycolysis, and angiogenesis expression in nccRCC as potential prognostic factors. These findings may have implications for the design and interpretation of advanced RCC trials and to identify potential targets for combination therapy strategies.
Introduction
The comprehensive molecular characterization of clear cell renal cell carcinoma (ccRCC) and non-clear cell RCC (nccRCC) by the Cancer Genome Atlas (TCGA) Research Network has revealed the complexity of cancer [Citation1–3]. For ccRCC, genetic changes were underpinned with the identification of 19 significantly mutated genes. Since then, Motzer identified seven molecular subtypes in the IMmotion 151 cohort [Citation4,Citation5] and a 26-gene signature in the JAVELIN Renal 101 cohort with differential outcomes to vascular endothelial growth factor (VEGF) blockade alone or in combination with programmed death-ligand 1 (PD-L1) inhibition [Citation6], and McDermott identified a significant association of an 18 gene T-cell-inflamed gene expression profile (TcellinfGEP) in Keynote 427 with improved response to pembrolizumab monotherapy [Citation7]. Analysis of biomarkers in nccRCC have been limited given the paucity of clinical trials for this disease. Comprehensive molecular characterization of primary papillary RCC revealed two types described by specific gene alterations [Citation2]. An integrated comparative genomic analysis of ccRCC, papillary and chromophobe RCC confirmed a nearly universal upregulation of immune cell gene signatures for ccRCC compared with nccRCC [Citation3]. Although there continues to be advancements in the understanding of disease biology, there is no single predictive biomarker to date that has been approved to select metastatic RCC patients for either immuno-oncology (I-O) or targeted therapies.
Within the past two decades, there has been dramatic progress in the treatment of metastatic RCC (mRCC) including the introduction of drugs targeting the vascular endothelial growth factor (VEGF) receptor(s) and the mammalian/mechanistic target of rapamycin (mTOR). More recently, anti-PD-1/L1 immune checkpoint inhibitors (ICI), as monotherapy or as part of combination regimens, have shown benefit versus targeted therapies for patients with advanced disease, as well as versus placebo in the adjuvant setting [Citation8–13]. Novel HIF-2a inhibitors are also being developed [Citation14–16]. To help optimize treatment strategies, clinical-pathological prognostic factors (e.g., size, grade, presence of necrosis) are recommended for collection in localized RCC during routine clinical practice being integrated into prognostic risk models [Citation17,Citation18]. In patients with mRCC, clinical, biochemical and performance parameters have been integrated in the Memorial Sloan Kettering Cancer Center (MSKCC) and International Metastatic RCC Database Consortium (IMDC) prognostic risk models [Citation19,Citation20]; presence of sarcomatoid differentiation also has strong prognostic impact [Citation21–23]. However, no consistent molecular biomarker has been identified and none has reached routine clinical practice.
There is continued interest in identifying biomarkers that could further optimize treatment strategies, as some RCCs remain resistant to therapy [Citation17]. Initial attention had been focused on PD-L1 given the predictive role for ICI therapy shown in other therapeutic areas such as lung cancer [Citation24,Citation25]. More recently, attention has also been focused on other protein and genetic biomarkers which may improve knowledge of the predictive value of PD-L1. Some data suggest that factors, e.g., VEGF blockade, might enhance the antitumor activity of immune checkpoint blockade, or serve as separate independent predictors of response in metastatic RCC [Citation4–7]. Gene expression profiles that focus on angiogenic and immunologic pathways have seen promising results, and may be predictive of response to VEGF targeting therapies or ICI therapy.
The aim of the current study was to examine the association of PD-L1 expression by immunohistochemistry and RNA gene expression profiles with clinical outcomes for mRCC patients treated in a real-world clinical setting. The study was undertaken as prior biomarker studies have mainly been restricted to metastatic ccRCC patients treated in a clinical trial setting or have had limited integration of immunotherapy features such as PD-L1 with gene expression signatures intended to capture other canonical pathways to confirm their prognostic value. For comparison to ccRCC, data from tumors with nccRCC histology were also included to better reflect clinical practice.
Material and methods
Study design
This was a retrospective observational study of patients with metastatic ccRCC and nccRCC who received first line (1 L) systemic therapy between 2006 and 2017 at Aarhus University Hospital in Denmark. The sample included men and women ≥18 years of age with newly diagnosed or recurrent metastatic disease, defined per TNM staging criteria, available nephrectomy samples for biomarker assessment, and complete biomarker data. Patients were followed from initiation of 1 L therapy until end of the study in 2019. Detailed clinical data were extracted from patient files, supplemented by data from the Danish Pathology Databank and linked mortality data from the Civil Registration System, and combined with disease information and tissue samples from the Danish Pathology Databank. The study protocol was approved by the local ethics committee (reference no. 1-10-72-173-18).
The primary study objective was to examine the prevalence of positive PD-L1 expression by immunohistochemistry (IHC) and association with overall survival (OS). Secondary objectives were to examine 1) the association of PD-L1 by IHC with other clinical outcomes including progression free survival (PFS) and best overall response (BOR) to treatment, 2) the proportion with sarcomatoid differentiation in ccRCC and nccRCC and interaction of PD-L1 by IHC and presence of sarcomatoid differentiation with clinical outcomes, 3) the association of clinical outcomes with other biomarkers of interest including PD-L2 expression by IHC, PD-L2 as a single gene, and 10 prespecified RNA signatures including TcellinfGEP and other non-TcellinfGEP signatures intended to capture canonical pathways (angiogenesis, monocytic and granulocytic myeloid-derived suppressor cells [mMDSC and gMDSC, respectively], stromal/epithelial-mesenchymal transition [EMT]/transforming growth factor-β [TGF-β] [Stroma/EMT/TGF-β], MYC, hypoxia, and glycolysis [Citation26] and hypoxia inducible factor [HIF]-1a and HIF-2a).
Clinical outcomes and biomarker assessments
Real-world BOR to treatment, defined as % complete or partial response, was determined by clinical assessment using available clinical and radiology data, evaluated using RECIST criteria employed in routine clinical practice in Denmark. Progression-free survival was defined as the time from initiation of 1 L therapy to the first documentation of disease progression, or death due to any cause, whichever occurs first. Overall survival was determined using mortality data reported in the national vital statistics registry.
PD-L1 expression was measured by IHC assessment of tissue slides from formalin-fixed, paraffin embedded nephrectomy specimens using the clinical trial version of the PD-L1 immunohistochemistry 22C3 pharmDX assay (Agilent, Santa Clara, CA). Expression of PD-L2 was assessed using the mouse anti-human MSD PD-L2 proprietary antibody (clone MEB123.3G2.038) and EnVision™ FLEX+ System on Dako Link 48 autostainer. Interpretation of IHC staining was performed by pathologist to review the background staining, assessment of positive and negative controls, and distribution and localization of PD-L2 staining in all samples. For gene expression profiling, tumor RNA was extracted and targeted RNA analyses were performed using the commercially available nCounter® PanCancer Immune Profiling panel and second custom panel from Nanostring Technologies. TcellinfGEP score was calculated as the weighted sum of normalized expression value of 18 genes [Citation27]. Nine non–TcellinfGEP canonical signatures were derived from two databases (TCGA, Moffit) using an algorithm that included genes based on their correlation to reference signatures in the literature [Citation26,Citation28]. HIF-1a and HIF-2a co-expression signature was identified by selecting top genes positively correlated with HIF-1a and HIF-2a gene expression, respectively, in TCGA ccRCC samples. There were 36 genes and 30 genes with Spearman correlation to HIF-1a and HIF-2a, respectively, above 0.6 and 0.8 (in TCGA ccRCC samples). Overall, there was a very consistent pattern of genome wide co-expression with RCC between TCGA and Moffitt tumor profiles, though to a lesser extent for HIF-1a than what was observed for HIF-2a signature.
Data analysis
Patients with ccRCC and nccRCC tumors were evaluated as two separate cohorts. Demographic, clinical characteristics and treatment patterns were described using descriptive statistics. Spearman correlation coefficients were used to examine the strength and directional relationship of biomarkers.
For the association with clinical outcomes, the analysis strategy focused on the independent effects of VEGF inhibitors when used as monotherapy, as predominantly used in the current study, and further differentiation from the independent effects of ICIs often used in combination with VEGF inhibitors [Citation4–6]. Nominal and multiplicity-adjusted p-values were evaluated using logistic regression (BOR) and Cox proportional hazards regression (PFS and OS). For each clinical outcome, demographic, clinical, and biomarker variables with a significant association (p < .05) during univariate analysis were included in model development. Models were developed using a stepwise regression with removal of variables from the final model if p-values were >.1. Age and IMDC were forced into multivariable models for biomarkers with a positive independent association with checkpoint inhibitors (PD-L1 and TcellinfGEP) and additionally TcellinfGEP forced into models for all other biomarkers [Citation7,Citation26,Citation27,Citation29,Citation30]. TcellinfGEP captures features of the INF-γ related T-cell inflamed microenvironment, and represents a subset of genes consistently associated with response to pembrolizumab across multiple tumor types [Citation26]. PD-L1 positivity was defined using a combined positive score (CPS)≥1, with CPS defined as the number of PD-L1 positive cells (tumor cells, lymphocytes and macrophages) divided by the total number of tumor cells X 100. Angiogenesis gene signature expression was categorized based on median values to more closely align with biomarker categorization in prior VEGF inhibitor studies and given established association of angiogenesis gene signature with VEGF inhibitor response [Citation31,Citation32]. All other biomarkers were evaluated as continuous variables to enhance power for the analyses given the more limited experience with these biomarkers A post-hoc analysis was also conducted with 1 L treatment additionally forced into all regression models.
Except for PD-L1 and angiogenesis, tested using a nominal p-value and alpha level of .05 for significance, multivariable testing for all other biomarkers were treated as a separate family of tests and adjusted by the Hochberg step-up procedure at one-sided alpha of .10. Given the limited experience with these additional biomarkers in this non-I-O treatment setting and the large number of secondary biomarkers being evaluated, all multivariable tests were treated as one family. There was no imputation of missing data.
A target sample size of 200 ccRCC and 200 ncRCC patients was selected for at least 70–80% power to detect OS hazard ratio (HR)>1.5 (positive PD-L1 CPS association) and HR < 0.65 (negative PD-L1 CPS association).
Data availability
MSD’s data sharing policy, including restrictions, is available at http://engagezone.msd.com/ds_documentation.php. Requests for access to the clinical study data can be submitted through the Engage Zone site or via email to [email protected]. Data will be made available upon reasonable request.
Reporting
The manuscript has been prepared in accordance with the ‘STROBE checklist’ for observational cohort studies (checklist included as Table S3) [Citation33].
Results
These results include the main findings of our analysis of PD-L1 and PD-L2 by IHC, PD-L2 as single gene expression, and 10 gene expression profile signatures targeting immune, angiogenesis and canonical pathways in nephrectomy specimens from ccRCC and nccRCC patients treated with targeted therapies including VEGF and mTOR inhibitors.
Demographic and clinical characteristics
In total, 227 patients with ccRCC and 42 patients with nccRCC with clinical and biomarker data were included in the analysis (). Although the plan was to recruit at least 200 ccRCC and nccRCC histology patients, the nccRCC enrollment target was not met given the much lower prevalence of disease. Overall, most patients (67%) were male with a median age at 1 L treatment of 64.0 years (range: 37, 89). There was no significant difference in IMDC prognostic scores between patients with each histologic subtype, 35% of the overall population was IMDC poor risk. Presence of sarcomatoid differentiation was similar across both ccRCC and nccRCC subgroups. Most patients had more than 2 metastatic sites at baseline, similar across subgroups. Lung and lymph node were common sites of metastasis, with lung being most common in ccRCC and lymph node being most common in nccRCC. A similar percentage of patients with liver or osseous metastasis was observed in each subgroup (). Most patients were treated with VEGF inhibitors in both subgroups with a much lower use of mTOR inhibitors for the treatment of patients with ccRCC than nccRCC (1.3% vs 31.0%, respectively) ().
Table 1. Summary of demographic, clinicopathologic, and 1 L treatment characteristics overall and by RCC histology subtype.
Biomarker prevalence and correlation
For ccRCC and nccRCC, the prevalence of positive PD-L1 expression by IHC (defined as CPS ≥ 1) was 62.6% and 69.0%, respectively; generally higher in patients with adverse pathological features including higher Furhman nuclear grade, sarcomatoid differentiation, necrosis and higher with worse prognostic scores (Table S1). Among ccRCC and nccRCC patients with PD-L1 positive tumors ∼30% had sarcomatoid differentiation, and among those with sarcomatoid differentiation a majority (>80%) had PD-L1 positive tumors (Tables S1, S2).
Table 2. Association of clinical outcomes with PD-L1 by immunohistochemistry and angiogenesis gene signature for patients with clear-cell histology (N = 227) and non-clear cell histology (N = 42) adjusted for age, IMDC, and other significant baseline covariates.
Among the biomarkers assessed, there were significant differences between histology subtypes in biomarker expression levels for most biomarkers with generally higher expression levels in ccRCC than nccRCC; no difference for PD-L1 IHC and PD-L2 IHC between histology subtypes, and borderline association (p = .08) for gMDSC (Table S3). With regards to biomarker correlations, there was remarkable overlap in the associations among immune biomarkers (PD-L1 IHC, PD-L2 IHC, PD-L2 mRNA, TcellinfGEP) and angiogenesis biomarkers (HIF-2a, angiogenesis) for ccRCC and nccRCC (). The strongest biomarker correlations among patients with ccRCC and, separately, nccRCC tumors were observed for HIF-2a and angiogenesis signatures (rho = 0.860 [ccRCC], 0.819 [nccRCC]); hypoxia and glycolysis signatures (rho = 0.943 [ccRCC], 0.973 [nccRCC]); PD-L2 mRNA and TcellinfGEP (rho = 0.764 [ccRCC], 0.897 [nccRCC]); PD-L2 mRNA and mMDSC signature (rho = 0.787 [ccRCC], 0.815 [nccRCC]).
Figure 1. Moderate-strong (rho ≥ 0.4) biomarker correlations. mMDSC: monocytic myeloid derived suppressor cells; gMDSC: granulocytic myeloid derived suppressor cell; PD-L: programmed ligand death; IHC: immunohistochemistry; CPS: combined positive score; mRNA: messenger RNA; HIF: hypoxia inducible factor; TGF-β: transforming growth factor-β; EMT: epithelial-mesenchymal transition; GEP: gene expression profile.
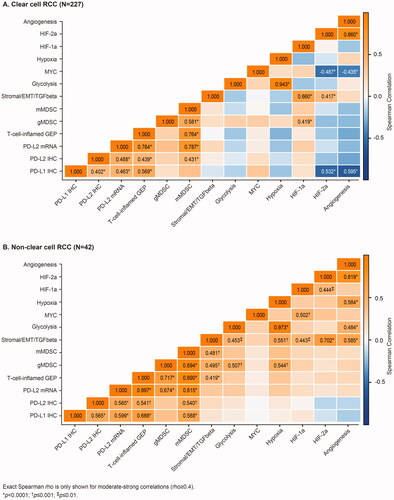
Notable differences include a pattern of negative correlations of immune and angiogenesis biomarkers for ccRCC, but not nccRCC, including inverse correlations of PD-L1 CPS expression with angiogenesis signature (rho = −0.595) or HIF-2a co-expression signature (rho = −0.532); and MYC signature with angiogenesis (rho = −0.435) or HIF-2a co-expression signatures (rho = −0.487). There were also several positive biomarker correlations observed for nccRCC, but not for ccRCC; notably, the correlation of angiogenesis signature with immunosuppressive signatures including hypoxia (rho = 0.584), stromal/EMG/TGFbeta (rho= 0.585), or glycolysis (rho = 0.484).
Clinical outcomes
PD-L1 IHC
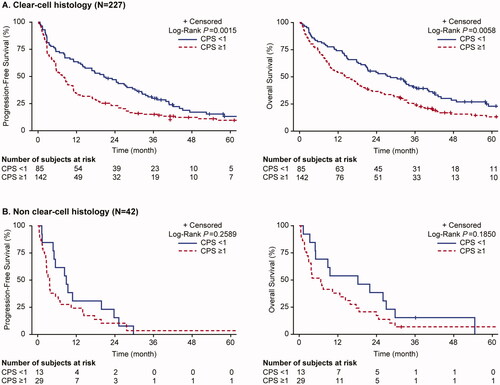
Overall survival was greater for patients with ccRCC than nccRCC tumor histology, with an OS of 18.4 months (95%CI: 14.7, 22.7) and 8.2 months (95%CI: 3.9, 15.4), respectively. For ccRCC, the OS was significantly shorter in patients with PD-L1 positive (CPS ≥1) tumors (14.5 months [95%CI: 9.6, 18.9]) as compared with those with PD-L1 negative (CPS <1) tumors (28.3 months [95%CI: 19.1, 36.4]; adjusted HR 1.44 [95%CI: 1.01, 2.07]) (, ). For nccRCC, the median OS was also shorter in patients with PD-L1 positive tumors (6.7 months [95%CI: 2.8, 14.4]) as compared with those with PD-L1 negative tumors (18.2 months [95%CI: 4.9, 27.0]) but the difference in survival times did not reach statistical significance (log rank, p = .185) (). There was no PD-L1 association with BOR or PFS in either ccRCC or nccRCC subgroups ().
Figure 2. Progression-free survival and overall survival for patients with clear cell RCC and non-clear cell RCC histology, by PD-L1 CPS expression.
Additional analyses were performed to evaluate the impact of PD-L1 expression and presence of sarcomatoid differentiation. Compared with PD-L1 negative tumors without sarcomatoid differentiation, ccRCC histology patients with sarcomatoid differentiation and positive PD-L1 expression had significantly shorter OS (adjusted HR 2.08 [95%CI: 1.31, 3.31]) (, Figure S1). Presence of sarcomatoid differentiation and PD-L1 CPS expression carried the worse OS, different than individual presence of either biomarker. Patients with tumors harboring either one of these two factors had intermediate OS relative to the patients with tumors harboring both or neither sarcomatoid and PD-L1 positivity.
Angiogenesis
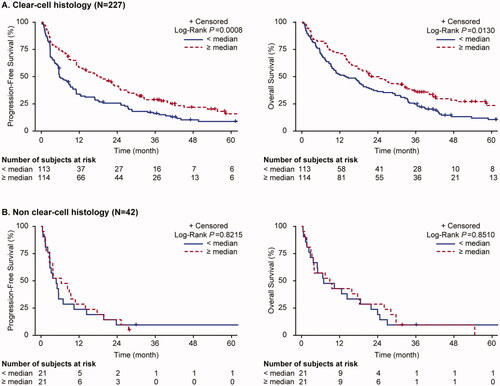
The angiogenesis signature was the only biomarker with a consistent association with clinical outcomes (BOR, PFS, OS) in the ccRCC histology subgroup (). Patients with higher angiogenesis signature scores had significantly greater BOR (32.7% vs 18.3%; adjusted OR: 2.85 [95%CI: 1.37, 5.93]), longer PFS (adjusted HR: 0.61 [95%CI: 0.45, 0.82]) and longer OS (adjusted HR 0.74 [95%CI: 0.54, 1.00]) (, ). For nccRCC, overall survival was significantly shorter for patients with higher angiogenesis gene signature scores (adjusted HR 2.43 [95%CI: 1.04, 5.68]), but no associations were observed for other clinical outcomes ().
Figure 3. Progression-free survival and overall survival for patients with clear cell RCC and non-clear cell RCC histology, by angiogenesis expression.
PD-L2 and other gene signatures
For a few biomarkers, an association with clinical oucomes was observed but did not reach statistical significance based on multiplicity control with pre-specified alpha level of 0.1 (). In ccRCC, there was an association of HIF-2a co-expression signature with improved BOR (adjusted OR: 6.95 [95%CI: 1.57, 30.77]); whereas no association was observed with PFS or OS. For nccRCC, there were associations of higher PD-L2 IHC (adjusted HR: 1.05 (95%CI: 1.00, 1.10), higher HIF-2a co-expression (adjusted HR: 0.71 [95%CI: 0.01, 0.66]), lower glycolysis gene expression (adjusted HR: 7.03 [95%CI: 1.51, 32.76]) and lower hypoxia gene expression (adjusted HR: 8.83 [95%CI: 1.69, 46.05]) scores with longer OS (). For ccRCC and nccRCC, there was no meaningful difference in the statistical significance or strength of association of biomarkers with 1 L treatment forced into the regression models (post-hoc analysis), except that the association of PD-L1 and OS failed to reach significance at pre-specified alpha level for ccRCC (HR: 1.35 [95%CI: 0.93, 1.96]).
Table 3. Association of PD-L2 and gene expression profiles for patients with clear-cell histology (N = 227) and non-clear cell histology (n = 42) adjusted for age, IMDC, TcellinfGEP and other significant baseline covariates.
Discussion
The present study adds to a growing body of evidence related to the underlying tumor biology in patients with advanced RCC. In addition to PD-L1 IHC and angiogenesis gene signature, we also tested the association with clinical outcomes for PD-L2 IHC, PD-L2 mRNA, and 9 additional gene expression signatures targeting immune, angiogenesis, metabolic and stromal pathways. For ccRCC and nccRCC, the prevalence of positive PD-L1 expression by IHC (defined as CPS ≥ 1) was almost identical; among patients with PD-L1 positive tumors ∼30% had sarcomatoid differentiation, and among those with sarcomatoid differentiation the majority (>80%) had PD-L1 positive tumors. In the current analyses, with CPS scored by central pathology review, we confirmed the negative prognostic value of PDL-1 expression in advanced ccRCC patients [Citation34] treated with targeted therapies in a real-world clinical setting, with a trend in advanced nccRCC. Notably, presence of both sarcomatoid differentiation and PD-L1 expression carried the worse OS.
In the current study of patients treated with targeted therapies, predominantly VEGF inhibitors, we observed greater clinical benefit for ccRCC patients with higher angiogenesis signature scores. This finding is consistent with recent studies which have explored the association of gene signatures targeting the same angiogenic and immunologic pathways with clinical outcomes for patient receiving VEGF therapy and anti-PD-1/L1 ICI-VEGF combination therapies. In IMmotion 150, higher angiogenesis gene signature scores were associated with improved treatment response (46% vs 9%, p < .001) and PFS (HR 0.31; 95%CI: 0.18–0.55, p < .001) for predominantly ccRCC patients receiving sunitinib monotherapy [Citation32]. This finding was further supported by the association of high angiogenesis signature expression and improved PFS and OS in the sunitinib treatment arm in IMmotion 151 [Citation4,Citation5] and recent biomarker analysis of the Phase 3 Javelin Renal 101 trial in ccRCC patients (PFS: HR 0.56 [95%CI: 0.42, 0.74], p < .0001) [Citation6]. On the other hand, our study also explored the association of angiogenesis scores with outcomes in nccRCC patients where no ORR or PFS association, but worse OS association, was observed. However, differences in OS association for nccRCC patients compared with ccRCC patients should be cautiously interpreted given the small sample size and heterogeneous population. Yet, it may also provide a biological suggestion for the less effectiveness of antiangiogenic therapies in nccRCC [Citation35–37].
For the analysis of other biomarkers where there is more limited experience in this treatment setting, we applied additional multiplicity control. Here, we found borderline OS associations for nccRCC with negative associations with glycolysis and hypoxia gene expression and positive association with HIF-2a co-expression. These findings warrant further exploration to better understand the potential significance for the treatment of advanced RCC and development of new treatment regimens.
To date, no study has identified a molecular predictive factor for routine clinical use in patients with mRCC, nor did our study. We identified, however, several molecularly based prognostic factors. Together with data generated from other recent studies [Citation4–6,Citation32], a growing body of evidence is emerging; this will form the foundation for future personalized medicine in mRCC. However, different cutoffs and methodologies have been applied in all studies, and direct comparison between studies is not possible. Standardization of methods and cutoffs and larger collaborative efforts may lead to reliable, molecularly based, and clinically meaningful treatment assignments.
When evaluating the correlation among biomarkers, we saw remarkable overlap for patients with ccRCC and nccRCC with positive biomarker associations among immune biomarkers (PD-L1 CPS, PD-L2 CPS, PD-L2 mRNA, and T-cell-inflamed GEP) and among angiogenic biomarkers (angiogenesis, HIF-2a). This might explain the clinical benefit of I-O and VEGF combination therapies in ccRCC patients [Citation8–12,Citation29] and nccRCC patients [Citation30]. There was also a greater number of biomarker correlations observed for nccRCC than for ccRCC; notably, the additional correlation of angiogenesis signature with hypoxia, glycolysis, and stromal/EMG/TGFbeta signatures. Such differences may underscore the heterogeneity of nccRCC and more limited clinical benefit with use of VEGF monotherapy. Notably, we also found generally higher expression levels of angiogenic, immunologic, and metabolic RNA-based biomarkers in ccRCC than in nccRCC patients which may correlate with the degree response for treatments targeting these pathways for patients with different histology subtypes. The distinction between ccRCC and nccRCC has traditionally been conducted based on morphology and immunochemistry markers, but without integrating molecular information. Further research integrating molecular markers is needed in a larger cohort of patients.
This population-based study has several strengths including prospective central laboratory review of tissue samples using validated assays, including consistent use of assays for both the ccRCC and nccRCC assessments, with linkage of data extracted from an established clinical database and supplemented with data from a national pathology register and linked data from national vital statistics registry. Additionally, treatment response and tumor progression were evaluated using RECIST criteria employed in routine clinical practice. To control for confounding, we developed multivariable models and adjusted for demographic, clinical, and biomarker data with a significant association with the clinical outcomes. The analysis and generalizability of findings is limited by the exploratory nature of this study, including potential for residual confounding and small sample size of patients with nccRCC including some patients treated with mTOR inhibitors. Particularly for the nccRCC cohort, lack of biomarker association with clinical outcomes may be due to limited power given small sample size.
In conclusion, this study confirmed prior findings that PD-L1 expression by IHC defined using uniform scoring of CPS by central pathology review was associated with more aggressive pathologic features and negatively associated with overall survival in patients with ccRCC. Additionally, our data for patients treated in a real-world clinical setting with targeted therapies identified favorable outcomes for ccRCC patients with higher angiogenesis gene signature scores, and pointed at expression of hypoxia, glycolysis, gene signatures and HIF-2a co-expression as potential prognostic factors in nccRCC. The considerable overlap and notable differences in biomarker correlations for patients with ccRCC and nccRCC also warrants further investigation. As with a recent molecularly characterization of heightened angiogenesis in glandular metastases in patients with clear cell mRCC translating into better outcomes on VEGFR-TKIs with challenges in selecting patients who might benefit from targeted therapies alone [Citation38], these data may further inform the selection of specific therapies based on tumor biomarkers which may spare toxicity from anti-PD-1/L1 ICI combination therapies, which are the current standard of care for advanced RCC patients.
Supplemental Material
Download MS Word (61.9 KB)Acknowledgements
We would like to acknowledge the important scientific contributions of Maureen Maguire, Michael Nebozhyn, Fansen Kong, Bo Zheng, Jared Lunceford, and Yiwei Zhang (all from Merck & Co. Inc., Rahway, NJ, USA).
Disclosure statement
CA Pinto, R Predoiu, C Fox, M Burcu, and R Perini are employees of Merck Sharp & Dohme LLC, a subsidiary of Merck & Co. Inc., Rahway, NJ, USA (MSD), which funded this study and which develops and manufacturer’s oncologic therapy for the treatment of renal cell carcinoma. K Skaarup was an employee of MSD at the time the study was conducted. F Donskov, T Steiniche, and JB Georgsen are employees of Aarhus University Hospital, which received funding from MSD to conduct this study. There are no non-financial relationships which represent a potential conflict of interest.
Additional information
Funding
References
- Cancer Genome Atlas Research Network. Comprehensive molecular characterization of clear cell renal cell carcinoma. Nature. 2013;499(7456):43–49.
- Linehan WM, Spellman PT, Ricketts CJ, et al. Comprehensive molecular characterization of papillary renal-cell carcinoma. N Engl J Med. 2016;374(2):135–145.
- Ricketts CJ, De Cubas AA, Fan H, et al. The cancer genome atlas comprehensive molecular characterization of renal cell carcinoma. Cell Rep. 2018;23(12):3698.
- Motzer RJ, Banchereau R, Hamidi H, et al. Molecular subsets in renal cancer determine outcome to checkpoint and angiogenesis blockade. Cancer Cell. 2020;38(6):803–817 e4.
- Motzer RJ, Powles T, Atkins MB, et al. Final overall survival and molecular analysis in IMmotion 151, a phase 3 trial comparing atezolizumab plus bevacizumab vs sunitinib in patients with previously untreated metastatic renal cell carcinoma. JAMA Oncol. 2022;8(2):275–280.
- Motzer RJ, Robbins PB, Powles T, et al. Avelumab plus axitinib versus sunitinib in advanced renal cell carcinoma: biomarker analysis of the phase 3 JAVELIN renal 101 trial. Nat Med. 2020;26(11):1733–1741.
- McDermott DF, Lee J-L, Donskov F, et al. Association of gene expression with clinical outcomes in patients with renal cell carcinoma treated with pembrolizumab in KEYNOTE-427. J Clin Oncol. 2020;38(15_suppl):5024.
- Bedke J, Albiges L, Capitanio U, et al. Updated European Association of Urology guidelines on renal cell carcinoma: nivolumab plus cabozantinib joins immune checkpoint inhibition combination therapies for treatment-naive metastatic clear-cell renal cell carcinoma. Eur Urol. 2021;79(3):339–342.
- Rini BI, Plimack ER, Stus V, et al. Pembrolizumab plus axitinib versus sunitinib for advanced renal-cell carcinoma. N Engl J Med. 2019;380(12):1116–1127.
- Choueiri TK, Powles T, Burotto M, et al. Nivolumab plus cabozantinib versus sunitinib for advanced renal-cell carcinoma. N Engl J Med. 2021;384(9):829–841.
- Motzer R, Alekseev B, Rha SY, et al. Lenvatinib plus pembrolizumab or everolimus for advanced renal cell carcinoma. N Engl J Med. 2021;384(14):1289–1300.
- Albiges L, Tannir NM, Burotto M, et al. Nivolumab plus ipilimumab versus sunitinib for first-line treatment of advanced renal cell carcinoma: extended 4-year follow-up of the phase III CheckMate 214 trial. ESMO Open. 2020;5(6):e001079.
- Choueiri TK, Tomczak P, Park SH, et al. Adjuvant pembrolizumab after nephrectomy in renal-cell carcinoma. N Engl J Med. 2021;385(8):683–694.
- Bauer TM, Choueiri TK, Papadopoulos KP, et al. The oral HIF-2 [alpha] inhibitor MK-6482 in patients with advanced clear cell renal cell carcinoma (RCC): updated follow-up of a phase I/II study. J Clin Oncol. 2020;39(6_suppl):611.
- Jonasch E, Donskov F, Iliopoulos O, MK-6482-004 Investigators, et al. Belzutifan for renal cell carcinoma in von Hippel-Lindau disease. N Engl J Med. 2021;385(22):2036–2046.
- Choueiri TK, Albiges L, Fan L, et al. MK-6482, a hypoxia-inducible factor 2[alpha] inhibitor (HIF-2[alpha]), versus everolimus in heavily pretreated, immune checkpoint-inhibitor-resistant, advanced clear cell renal cell carcinoma (ccRCC): phase III study. J Clin Oncol. 2021;39(6_suppl).
- Escudier B, Porta C, Schmidinger M, et al. Renal cell carcinoma: ESMO Clinical Practice Guidelines for diagnosis, treatment and follow-updagger. Ann Oncol. 2019;30(5):706–720.
- Leibovich BC, Blute ML, Cheville JC, et al. Prediction of progression after radical nephrectomy for patients with clear cell renal cell carcinoma: a stratification tool for prospective clinical trials. Cancer. 2003;97(7):1663–1671.
- Heng DY, Xie W, Regan MM, et al. Prognostic factors for overall survival in patients with metastatic renal cell carcinoma treated with vascular endothelial growth factor-targeted agents: results from a large, multicenter study. J Clin Oncol. 2009;27(34):5794–5799.
- Motzer RJ, Mazumdar M, Bacik J, et al. Survival and prognostic stratification of 670 patients with advanced renal cell carcinoma. J Clin Oncol. 1999;17(8):2530–2530.
- Bakouny Z, Braun DA, Shukla SA, et al. Integrative molecular characterization of sarcomatoid and rhabdoid renal cell carcinoma. Nat Commun. 2021;12(1):808.
- Rini BI, Motzer RJ, Powles T, et al. Atezolizumab plus bevacizumab versus sunitinib for patients with untreated metastatic renal cell carcinoma and sarcomatoid features: a prespecified subgroup analysis of the IMmotion151 clinical trial. Eur Urol. 2021;79(5):659–662.
- Tannir NM, Signoretti S, Choueiri TK, et al. Efficacy and safety of nivolumab plus ipilimumab versus sunitinib in first-line treatment of patients with advanced sarcomatoid renal cell carcinoma. Clin Cancer Res. 2021;27(1):78–86.
- Reck M, Rodriguez-Abreu D, Robinson AG, et al. Pembrolizumab versus chemotherapy for PD-L1-positive non-small-cell lung cancer. N Engl J Med. 2016;375(19):1823–1833.
- Topalian SL, Hodi FS, Brahmer JR, et al. Safety, activity, and immune correlates of anti-PD-1 antibody in cancer. N Engl J Med. 2012;366(26):2443–2454.
- Cristescu R, Nebozhyn M, Zhang C, et al. Transcriptomic determinants of response to pembrolizumab monotherapy across solid tumor types. Clin Cancer Res. 2022;28(8):1680–1689.
- Ayers M, Lunceford J, Nebozhyn M, et al. INF-γ-related mRNA profile predicts clinical response to PD-1 blockade. J Clin Invest. 2017;127(8):2930–2940.
- Ayers M, Nebozhyn M, Cristescu R, et al. Molecular profiling of cohorts of tumor samples to guide clinical development of pembrolizumab as monotherapy. Clin Cancer Res. 2019;25(5):1564–1573.
- McDermott DF, Lee JL, Bjarnason GA, et al. Open-label, single-arm phase II study of pembrolizumab monotherapy as first-line therapy in patients with advanced clear cell renal cell carcinoma. J Clin Oncol. 2021;39(9):1020–1028.
- McDermott DF, Lee JL, Ziobro M, et al. Open-label, single-arm, phase II study of pembrolizumab monotherapy as first-line therapy in patients with advanced non-clear cell renal cell carcinoma. J Clin Oncol. 2021;39(9):1029–1039.
- Hakimi AA, Voss MH, Kuo F, et al. Transcriptomic profiling of the tumor microenvironment reveals distinct subgroups of clear cell renal cell cancer: data from a randomized phase III trial. Cancer Discov. 2019;9(4):510–525.
- McDermott DF, Huseni MA, Atkins MB, et al. Clinical activity and molecular correlates of response to atezolizumab alone or in combination with bevacizumab versus sunitinib in renal cell carcinoma. Nat Med. 2018;24(6):749–757.
- von Elm E, Altman DG, Egger M, et al. The strengthening the reporting of observational studies in epidemilogy (STROBE) statement: guidelines for reporting observational studies. J Clin Epidemiol. 2008;61(4):344–349.
- Iacovelli R, Nole F, Verri E, et al. Prognostic role of PD-L1 expression in renal cell carcinoma. A systematic review and meta-analysis. Target Oncol. 2016;11(2):143–148.
- Connor Wells J, Donskov F, Fraccon AP, et al. Characterizing the outcomes of metastatic papillary renal cell carcinoma. Cancer Med. 2017;6(5):902–909.
- Dudani S, de Velasco G, Wells JC, et al. Evaluation of clear cell, papillary, and chromophobe renal cell carcinoma metastasis sites and association with survival. JAMA Netw Open. 2021;4(1):e2021869.
- Overby A, Duval L, Ladekarl M, et al. Carcinoma of unknown primary site (CUP) with metastatic renal-cell carcinoma (mRCC) histologic and immunohistochemical characteristics (CUP-mRCC): results from consecutive patients treated with targeted therapy and review of literature. Clin Genitourin Cancer. 2019;17(1):e32–e37.
- Roussel E, Kinget L, Verbiest A, et al. Molecular underpinnings of glandular tropism in metastatic clear cell renal cell carcinoma: therapeutic implications. Acta Oncol. 2021;60(11):1499–1506.