
Background
Thymidine kinase 1 (TK) is a cytosolic enzyme, a phosphotransferase that plays a pivotal role in DNA synthesis and repair [Citation1]. TK has a key function in the DNA-synthesis and cell division as it is part of the reaction chain to introduce thymidine into the DNA strand [Citation1]. Dividing cells release TK during mitotic exit and TK can thus be detected in the blood and is thus essentially a marker of cell proliferation [Citation2]. Elevated levels of TK activity (TKa) have been found in blood samples from patients with several tumor types, including breast, lung, pancreatic and renal cell cancer, and shown to be associated with the disease stage, prognosis and treatment efficacy [Citation2–9]. Until recently, TKa had not been studied in malignant melanoma, neither had it been studied in patients receiving immune checkpoint inhibitors (ICI). In melanoma, the ICI regimens with CTLA-4 and PD-1 blocking antibodies have proved to be effective in a large portion of patients [Citation10–15]. However, a considerable fraction of patients does not get durable responses to the treatments, that are both expensive and have significant side effects. Thus, biomarkers can contribute with more information on prognosis and the efficacy of these therapies in subgroups of patients. In melanoma, lactate dehydrogenase (LDH) is still the main blood-derived biomarker that is routinely used when monitoring patients in the clinic and included in clinical trials as a biomarker [Citation16]. In a recent paper, we demonstrated that lower pretreatment TKa levels in blood were associated with a less advanced tumor stage, superior treatment response and longer survival in patients with metastatic melanoma receiving ICIs [Citation17]. Here we present the results of TKa analyses from sequential plasma samples from patients with metastatic melanoma with ongoing ICI.
Materials and methods
Patients and plasma samples
Plasma samples were collected from patients with unresectable metastatic cutaneous melanoma, treated with ICI (anti-PD-1 and/or anti-CTLA-4) at the Department of Oncology, Karolinska University Hospital, Stockholm, Sweden in the years 2012–2019 (for patient characteristics, see Supplementary Table S1). Treatments were administrated according to standard ICI regimens and dosage that are approved for the treatment of metastatic melanoma. Blood samples were taken from the patients at three different time points, 1) within five days prior to treatment start, 2) approximately one month after the first course was given (range 2–6 weeks) and 3) at the end of treatment (after median 7 months of treatment, range 1–25 months). The blood samples were collected in EDTA tubes and centrifuged at 1,500 × g for 10 min and separated plasma was centrifuged at 2400 × g for 15 min and frozen at −70 °C within 1 h of processing. The levels of plasma lactate dehydrogenase (LDH) were also collected at corresponding timepoints. The study was conducted in accordance with Good Clinical Practice with informed consent from all patients and was approved by the Stockholm Regional Ethics Committee.
TK activity level analysis
Plasma TKa levels were determined using the DiviTum TKa assay (Biovica, Sweden) in accordance with the manufacturer’s instructions, which has previously been reported [Citation3]. DiviTum TKa is a refined ELISA based assay reflecting cell proliferation rate by measuring TKa in serum, plasma or cells. In summary, plasma was mixed with reaction mixture in a 96-well ELISA, bromodeoxyuridine (BrdU) monophosphate was generated by TK reaction, phosphorylated to BrdU triphosphate and incorporated into a synthetic DNA strand. An anti-BrdU monoclonal antibody conjugated to enzyme alkaline phosphatase and a chromogenic substrate was used to detect BrdU incorporation. The absorbance readings were converted using standards with known TKa values (working range from 20 to 4000 Du/L). Lower limit of detection of the assay was set at 20 Du/L and all values below the threshold were reported as <20 Du/L. All plasma TKa analyses were performed in the Biovica laboratory (Uppsala, Sweden) where the personnel were blinded to patient and tumor data.
Follow-up
Routine follow-up after initiating ICI treatment included monthly clinical and routine lab assessments and also radiological evaluations every third month. Patients were subgrouped depending on TKa levels (above or under 60 Du/L, same cutoff as was defined in our previous study) and LDH levels (above or under 4.0 µkat/L (LDH normal range is 1.8–3.9 µkat/L)), approximately one month into the treatment [Citation17]. Additionally, the patients subgrouped depending on TKa or LDH fold-change from baseline to one month into the treatment, under or above the median fold-change in the whole cohort. Best response to treatment was based on radiological investigations (CT, MRI and/or positron emission (PET) CT tomography) evaluated by a radiologist and assessed according to the Response Evaluation Criteria in Solid Tumors (RECIST) 1.1 criteria [Citation18]. Response rate (RR) was defined as the frequency of patients with partial (PR) or complete responses (CR) as the best response. Progression-free survival (PFS) was defined as the time from treatment start until the date of confirmed progression or date of death or last follow-up. Overall survival (OS) was defined as the time from treatment start until date of death or last follow-up. Duration of response (DoR) was defined as the time to disease progression or death in patients who achieve complete or partial response.
Statistical methods
Median values for TKa and LDH were calculated as well as the interquartile range (IQR) defined as the spread between the 25th and 75th percentiles of the data. Treatment responses were compared with Chi-square test and P values <0.05 were deemed statistically significant. The time to event outcomes for PFS, OS and DoR were analyzed with Kaplan-Meier curves and Cox proportional hazards regression. Median PFS and OS with 95% confidence intervals (CI) were assessed. Hazard ratios (HR) and corresponding two-sided 95% CI were estimated. Statistical analyses were performed with R Version 4.1.1.
Results
TKa and LDH levels at different time points
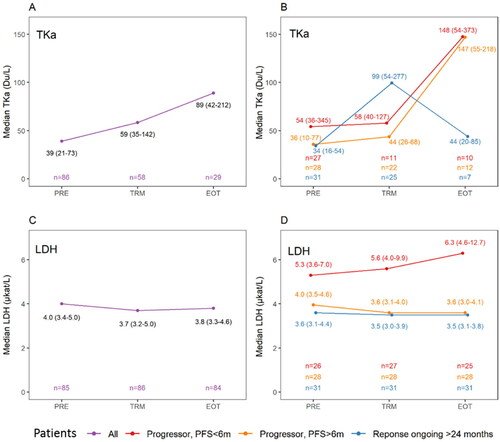
TKa levels were available from 86 patients at baseline (PRE-samples, range <20–1787 Du/L), from 58 of the patients one month into the treatment (TRM-samples, range <20–1966 Du/L) and from 29 at end of treatment (EOT-samples, range <20–1566 Du/L) (). Median TKa and interquartile range (IQR) was 39 Du/L (21–73 Du/L) in the PRE-samples, 59 Du/L (35–142 Du/L) in the TRM-samples and 89 Du/L (42–212 Du/L) in the EOT-samples. Median LDH levels at corresponding time points were 4.0 µkat/L (3.4–5.0 µkat/L), 3.7 (3.2–5.0 µkat/L) and 3.8 (3.3–4.6 µkat/L), respectively (). Hence, approximately one month into the treatment, the median fold change compared to baseline was, for TKa 1.5 (IQR 1.0–3.1-fold change) and for LDH 0.9 (IQR 0.8–1.1-fold change).
Figure 1. Plasma sampling for thymidine kinase activity (TKa) and lactate dehydrogenase (LDH) in association with the immune checkpoint inhibitor treatment in patients with metastatic melanoma, before ICI treatment start (PRE), one month after treatment start (TRM) and at end of treatment (EOT). In B and D, patients are grouped as progressors with progression free survival (PFS) less than six months (graphed in red color), progressors with PFS more than six months, but less than 24 months (graphed in orange color) or not having progressed at 24 months (graphed in blue color). The numbers (n) of sampled patients at each timepoint is demonstrated in the lowest part of each subfigure in same color as the group they represent. A. Median TKa and interquartile range (IQR) in the whole cohort at the three different time points. B. Median TKa (IQR) at the three different time points in the three different response groups. C. Median LDH and IQR in the whole cohort at three different time point. D. Median LDH (IQR) at the three different time points in the three different response groups.
Treatment response and survival depending on TKa and LDH levels after start of ICI
In patients with TKa (TRM-sample) under or over 60 Du/L the RR was 56.7%, and 75.0%, respectively p = 0.147 (Supplementary Table S2). In patients with fold change under or over the median in the TKa TRM-sample compared to the PRE-sample, the RR was 62.1% and 69.0%, respectively, p = 0.551. In patients with LDH (TRM-sample) under or over 4.0 µkat/L, the RR was 68.6%, and 35.3%, respectively p = 0.008 (Supplementary Table S2). In patients with fold change under or over the median in the LDH in the TRM-sample compared to the PRE-sample, the RR was 69.8% and 40.4%, respectively, p = 0.010.
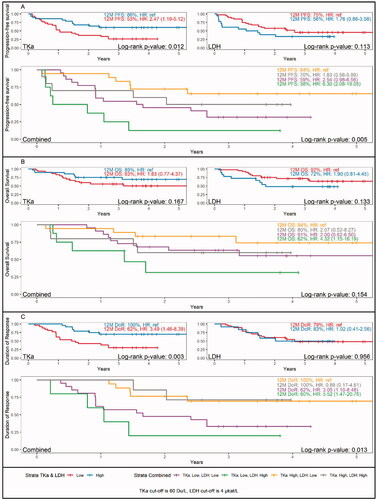
The PFS was significantly shorter in patients with a low TKa (<60 Du/L) in the TRM sample (HR 2.47, 95% CI 1.19–5.12) (). In patients with high LDH (>4 µkat/L) in the TRM sample, the PFS was shorter, but the difference was not significant. Patients with low TKa and high LDH in the TRM sample had the worst PFS, HR 6.30 (95% CI 2.08–19.05), compared to patients with high TKa and low LDH. A similar trend was observed for OS, with the poorest survival among patients with low TKa and high LDH in the treatment sample, HR 4.32 (95% CI 1.15–16.19) (). In the DoR analysis, there was a significant survival benefit in patients with high TKa in the TRM sample (HR 3.49, 95% CI 1.46–8.39), while there were no differences among patients with high or low LDH. Additionally, survival analyses were done for fold change in the TRM sample compared to the PRE sample (Supplementary Figure S1). No significant differences were found in PFS or OS in patients with fold change over or under the median, neither for TKa nor LDH. The DoR was however significantly shorter in patients with a lower fold change in TKa in the TRM vs. PRE samples (HR 3.70 (95% CI 1.54–8.90).
Figure 2. Survival dependent on thymidine kinase activity (TKa) and lactate dehydrogenase (LDH) levels in plasma, one month after start of ICI treatment in patients with metastatic melanoma. Kaplan-Meier survival curves and Hazard ratio (HR) for survival 12 months after treatment start. A. Progression-free survival in patients with low or high TKa (above left), low or high LDH (above right) and combined LDH and TKa (lower panel). B. Overall survival in patients with low or high TKa (above left), low or high LDH (above right) and combined LDH and TKa (lower panel). C. Duration of response in patients with low or high TKa (above left), low or high LDH (above right) and combined LDH and TKa (lower panel).
TKa and LDH trends in different response groups
To visualize trends at the three sampling timepoints for TKa and LDH in relation to treatment efficacy, we divided the cohort in three groups, 1) patients that progressed within six months, 2) patients that progressed after six months of treatment and 3) patients that had not progressed within two years from the treatment start. In patients with a longstanding response there was an initial rise in the median (IQR) TKa level (From 34 (16–54) to 99 (54–277)), with a leveling off in the EOT sample (44 (20–85)) (). In the patients that had progressive disease there was not a similar initial rise in TKa, while a rise was observed in the EOT sample. As for the LDH samples, the patients with progressive disease within six months, had a higher median LDH in the PRE, TRM and EOT samples (). LDH was however compared to TKa, not as dynamic over time with e.g., median LDH in the patients with durable response that were stable at 3.6 to 3.5 at all three time points.
Discussion
The sequential TKa sampling in metastatic melanoma patients on ICI treatment showed that a majority of the patients had an initial rise in the TKa level, seen approximately one month after treatment start. While low pretreatment TKa was associated with a superior treatment efficacy [Citation17], higher TKa levels early after the treatment seem to be beneficial. Higher TKa levels after start of ICI treatment could be related to either TKa release from dying cells or from proliferating immune cells resulting from the ICIs stimulation, or possibly both. A previous study showed that TK levels rose within one week after radical operation for different solid tumors and was associated with postoperative complications, infection and inflammation in the patients [Citation19]. TKa is hence related to an activation of immunological and inflammatory processes, in the absence of macroscopic tumors. Another study demonstrated that in chemotherapy treated metastatic breast cancer, a rise in TKa was seen at one month, while a decline was observed in those treated with endocrine therapy and first at three and six months, a lowering in the TKa was positively associated with survival [Citation20]. The diverse kinetics of TKa in different treatment groups, suggest various modes of impact on TKa in blood. Interestingly, in our study the TKa in the TRM sample was, contrary to LDH, not associated with response rate, while those patients that responded to ICI had a significant survival benefit associated with elevated TKa. Hence, a better DoR in patients with high TKa in the TRM sample (both >60 Du/L and fold change over median) was seen, while such an effect was not seen for LDH. This finding implies that an initial rise in TKa, at least in part reflects an effective stimulation of the immune system. To further address this it would be interesting to assess TKa levels in fully operated melanoma patients receiving adjuvant ICI therapy. Such patients are potentially tumor free or have very low, microscopic tumor burden at treatment start, and the TKa dynamics and treatment outcomes in this setting would help to distinguish the biological mechanism underlying elevated TKa levels in blood.
Our data showed that the melanoma patients sampled when ending treatment due to progression, had an evident rise in TKa. On the other hand, patients ending the treatment after having a sustained response had a lower TKa level at that time point. Of note, due to the set-up of this study, EOT samples were preferably collected from patients that had progressed, which explains a low number of samples from patient with a positive outcome that were sampled at EOT (n = 7). Hence the consistency of the sequential blood samples is a weakness of the study. However, as this is the first study to demonstrate TKa kinetics in the setting of metastatic melanoma and with ICIs, we consider the results to be of interest. Blood TKa levels are apparently affected by melanoma tumors and ICI treatment and TKa also seems to be, compared to LDH, more dynamic over time and could potentially be a valuable marker when monitoring patients under ICI treatment. Collectively, TKa merits further study, in larger cohorts of melanoma patients at different stages and with sampling at multiple time points.
Supplemental Material
Download MS Word (30.5 KB)Supplemental Material
Download MS Word (247.2 KB)Disclosure statement
Mattias Bergqvist is an employee of Biovica. The other authors have no disclosures to make.
Data availability statement
The data that support the findings of this study are available from the corresponding author, upon reasonable request.
Additional information
Funding
References
- Schwartz JL, Tamura Y, Jordan R, et al. Monitoring tumor cell proliferation by targeting DNA synthetic processes with thymidine and thymidine analogs. J Nucl Med. 2003;44(12):2027–2032.
- Bitter EE, Townsend MH, Erickson R, et al. Thymidine kinase 1 through the ages: a comprehensive review. Cell Biosci. 2020;10(1):138.
- Bagegni N, Thomas S, Liu N, et al. Serum thymidine kinase 1 activity as a pharmacodynamic marker of cyclin-dependent kinase 4/6 inhibition in patients with early-stage breast cancer receiving neoadjuvant palbociclib. Breast Cancer Res. 2017;19(1):123.
- McCartney A, Bonechi M, De Luca F, et al. Plasma thymidine kinase activity as a biomarker in patients with luminal metastatic breast cancer treated with palbociclib within the TREnd trial. Clin Cancer Res. 2020;26(9):2131–2139.
- Cabel L, Rosenblum D, Lerebours F, et al. Plasma thymidine kinase 1 activity and outcome of ER + HER2- metastatic breast cancer patients treated with palbociclib and endocrine therapy. Breast Cancer Res. 2020;22(1):98.
- Felix K, Hinz U, Dobiasch S, et al. Preoperative serum thymidine kinase activity as novel monitoring, prognostic, and predictive biomarker in pancreatic cancer. Pancreas. 2018;47(1):72–79.
- McCartney A, Biagioni C, Schiavon G, et al. Prognostic role of serum thymidine kinase 1 activity in patients with hormone receptor-positive metastatic breast cancer: Analysis of the randomised phase III evaluation of faslodex versus exemestane clinical trial (EFECT). Eur J Cancer. 2019;114:55–66.
- Nisman B, Appelbaum L, Yutkin V, et al. Serum thymidine kinase 1 activity Following nephrectomy for renal cell carcinoma and radiofrequency ablation of metastases to lung and liver. Anticancer Res. 2016;36(4):1791–1797.
- Nisman B, Nechushtan H, Biran H, et al. Serum thymidine kinase 1 activity in the prognosis and monitoring of chemotherapy in lung cancer patients: a brief report. J Thorac Oncol. 2014;9(10):1568–1572.
- Hodi FS, O'Day SJ, McDermott DF, et al. Improved survival with ipilimumab in patients with metastatic melanoma. N Engl J Med. 2010;363(8):711–723.
- Robert C, Long GV, Brady B, et al. Nivolumab in previously untreated melanoma without BRAF mutation. N Engl J Med. 2015;372(4):320–330.
- Robert C, Schachter J, Long GV, et al. Pembrolizumab versus ipilimumab in advanced melanoma. N Engl J Med. 2015;372(26):2521–2532.
- Larkin J, Chiarion-Sileni V, Gonzalez R, et al. Combined nivolumab and ipilimumab or monotherapy in untreated melanoma. N Engl J Med. 2015;373(1):23–34.
- Robert C, Karaszewska B, Schachter J, et al. Improved overall survival in melanoma with combined dabrafenib and trametinib. N Engl J Med. 2015;372(1):30–39.
- Dummer R, Ascierto PA, Gogas HJ, et al. Encorafenib plus binimetinib versus vemurafenib or encorafenib in patients with BRAF-mutant melanoma (COLUMBUS): a multicentre, open-label, randomised phase 3 trial. Lancet Oncol. 2018;19(5):603–615.
- Gershenwald JE, Scolyer RA, Hess KR, for members of the American Joint Committee on Cancer Melanoma Expert Panel and the International Melanoma Database and Discovery Platform, et al. Melanoma staging: Evidence-based changes in the American joint committee on cancer eighth edition cancer staging manual. CA Cancer J Clin. 2017;67(6):472–492.
- Costa Svedman F, Jalsenius M, Hoiom V, et al. Plasma thymidine kinase activity as a novel biomarker in metastatic melanoma patients treated with immune checkpoint inhibitors. Cancers (Basel). 2022;14(3):702.
- Eisenhauer EA, Therasse P, Bogaerts J, et al. New response evaluation criteria in solid tumours: revised RECIST guideline (version 1.1). Eur J Cancer. 2009;45(2):228–247.
- Li Z, Wang Y, Ma J, et al. Transient increase in serum thymidine kinase 1 within one week after surgery of patients with carcinoma. Anticancer Res. 2010;30(4):1295–1299.
- Larsson AM, Bendahl PO, Aaltonen K, et al. Serial evaluation of serum thymidine kinase activity is prognostic in women with newly diagnosed metastatic breast cancer. Sci Rep. 2020;10(1):4484.