Abstract
Background
More than 4500 women are diagnosed with breast cancer each year in Denmark, however, despite adequate treatment 10–30% of patients will experience a recurrence. The Danish Breast Cancer Group (DBCG) stores information on breast cancer recurrence but to improve data completeness automated identification of patients with recurrence is needed.
Methods
We included patient data from the DBCG, the National Pathology Database, and the National Patient Registry for patients with an invasive breast cancer diagnosis after 1999. In total, relevant features of 79,483 patients with a definitive surgery were extracted. A machine learning (ML) model was trained, using a simplistic encoding scheme of features, on a development sample covering 5333 patients with known recurrence and three times as many non-recurrent women. The model was validated in a validation sample consisting of 1006 patients with unknown recurrence status.
Results
The ML model identified patients with recurrence with AUC-ROC of 0.93 (95% CI: 0.93–0.94) in the development, and an AUC-ROC of 0.86 (95% CI: 0.83–0.88) in the validation sample.
Conclusion
An off-the-shelf ML model, trained using the simplistic encoding scheme, could identify recurrence patients across multiple national registries. This approach might potentially enable researchers and clinicians to better and faster identify patients with recurrence and reduce manual patient data interpretation.
Keywords:
Introduction
More than 4500 Danish women are diagnosed with breast cancer each year making it one of the most frequent cancers in Denmark [Citation1]. Due to improvements in diagnostics, treatments, and follow-up the survival after a breast cancer diagnosis has significantly improved over the last 20 years [Citation2]. However, recurrence still occurs in 10–30% of patients worldwide despite surgery and adjuvant treatment [Citation3]. Specifically, patients with high lymph node burden, large tumors, and estrogen receptor (ER)-positives are at risk of late recurrence up to 32 years after primary diagnosis [Citation4].
It is crucial to follow patients with recurrent breast cancer over time to optimize treatments, decrease mortality, and to monitor the epidemiology of recurrent breast cancer [Citation5].
The Danish Breast Cancer Group (DBCG) maintains a large clinical database with detailed information on diagnoses, treatments, and outcomes for patients diagnosed with breast cancer [Citation6]. To incorporate information for all patients with recurrence in the clinical database, an automatic identification method is needed, considering the extensive number of breast cancer patients.
Methods for identification of patients will typically rely on use of national health registries of diagnoses or treatments or on manual input of involved clinicians. For other cancer types, identification is easily solvable by simple rule-based coding across national health registries when treatment options are specific to recurrence or when relapses occur close to the primary diagnosis date. This is, however, not the case for breast cancer recurrence.
Valachis et al. demonstrated that identification and characterization of metastatic breast cancer was possible. The authors employed machine learning models on registry data to identify patients with recurrence. However, the data sample was collected from as single regional registry and validated in a sample of 670 patients of whom 70 patients had metastatic disease.
It is a non-trivial task to identify patients with breast cancer recurrence based on information on surgery, pathological findings, and anti-cancer treatments. There is a need for more advanced methods to identify recurrence patients and a need for more extensive validation across clinics and registries, which is the focus of this study.
To identify patients with recurrent breast cancer in Denmark, an algorithm using data from multiple national health registries was created. This study’s main contributions are:
To pool and compile information on recurrent breast cancer patients across multiple national health registries, including information on diagnosis and treatments, into a simplistic data structure.
Apply three off-the-shelf computational models to identify recurrent breast cancer patients using this data structure.
Validate the performance of the superior of the three models in an independent validation sample.
This model should enable clinicians and researchers to retrospectively identify women with recurrent breast cancer in health registries in an automated fashion and allow for follow-up on a national level.
Methods and material
Data sources
In this study, three different data sources were linked to collect patient information: the DBCG clinical database, the Danish National Patient Register (NPR), and the Danish National Pathology Registry (PDB) [Citation6–8].
The DBCG clinical database holds information on all breast cancer patients in Denmark and is valid for large epidemiological studies of breast cancer treatment [Citation9]. Patients with a first-time record of an invasive breast tumor in PDB are included in the DBCG with >95% completeness [Citation10]. Data on demographics, diagnostics, treatment, and follow-up are registered via electronic case report forms. Clinical follow-up of up to 10 years are registered for patients with early breast cancer included in a protocolled treatment program (90% of all patients). Clinical follow-up for recurrence or new malignant disease is collected from the hospital department responsible for the individual patients. A yearly reminder is sent to these departments to make sure clinicians report new patient-specific events [Citation11]. However, the reporting related to recurrence is not uniformly handled across departments resulting in partial or completely missing follow-up. The DBCG clinical database is further updated with information on vital status [Citation12].
The NPR is a Danish register on all hospital discharges, visits, and outpatient treatments. NPR stores partial information on surgical procedures and oncological treatments including infusion dates. Date, hospital, department, disease, and treatment codes on all hospital discharges and outpatient visits for the study cohort were retrieved [Citation7].
PDB is a register with detailed pathological information on all cell and tissue samples in Denmark. Dates, hospitals, departments, pathology codes, and free-text on all benign and malignant cell and tissue samples were retrieved [Citation8].
All data sources were linked using the unique personal identification number (PIN) assigned to all Danish citizens. Data from all registries were extracted September 2019.
Data linking and encoding
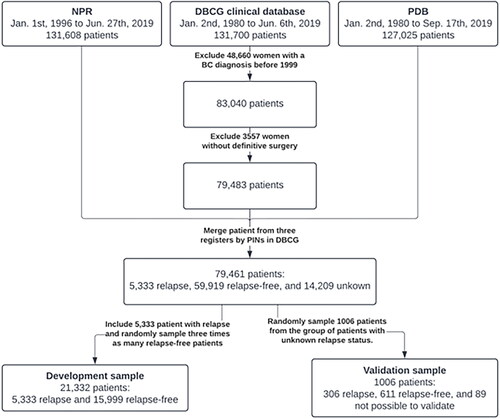
NPR included patient entries until 27 June 2019. PDB contained patient entries until 17 September 2019. We identified patients in the DBCG clinical database from 1 January 1999 to 6 June 2019 which defined the set of patients diagnosed with breast cancer and were used to look up patient-specific events in NPR and PDB. Patients who did not receive a definitive surgery after primary diagnosis, typically patients with primary metastatic breast cancer, were excluded as these patients do not undergo protocolled treatment and follow-up. shows a diagram of the selection process.
Figure 1. Top 15 contributing features of a logistic regression model fitted to the whole development sample. Importance is estimated as the coefficient(weight) divided by the corresponding standard error. NPR: Danish National Patient Register; DBCG: Danish Breast Cancer Group; PDB: Danish National Pathology Registry; BC: breast cancer; PIN: personal identification number.
Data from NPR and PDB are not depended on the last date of follow-up from the DBCG, specifically we do not censor or exclude women at their last follow-up in the DBCG.
In total, 220 different codes, describing patient-specific events, and their corresponding dates were included. These codes were chosen as being clinically relevant when monitoring breast cancer patients and were derived with involved clinicians. From the NPR, 73 codes related to a wide range of treatments (including surgery). From the PDB, 147 codes related to pathology. To distance relapse-related events from events related to the primary cancer, all registrations up to 210 days after the primary diagnosis of breast cancer were excluded from analysis. This exclusion limit was chosen prior to development of the models based on the length a typical breast cancer treatment program.
Finally, each patient was assigned a binary feature vector of length 220, encoding presence (1) or absence (0) of each of the different codes. Consequently, the data structure used to encode patient history was a binary matrix of patient cohort size by 220.
Study samples
In this study, two study samples were collected from a subset of the entire study cohort. Firstly, a development sample which were used for development and fitting of the models, and secondly a blinded validation sample. The development sample was constructed to include all patients with known relapse and three times as many randomly chosen patients known to be relapse-free within the registered clinical follow-up time in DBCG.
The validation sample was constructed as a random sample of patients with unknown relapse-status and yielded 1006 patients in total. These patients differ from the development sample as patients who are completely unknown – despite receiving a definitive surgery – may consist of patients who afterwards do not receive a protocolled treatment. The relapse status of these patients was manually retrieved from the patients’ charts by an external team, with medical background, without knowledge of features of the models. The relapse status of the patients was not known at the time of development of the models.
Prediction models
The task of identifying patients with uncoded relapse was approached as a classification problem in which a model predicts recurrence from the binary feature vector. The posterior probability, provided by the model, of having relapse is referred to as the recurrence score.
Three models were evaluated for predicting relapse: vector magnitude, a logistic regression (LR) model, and a random forest (RF) model. Vector magnitude was measured as the Euclidean norm of each patient’s binary feature vector. The LR and RF models were developed and evaluated in a 10-fold cross-validation scheme stratified by relapse status, using the development sample. The final generalization performance was measured in the validation sample.
The LR and RF models were fitted with NPR and PDB features alone and combined. Likewise, the vector magnitude was measured for the same combinations of NPR and PDB features.
The superior model, in terms of cross-validated classification performance on the development sample, was applied to the validation sample. We further considered two different cutoff points and evaluated sensitivity and specificity of the model in terms of identifying relapse patients.
Statistical analysis
All computational model fitting, statistical analysis, and plotting were conducted in R(v4.1.0). LR models were fitted using the glm function from the stats namespace using the iteratively reweighted least squares method until convergence, which is defined as no significant increase in the log-likelihood between the predictions and true labels. RF models were fitted using the randomForest package ported from Breiman and Cutler’s [Citation13] original implementation of the algorithm with default parameter settings in the R package. About 500 trees are constructed using random bootstrap samples, with replacements, of the input data. Approximately two-thirds of the input data are used to grow the trees and the remaining is used for testing. The area under the receiver operating characteristic curve (AUC-ROC) was measured with the pROC package. The optimal threshold of the ROC is chosen as closest top-left operating point. DeLong’s method was used to obtain 95% confidence intervals (CI) and determining significance difference between two paired AUC-ROCs [Citation14]. Balanced accuracy was calculated as the mean of the sensitivity and specificity. The function varImp from the caret package was used to determine feature importance for both LR and RF models. Potential median follow-up was calculated by Schemper and Smiths’ method [Citation15].
Results
About 83,040 unique breast cancer patients diagnosed after 1999 were identified in the DBCG clinical database. About 3557 patients were excluded as they did not receive definitive surgery. The cohort, defined of merged PINs in NPR, PDB, and the DBCG clinical database, after exclusions, consisted of 79,461 patients of whom 5333 had a known relapse, 59,919 patients were relapse-free patients, and 14,209 patients had an unknown relapse status.
The development sample comprised all 5333 patients with known relapse and 15,999 patients known to be relapse-free within follow-up. The median potential follow-up time for patients in the development sample was 9.4 (95% CI: 9.3–9.5) years. The potential follow-up time in the development sample was expectedly lower than for all women in the DBCG clinical database (14.2 years) as we matched all patients with relapse with three relapse-free patients. Mean age of primary breast cancer diagnosis in the development sample was 60.2 years.
In the validation sample, 1006 patients were randomly sampled from the 14,209 patients with unknown relapse status. Recurrence status for 89 patients could not be retrieved and were therefore excluded. Finally, the validation sample comprised 917 patients of whom 306 had a confirmed recurrence. The median potential follow-up time for patients in the validation sample was 15.7 (95% CI: 14.9–16.6) years. Mean age of primary breast cancer diagnosis in the validation sample was 69.3 years and 8.5% had a prior malignant disease compared to 2.4% for all women in the DBCG database.
shows the full selection process for the development and validation samples.
Cross-validated relapse detection performance in the development sample
The development sample contained 5333 patients with known relapse and 15,999 relapse-free patients.
Segregation performance of the different model is shown in . Using all 220 features, the vector magnitude yields an AUC-ROC of 0.81 (95% CI: 0.81–0.82). Fitting an LR and a RF model using all features yielded an AUC-ROC of 0.92 (95% CI: 0.92–0.93) and 0.93 (95% CI: 0.92–0.93), respectively. The LR and RF model achieved balanced accuracies of 87.0% and 88.1% respectively.
Table 1. Segregation performance for different models across registries measured by AUC-ROC with 95% CI.
Regardless of using NPR features alone, PDB features alone, or combining NPR and PDB the RF model performed better than the LR model (p < 0.01, p < 0.001, and p < 0.001, respectively).
Feature importance
The 15 most important features in an LR model, fitted on the development sample, are shown in . From NPR, features include general cytotoxic treatment, bisphosphonate, breast surgery and radiation therapy, but also more specific treatments such as capecitabine, and fulvestrant.
Figure 2. (a) Top 15 contributing features of a logistic regression model fitted to the whole development sample. Importance is estimated as the coefficient (weight) divided by the corresponding standard error. (b) Top 15 contributing features of a random forest model fitted to the whole development sample. Importance is estimated as increase of mean squared error (RF cost) of predicting when randomly permuting a feature. IDC, invasive ductal carcinoma.
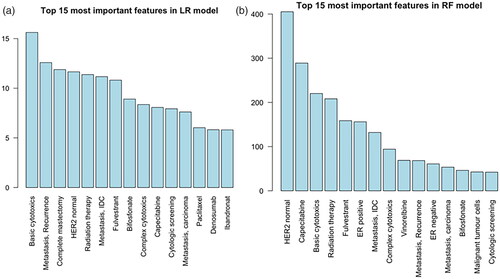
From PDB, important pathological features were included. The event of having a cytologic screening (e.g., pleural effusion sample) or a malignant positive biopsy (invasive ductal carcinoma or carcinoma) contributes to the LR model.
shows the 15 most important features for the RF model. About 11 out of 15 features are shared among the models. No features related to breast surgeries are present in the RF model’s top 15 features.
Using the top 15 most important features of the RF model both the RF and LR model yields an AUC-ROC of 0.90 (0.90–0.91).
Validation sample performance
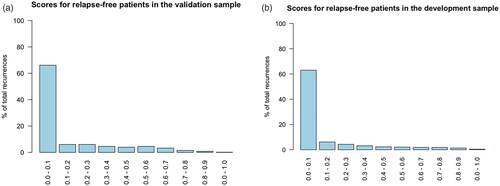
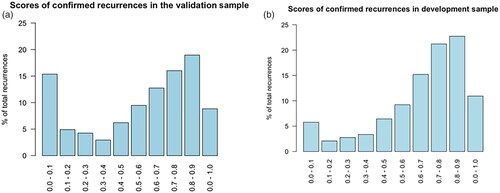
The RF model trained on all 220 features from both NPR and PDB achieved an AUC-ROC 0.86 (95% CI: 0.83–0.88) on the validation sample. shows the score distribution for the confirmed recurrence patients in the validation sample. About 48 (15.7%, 48/306) patients with a confirmed recurrence had a recurrence score of less than 0.1. For comparison, the score distribution for patients with known recurrence in the development sample is shown in , where 320 (6.0%, 320/5333) patients are in the category with a score less than 0.1. The score distribution for relapse-free patients in the validation and development samples are shown in the .
Figure 3. (a) Histogram of the recurrence scores for the confirmed recurrence patients in the validation sample. (b) Histogram of the recurrence scores for the confirmed recurrence patients in the development sample.
The ROC curve of using the recurrence score of the RF model on the validation sample to identify relapse patients can be seen in . The optimal threshold of 0.348 yielded a specificity of 83.5% and a sensitivity of 74.8%. The manually chosen threshold of 0.1 yielded a specificity of 69.7% and a sensitivity of 84.3%. Additional metrics are shown in .
Figure 4. Receiver operating characteristic curve illustrating the diagnostic ability of the RF model in the validation sample. The two highlighted points correspond to the optimal (closest top-left) operating point and the operating point corresponding to choosing a threshold of 0.1. Inside the corresponding parentheses, the specificity and sensitivity are displayed, in that order.
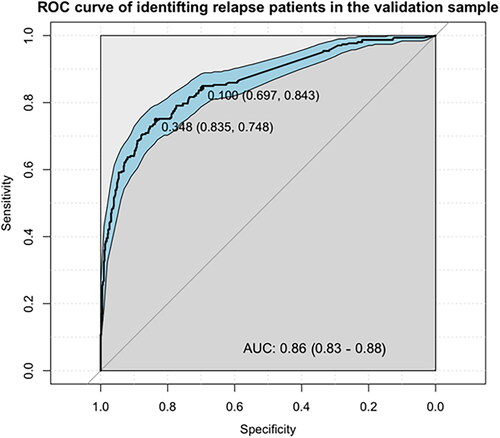
Table 2. Contingency table of relapse status and RF model predictions in the validation sample at the optimal threshold for the recurrence score at 0.348.
Discussion
In this study we have demonstrated a model capable of predicting relapse using data on 79,461 patients previously diagnosed with early breast cancer. A random forest (RF) model achieved an AUC-ROC of 0.93 (95% CI: 0.93–0.94) when separating relapse patients from healthy patients in a 10-fold cross validation scheme. Furthermore, in a manual validation of 917 randomly sampled patients, the RF model yielded an AUC-ROC of 0.86 (95% CI: 0.83–0.88). Choosing a threshold of the recurrence score of 0.348, the RF model correctly identified 74.8% of relapse patients and 83.5% of the healthy patients. However, we have not been able to develop a model with the necessary sensitivity or specificity to substitute true follow-up as we aimed to.
Clinical relevance
The results of this study suggest that patient identification is possible in large data pools such as health record registries with a simplistic encoding scheme and off-the-shelf computational models. This might enable researchers and clinicians to identify patients with specific, but unregistered, endpoints (such as relapse), and thus solve problems otherwise time consuming or deemed practically infeasible. It might also help triaging, by flagging low- and high-risk patients, when clinicians are manually identifying relapse patients.
The used models could assist clinicians in additionally two ways. Firstly, a set of important features, given a downstream task or endpoint, e.g., relapse, can be discovered among a larger group of features without extensive prior knowledge. The models will be able to weigh each feature individually in terms of contribution to correct predictions. This is demonstrated by the high AUC of 0.90 using only the 15 most contributing features. Secondly, with extensive domain-specific knowledge of important features, the model can include a larger set of features to detect relapse patients with high performance.
We initiated the current study believing that we needed both the PDB and NPR to identify patients with relapse, but results showed that either of the two registries perform comparably well but with slightly decreased performance than when combined. In some cases, it might only be possible or feasible to include a single registry. In the case of this study, using only NPR yielded an AUC-ROC of 0.90, which is likely still a clinically usable model. With an initial detection performance using a single registry, evaluation can determine whether performance is adequate or if additional features are needed from other registries.
The RF model’s top 15 variables included several features that are clinically relevant. This covers both chemotherapies as vinorelbine and capecitabine and endocrine therapy as fulvestrant. All of which are primarily used as treatment in the recurrent setting. We also see the general code for basic cytotoxics which means the model can be used even if specific treatments are changed. Additionally, having an assessment of estrogen receptor (ER) or human epidermal growth factor receptor 2 (HER2) code contributes highly to the RF model. This is clinically translatable to the fact that having a new malignant biopsy taken after an initial breast cancer diagnosis is most likely due to a relapse.
An important factor when implementing a recurrence-patient identification model in a clinical/research practice is to contemplate whether it can stand alone or contribute to existing solutions. This decision might be influenced by what is already in place. The DBCG clinical database have a follow-up for the first 10 years after diagnosis, however with some degrees of partial of complete missing follow-up. After 10 years, no follow-up is done. We believe that the model in this situation would be a contribution to the existing solutions for the first 10 years and after which enable detection of late recurrences when follow-up has otherwise ended.
The models and encoding scheme
Results showed that the performance of the RF model was superior to the performance of the LR model regardless of training on NPR codes and PDB codes separately or combined. This suggests that the RF model can capture more meaningful interactions when using higher dimensional training data. Using codes from both NPR and PDB yielded significantly better results than using codes from each register individually.
Simply measuring vector magnitude of the binary vector yielded a relatively high detection performance, although much lower than the LR or RF model. This suggests that the binary encoding scheme could potentially generalize to other identification problems in alike health registries without extensive knowledge about complex interactions between patient-specific events.
Performance difference in the development and validation sample
An evident flaw of the model was that 48 of 306 patients with confirmed relapse had a recurrence score of less than 0.1 in the validation sample. This was also partially expressed in the difference in AUC-ROC as it decreases from 0.93 in the development sample to 0.86 in the validation sample. There might be several reasons for the considerable amount of missed relapse patients.
The patients with unknown relapse-status have clinical features excluding them from protocolled treatment and are known to be at a higher risk of recurrence than patients who are allocated to protocolled treatment.
When clinically evaluating each of the 48 low recurrence score patients several groups of patients form. About 16 patients had primary metastatic breast cancer, which were not marked as such. About 16 patients died within 100 days of their primary diagnosis. For 8 patients, no treatment was administered after relapse. A significant amount of the patients had simple antineoplastic treatment courses. For most of the patients in these groups, no or very few codes were found in either registries. This suggest that there are relapse patients with less features than average due to a short disease course, simple treatments courses, or no treatment at all. This also applies to the development cohort, however the fraction of such patients is overrepresented in the validation sample, as can be seen in . Regardless of the choice of model, relapse patients with a low feature count are difficult to distinguish from healthy patients.
Our model identifies patients with recurrent breast cancer with high performance in terms of AUC-ROC yet still misses some relapse patients. However, in a clinical setting the model might still support existing tools for identifying relapse patients.
Related work
Valachis et al. were able to achieve a balanced accuracy of 94.1% in a validation set using a support vector machine model [Citation15]. The study’s training and validation sets were from the same regional registry and included 282 and 70 patients with metastatic disease, respectively. In our study, balanced accuracies of 88.1% and 79.2% were achieved by the RF model in the development and validation sample, respectively. However, our development sample included 5.333 patients with metastatic disease from 12 different clinics and predictive values were estimated using cross-validation. Our validation sample, which was independent in terms of model development, included 306 patients with metastatic disease. Thus, our samples were considerably larger, not only in the number of cases but also controls, and our models were rigorously validated across multiple sites which might explain the differences in accuracy.
Study limitations
Our study has a limitation caused by the complex interactions between multiple patient registries. Such registries are frequently subject to large changes in terms of how events are coded, and this complicates the data collection and evaluation process. This applies especially when collecting data over several years and across several versions. This study was also limited by population differences between the development and validation samples. Ideally, the sampling process should use the same pool for validation and development
A source of error in fitting the models is caused by the follow-up of patients with relapse-free status and their individual follow-up dates. Despite having a relapse-free status, these patients could experience a relapse after the DBCG follow-up period, and with information from the recurrence being retrieved from NPR and PDB. Thus, a limited number of patients, marked as relapse-free, might have a relapse after follow-up and this would be reflected in their feature vectors. These patients increase the false-negative rate of the model.
Our model is limited by the lack of prediction of site of relapse, both regarding specific organ sites and differentiation between local or distant relapse. Patients are expected to have different survival outcomes depended on site of relapse and this information is necessary for true national follow-up. Furthermore, the model cannot yet predict date of relapse which means that time to event cannot be assessed or used for studies on incidence of relapsed breast cancer.
Future perspectives
Future perspectives include encoding time explicitly for each feature during encoding. In this study, the model is agnostic to when certain events occur except for the 210 days limit. Including time and order of occurrence should improve patient identification and increase explainability of the model’s behavior. The timestamps of registry events are readily available in the three included health registries. Letting the model know when a patient changes relapse status at different timepoints, might further enhance performance and would increase interpretability – e.g., a patient at first being relapse-free during of follow-up and then unknown status afterwards. Encoding time could further allow the model to estimate time from initial diagnosis to recurrence and allow for incidence studies.
To take into account site of relapse a new training set could be constructed with known metastatic sites. This would enable retraining of the model to predict the risk of site-specific metastases.
Additionally, features regarding early death, no treatment, and comorbidities could be included into the model in order to improve classification of patients with relapses within 210 days. A future model should further be able to provide a date or time interval in which the relapse occurred, possible by retrospectively evaluating features and their respective interactions.
Conclusion
This study presented a reproducible method to develop a clinically beneficial model capable of predicting relapse after an initial breast cancer diagnosis. We aggregated data from three different health registries and compiled them, using a simplistic encoding scheme, into a feature vector that was supported by interpretable machine learning models. The model automatically identified patients with high likelihood of having had a relapse in an externally validated data sample. The model identified the patients with an accuracy and reliability sufficient to support and optimize a clinical workflow in which clinicians manually evaluate relapse. However, this model is not yet reliable enough to allow for truly automatic follow-up on breast cancer relapse patients on a national level.
Ethical Approval
This study was approved by the Knowledge Center for Data Review, Capital Region (VD-2019-201).
Disclosure statement
ADL: None
TB: Institutional grants: Pfizer, AstraZeneca, Novartis, Samsung Bieopis, Seattle Genetics, Merck, Eli Lilly and Danish Cancer Society. Personal grants (advisory board/presentation): Merck, Astra Zeneca, Pfizer and Novartis. Personal grants (travel): Daiichi Sankyo
MBJ: meeting expenses from Novartis and Advisory Board Novartis.
ML: None
AK: Personal grants (advisory board/presentation): Novartis, Seagen, Astra Zeneca, Pfizer and Daiichi Sankyo. Personal grants (travel): Astra Zeneca. Investigator or co-investigator in several research projects: Roche, Novartis, Astra Zeneca and Daiichi Sankyo.
Data availability statement
The data supporting the findings of this study are not publicly available due to institutional restrictions. The data can be made available to qualified researchers through application to the Danish Breast Cancer Group.
Additional information
Funding
References
- Engholm G, Ferlay J, Christensen N, et al. NORDCAN – a nordic tool for cancer information, planning, quality control and research. Acta Oncol. 2010;49(5):725–736.
- Jensen MB, Ejlertsen B, Mouridsen HT, et al. Improvements in breast cancer survival between 1995 and 2012 in Denmark: the importance of earlier diagnosis and adjuvant treatment. Acta Oncol. 2016;55(Suppl 2):24–35. 19
- Pan H, Gray R, Braybrooke J, et al. 20-Year risks of breast-cancer recurrence after stopping endocrine therapy at 5 years. N Engl J Med. 2017;377(19):1836–1846.
- Pedersen RN, Esen BÖ, Mellemkjær L, et al. The incidence of breast cancer recurrence 10-32 years after primary diagnosis. J Natl Cancer Inst. 2022;114(3):391–399.
- Caswell-Jin JL, Plevritis SK, Tian L, et al. Change in survival in metastatic breast cancer with treatment advances: meta-analysis and systematic review. JNCI Cancer Spectr. 2018;2(4):pky06.
- Blichert-Toft M, Christiansen P, Mouridsen HT. Danish Breast Cancer Cooperative Group – DBCG: history, organization, and status of scientific achievements at 30-year anniversary. Acta Oncol. 2008;47(4):497–505.
- Lynge E, Sandegaard JL, Rebolj M. The Danish National Patient Register. Scand J Public Health. 2011; 39(7 Suppl):30–33.
- Bjerregaard B, Larsen OB. The Danish Pathology Register. Scand J Public Health. 2011; 39(7 Suppl):72–74.
- Cronin-Fenton DP, Kjærsgaard A, Ahern TP, et al. Validity of Danish Breast Cancer Group (DBCG) registry data used in the predictors of breast cancer recurrence (ProBeCaRe) premenopausal breast cancer cohort study. Acta Oncol. 2017;56(9):1155–1160.
- The Danish Breast Cancer Cooperative Group [Internet]. DBCG Kvalitetsdatabase for Brystkræft – National Årsrapport 2021. Available from: https://www.dbcg.dk/kvalitetsdatabasen/rapporter.
- Christiansen P, Ejlertsen B, Jensen MB, et al. Danish Breast Cancer Cooperative Group. Clin Epidemiol. 2016; 8:445–449.
- Pedersen CB. The Danish Civil Registration System. Scand J Public Health. 2011; 39(7 Suppl):22–25.
- Breiman L. Random forests. Mach Learn. 2001;45(1):5–32.
- DeLong ER, DeLong DM, Clarke-Pearson DL. Comparing the areas under two or more correlated receiver operating characteristic curves: a nonparametric approach. Biometrics. 1988;44(3):837–845.
- Schemper M, Smith TL. A note on quantifying follow-up in studies of failure time. Control Clin Trials. 1996;17(4):343–346.
Appendix
Figure 5. (a) Histogram of the recurrence scores for relapse-free patients in the validation sample. (b) Histogram of the recurrence scores for relapse-free patients in the development sample.