
Background
Desmoid fibromatosis (DF) is a rare tumor that arises from deep soft tissues and is characterized by invasive growth and a tendency for local recurrence [Citation1]. It is a rare tumor representing 0.03% of all neoplasms with an unpredictable behavior [Citation2]. While DF has an excellent overall survival rate, it can range from being symptom-free and spontaneously regressing to persistently recurring and impacting one’s quality of life [Citation3]. Currently, clinical predictors for DF are lacking, which emphasizes the need for biomarkers that can identify patients at risk of progression and allow for earlier intervention in those who would benefit from therapy. The majority of DF cases are sporadic and result from somatic disruptions of Wnt/beta-catenin signaling [Citation4]. In contrast, about 10–15% of DF cases have germline mutations in the adenomatous polyposis coli (APC) gene. APC is a negative regulator of beta-catenin stability, and its loss results in beta-catenin activation [Citation5]. Trauma, particularly antecedent trauma, is also thought to play a role in the pathogenesis of DF. Trauma can cause inflammation and the release of numerous growth factors that may activate clonal DF cells [Citation6].
Wide surgical excision was previously the traditional therapy for DF, but recurrence rates are high, and spontaneous regression occurs in some cases [Citation7]. Therefore, a personalized approach is now preferred [Citation8], with careful observation being a common option [Citation9]. Treatment is offered to patients with significant tumor growth or symptoms [Citation10].
Micro-RNAs (miRNAs) are short sequences that can bind to complementary sequences in genes, leading to their silencing. Dysregulation of miRNA expression has been linked to various malignancies, suggesting their potential use in tumor diagnosis, prognosis, and treatment [Citation11]. Soft tissue sarcomas have diverse miRNA signatures, which can be analyzed to better understand their subtypes [Citation12].
This study aimed to analyze the expression profiles of micro-RNAs in children with DF and determine whether these findings can be used to predict patient outcomes.
Material and methods
This is a retrospective exploratory study approved by an Institutional Review Board (8/2020). Forty pediatric patients (0–18 years) were newly diagnosed. All samples were pathologically confirmed by moderately cellular fibroblastic or myofibroblastic tumor composed of proliferating spindle fibroblastic cells in collagenized matrix with tumor content 40–60% [Citation13] at the Children’s Cancer Hospital Egypt 57357 (CCHE) from January 2007 to December 2016. Patients were categorized into three groups based on their initial treatment approach: upfront surgery without postoperative treatment, metronomic chemotherapy, or a wait-and-see (observation) approach. From 2007 to 2012, upfront surgical excision was the initial treatment approach without post-operative treatment. However, patients who were not suitable for surgery received metronomic chemotherapy [Citation14]. After 2012, a wait-and-see approach was adopted as the initial treatment for clinically asymptomatic patients, with regular imaging to monitor tumor status. Symptomatic patients were initiated on metronomic treatment, and surgery was no longer routinely considered as an initial approach.
Response assessment
Based on POG 9650 study the patient’s response was assessed using magnetic resonance imaging (MRI) or computed tomography (CT) every 12 weeks. As shown in Supplementary Table 2 [Citation14], patients were categorized into two groups: (1) non progressive/non recurrent group which includes (CR/PR/MR/SD); and (2) progressive/recurrent group (PD)
Postoperative assessment was defined as per the American Joint Committee on Cancer (AJCC): R0 - no cancer cells seen microscopically at the primary tumor site/Negative margin: No tumor at the margin. R1 - cancer cells present microscopically at the primary tumor site/Tumor identified microscopically at the margin. R2 - Macroscopic residual tumor at primary cancer site/Macroscopic positive margin: tumor identified grossly at the margin [Citation15].
Sample collection and RNA isolation
Five sections of formalin-fixed paraffin-embedded (FFPE) tissue blocks from each patient’s initial surgical resection or biopsy, with a diameter of 5 mm were taken. Total RNA was extracted using miRNeasy FFBE kit (Qiagen, Germany; Cat. No.: 217504) following the manufacturer’s recommendations. Extracted RNA were assessed using the Qubit RNA HS Assay Kit (Invitrogen, USA; Cat. No.: Q32852).
miRNA library preparation
RNA libraries were generated using NEXTFLEX® Small RNA-Seq Kit (PerkinElmer, USA; Cat.). For each library, Equal volume of purified RNA were taken (700 ng) as an input for library preparation according to the manufacturer’s instructions. Ligated libraries were reverse transcribed and amplified with a unique barcode primer for each one. DNA fragments ∼ 150 bp were determined using 6% TBE-PAGE gel and retrieved in a 300 µl elution buffer for purification. Bioanalyzer DNA assay (Agilent, USA; Cat. No.: 5067-1504) and Qubit dsDNA HS Assay (Thermo Fisher Scientific, USA; Cat. No.: Q33230) were used to assess the size distribution and concentration, respectively. Illumina MiSeq (Illumina, Inc., USA) technology was used to sequence the final pooled miRNA libraries.
Data analysis
Quality of raw reads were investigated using FastQC [Citation15]. Followed by Cutadapt with options [Citation16] set to retain reads limited to 15–28 nucleotides and removing the following adaptor sequence ‘TGGAATTCTCGGGTGCCAAGG’ after removing 4 additional bases from the start and the end of each read as per the manufacturer’s recommendations. Reads quality was checked before and after trimming by FastQC. MultiQC [Citation17] was used to merge FastQC generated reports.
Qualified reads were mapped to the GRCh38 human genome reference from the NCBI database (Accession number GCA_000001405.29) using bowtie [Citation18] with no mismatch option enabled. The mapped reads were quantified using featureCount [Citation19] with ‘miRNA’ as input for the loci option and ‘Name’ for loci name option. A gff file was used for quantification step, containing all human miRNA genomic location information retrieved from the miRBase database [Citation20]. FeatureCount Output generated miRNA count file which was used for differential expression analysis and other statistical analyses.
Differential expression
DESeq2 [Citation21] R package was used to normalize the reads and detect differentially expressed miRNA (DEMs) data which was then compared to the two outcome categories: progressive/recurrent disease (PD) and non-progressive/non recurrent (CR/PR/MR/SD). DEMs were selected to have at least a 1 log2 fold change and adjusted P value (Padj) < 0.05, count data was extracted, and R package DEG report was used to get log2 abundance data then box plots were generated for each DEMs using R package ggplot2 ’[Citation22, Citation23]. miRNA-gene Network was generated by miRNet [Citation24].
Unsupervised hierarchical clustering
As recommended by dufrense et al. [Citation25], unsupervised hierarchical clustering was used to categorize the data into two groups based on the count data using hclust function and ward.D method [Citation26] in R V4.1.2 [Citation27]. Generated groups were used to run DESeq2 and differentially expressed miRNAs were selected using the same criteria as mentioned before (Supplementary Figure 1).
Statistical analysis
Data was collected, coded and then entered into Microsoft Excel 2016 for Windows (Microsoft Office bundle; 2016 of Microsoft Corporation, United States). Data was analyzed using IBM Statistical Package for Social Sciences software (SPSS), 21st edition, IBM, United States. Clinical data was compared across the groups by chi square test. P value <0.05 was considered significant. Event free survival (EFS) was estimated by the Kaplan Meier method and the estimates were compared by log-rank test. An event was defined as progressive disease or recurrence. Time to progression (TTP) was calculated using Kruskal Wallis test among progressive cases only, comparing the time it took them to progress (on average) between chemotherapy, surgery and observation progressive groups.
Results
The study included 40 eligible patients with a median age of 5.18 years and a male to female ratio of 2.3:1 as shown in Supplementary Table 1. Thirty one patients (77%) were under the age of 10 years, and 80% of the whole cohort had tumors larger than 5 cm in size, with the extremities being the most common primary site in 23 patients (58%).
Upfront excision was performed in 14 patients (35%). Nine patients (23%) underwent careful observation while 17 patients (43%) received upfront metronomic chemotherapy.
There was no statistically significant association between the clinical data at presentation (age, gender, anatomical site, initial size and marginal status) with the initial tumor response, as shown in Supplementary Table 1. Response based on the upfront treatment approach within the whole cohort is presented in . Of the 14 patients who received upfront surgery eight (57%) of them experienced PD and this was similar to the PD rate observed for the chemotherapy treated group (9 out of 17 patients or 53%) and was slightly higher than those who underwent careful observation (4 of 9 patients or 44%). None of these differences were considered statistically significant (p = 0.9) although this may in part be due to the small number of patients in the three groups. Among the 23 extremity patients only 3 patients were observed while 8 patients were subjected to upfront surgery as shown in . Overall, approximately half of all pediatric patients with DF had PD (21/40 or 52%) while the remaining patients (19/40 or 48%) had CR/PR/MR/SD. The three years EFS for the whole cohort was 55% as shown in Supplementary Figure 2A. There was no statistically significant association between the clinical data at presentation (age, gender, anatomical site, initial size and marginal status) and event free survival.
Figure 1. (A) patient outcomes according to treatment modality (B) extremity patients outcomes according to treatment modality.
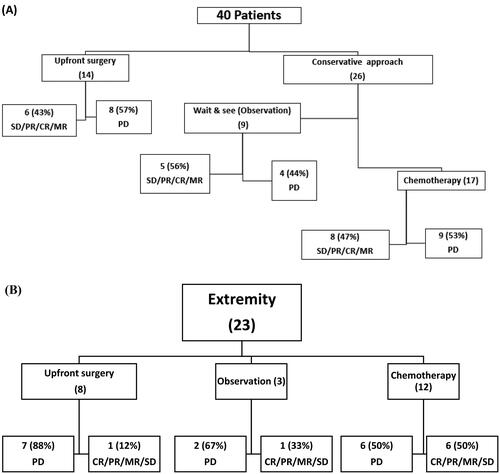
Furthermore, the 3 years EFS was not statistically different between patients according to the treatment modality received whether observation, metronomic chemotherapy or upfront surgery (p = 0.8) (Supplementary Figure 2B).
Median time to progression after initiating treatment for the three groups based on treatment approach was 71.7, 26.9 and 8.7 months for observation group, chemotherapy and upfront surgery respectively, p = 0.002.
Micro-RNA profiling in supervised and Unsupervised analysis
For the supervised analysis, we initially examined differentially expressed miRNAs between the two major clinical groups PD (n = 21) and CR/PR/MR/SD (n = 19). When comparing these two major clinical groups in supervised analysis, differential expression of miRNAs was not identified. As noted in the background section, DF are heterogeneous and raised the possibility that differential expression could be impacted by the site of disease. Subgroup analysis allowed us to separate PD from CR/PR/MR/SD taking into account location and treatment and while reducing the numbers in individual groups provided for a more uniform population on which miRNA differential expression could be identified.
Differential expression was identified between observation group (n = 9) based on initial tumor response, the group was divided into (PD, n = 4) and CR/PR/MR/SD, n = 5). In addition, the extremity group (n = 23) was divided like that (PD, n = 15) and CR/PR/MR/SD, n = 8) and it also showed statistically significant in differentially expressed miRNAs.
To assess the differential expression patterns of miRNA in the three different treatment groups, correlation to patient outcome was undertaken. In the untreated group (observation cohort) of nine patients, 4 of whom progressed, there was a statistically significant downregulation of hsa-miR-378a-5p & hsa-miR-133a-3p, Padj < 0.05 in those with progression as shown in . Similar correlations were not identified in the treated patients (surgery or chemotherapy).
Table 1. Differentially expressed miRNAs among unsupervised analysis (G1 and G2) and among supervised analysis (observation and extremity groups).
Extremity site was the initial tumor site for 23 patients, 15 (65%) of whom experienced disease progression. Among those patients, differential expression was assessed and demonstrated downregulated hsa-miR-378a-3p, hsa-miR-1-3p and hsa-miR-451a, Padj < 0.05 in those who experienced progression as shown in . Additionally, as shown in , the box plot represents the actual expression level for the five recommended differentially expressed miRNAs.
Figure 2. Box plot for the actual expression level for the five recommended miRNAs.
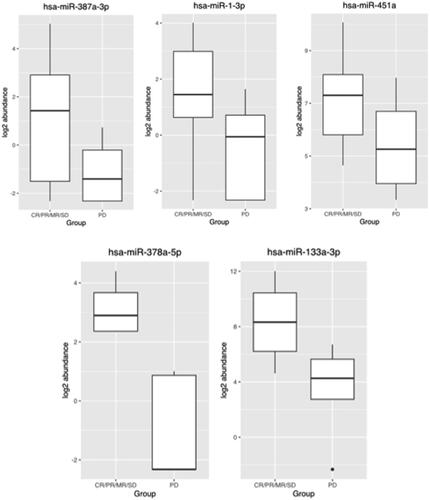
These 5 differentially expressed miRNAs between the observation and extremity group included those to known to regulate multiple critical genes including MAPK1, AGO1, VEGFA, SP1, AKT1, MXD4, FNDC3B, ACTB, TMEM, and SERPINH1 genes (Supplementary Figure 4).
Unsupervised hierarchical clustering identified two major groups in patients with DF based on count data from the miRNA analysis (Supplementary Figure 3). The differential expression between the two groups G1 and G2 revealed that 7 miRNAs (5 up-regulated and 2 down-regulated) had significant differential expression with Padj < 0.05 (). These groups however did not correlate with the clinical features at presentation (Supplementary Table 3 and Supplementary Figure 2C).
Discussion
Treating pediatric desmoid fibromatosis (DF) is challenging due to its unpredictable nature and potential severe morbidity associated with aggressive surgery and radiotherapy. A wait and see approach has become an acceptable option [Citation6]. Clinical predictors of prognosis for DF are highly variable, and attempts to identify variables that might support conservative treatment such as younger age, small tumor size, and abdominal location are still in question [Citation28]. Analysis of the different presenting clinical features and disease behavior, in our study, showed no correlation with patient age, tumor site, initial tumor size nor marginal status with regard to progression or recurrence. In DF marginal status following upfront surgery had no impact on EFS for those who were subjected to upfront surgery in a recent French study [Citation7]. In our cohort, The rate of tumor recurrence was higher among those with negative margins (67%) than those who had positive margin (25%), although the reason for this difference is unknown and consistent with mixed results of previous studies [Citation3,Citation28]. A wait and see approach is currently encouraged as an upfront treatment for newly diagnosed asymptomatic patients or those with mild symptoms of DF, to understand its natural behavior and tailor next treatment steps. Switching from observation to another treatment should be based on radiological progression from at least three consecutive scans [Citation1]. A prior study compared upfront surgery versus observation for DF between 2000 and 2018 and found that the three-year event-free survival (EFS) for the surgery group was 78.3%, while it was 70.4% (8/27) for the observation group. However, the difference in EFS between the two groups was not statistically significant [Citation29]. These results mirror our results where the three years EFS was 65%, 56% and 43% for patients who received upfront chemotherapy, observation and upfront surgery respectively (p = 0.8). In particular, the EFS of the observation only patients of 56% suggests aggressive surgery and chemotherapy can be avoided in a significant percentage of patients.
In our cohort, the most common tumor site was the extremity (n = 23). Although 15 patients in this group (65%) had PD, there was no statistical correlation with EFS. It remains uncertain whether anatomical location has a predictive impact or not although extremities have been reported to have worse prognosis in some series [Citation30].
Spontaneous regressions is still an unanswered question. Two candidate genes were identified to be up upregulated (FECH and STOML2) in the recurrence group while TRIP6 was upregulated in the group that did not show evidence of progression [Citation31]. Targeting the Wnt/β-catenin pathway and notch pathway may be a potential therapy for managing DF once targeted and safe inhibitors of these pathways are available [Citation5].
Our study was undertaken to try and identify miRNA expression patterns that might predict the clinical behavior of DF tumors in children. In unsupervised analysis (G1 and G2), 7 miRNAs were identified including five up-regulated miRNAs and 2 down-regulated miRNAs with adjusted p-value less than 0.05. The reason for the differential expression of these miRNA in different DF tumors is unknown and did not correlate with the initial data at presentation (age at presentation, sex, tumor location and tumor size). EFS was 53% and 57% for G1 and G2 respectively (p = 0.5).
In a sample of 115 patients with DF, a significant correlation between gene expression signature composed of 36 genes by cDNA microarrays and progression-free survival (PFS) was identified [Citation31]. Furthermore, in a group of 15 patients with DF treated with Imatinib, overexpression of particular miRNAs was linked to significantly varying times to recurrence [Citation25].
Nineteen of 2,080 miRNAs identified by microarray analysis have been shown to be differentially expressed in Familial Adenomatous Polyposis associated DT compared to sporadic DT [Citation32]. Specifically, 17 miRNAs were down-regulated and 2 miRNAs were up-regulated. Down-regulation of the miR-133b showed the largest fold change (approximately 20-fold) in FAP derived DT compared to sporadic DT. RT-qPCR analysis confirmed the low levels of miR-133b in FAP-derived compared to sporadic DTs.
Among our nine untreated patients who had observation only, differential expression was identified between those with progressive disease (5 patients) compared to those without (4 patients). There was a statistically significant downregulation of miR-378a-5p & hsa-miR-133a-3p, Padj < 0.05 in those with progression. These miRNAs are known to be associated with critical signaling pathways in development, apoptosis and cellular proliferation. In our cohort these 2 differentially expressed miRNAs are known to impact SP1, TMEM, and SERPINH1 genes. SP1 gene suppression has been shown targets tumor initiating cells in sarcomas [Citation33]. Furthermore, TMEM proteins may be considered as tumor suppressors or oncogenes and play a role in tumor invasiveness and resistance to chemotherapy [Citation34]. Wang et al. [Citation35] demonstrated that the SERPINH1gene is an important prognostic biomarker in cancer patients. Hsa-miR-378a-5p targets the SMAD2, APC, RAF1, BCL2, JUN, PIK3R3, CCND1, MSH6, MSH2, PIK3R1, RALGDS, MAPK1 genes [Citation36]. Furthermore, hsa-miR-133a-3p downregulation has been identified in the development of oral cancers and is associated with worse prognosis [Citation37].
Extremity site was the initial tumor location for 23 patients, 15 (65%) of whom experienced disease progression. Among those patients, differential expression was assessed and demonstrated downregulated hsa-miR-378a-3p, hsa-miR-1-3p and hsa-miR-451a, Padj < 0.05 in those who experienced progression. These 3 differentially expressed miRNAs among the extremity group target MAPK1, AGO1, VEGFA, AKT1, MXD4, FNDC3B, and ACTB genes. AKT1 gene mutations play a role in oncogenesis in sarcoma [Citation32]. Recently MAPK1 gene function is one of the core targets for treatment of soft tissue sarcoma [Citation33]. PTBP1 has a major role in the pathogenesis of sarcomas and may have promising prognostic value and act as a therapeutic target [Citation34]. The RCC2 gene has a role in apoptosis and may be a beneficial marker for predicting the response to chemotherapy [Citation35]. In sporadic DF patients alterations of B-catenin and VEGF overexpression has a major role in their progression [Citation36]. miR-1-3p has been previously reported to be significantly downregulated in hepatocellular carcinoma cell lines [Citation37] while miR-451a can act as a potential tumor suppressors in gastric cancer through regulation of the PI3K/AKT/mTOR pathway [Citation38–44]. The convergence of the different miRNAs identified in this patient population to their role in other cancers suggest that additional studies are warranted to better understand their potential role in the unpredictable behavior of DF tumors.
The main limitation of this retrospective study is the small number of cases, which is expected due to the rarity of pediatric DF. Lack of overlap in miRNA profiles related to outcome in the overall observational cohort and the extremity subgroup may be due to the impact of the microenvironment or small numbers of observational patients. Therefore, an expanded multi-institutional analysis of samples with an appropriate sample size is needed, and multicenter or consortium-based studies will be necessary to validate these results in a larger cohort of patients prospectively.
Conclusion
The study highlights the challenges in predicting DF outcome. Five miRNAs, were explored miR-378a-5p, miR- 37a-5p, miR-1-3p and miR-451a and hsa-miR-133a-3p, these miRNAs may have potential value in predicting DF behavior. However, a larger independent analysis of retrospective samples from other institutions and a prospective clinical trial will be necessary to validate these findings.
Institutional review board statement
This Study was approved by the Scientific Advisory Committee (SMAC) and the institutional review board (IRB) approved the study.
Supplemental Material
Download MS Word (382.9 KB)Supplemental Material
Download MS Word (34.9 KB)Disclosure statement
No potential conflict of interest was reported by the author(s).
Data availability statement
Data used to support the findings of this study are available from the corresponding author upon request.
Correction Statement
This article has been corrected with minor changes. These changes do not impact the academic content of the article.
Additional information
Funding
References
- Kasper B, Baumgarten C, Garcia J, et al. An update on the management of sporadic desmoid-type fibromatosis: a European consensus initiative between sarcoma PAtients EuroNet (SPAEN) and European organization for research and treatment of cancer (EORTC)/soft tissue and bone sarcoma group (STBSG). Ann Oncol. 2017;28(10):2399–2408. doi: 10.1093/annonc/mdx323.
- Hawkins MM, Lancashire ER, Winter DL, et al. The british childhood cancer survivor study: objectives, methods, population structure, response rates and initial descriptive information. Pediatr Blood Cancer. 2008;50(5):1018–1025. doi: 10.1002/pbc.21335.
- Martínez Trufero J, Pajares Bernad I, Torres Ramón I, et al. Desmoid-Type fibromatosis: who, when, and how to treat. Curr Treat Options Oncol. 2017;18(5):29. doi: 10.1007/s11864-017-0474-0.
- Al-Jazrawe M, Au M, Alman B. Optimal therapy for desmoid tumors: current options and challenges for the future. Expert Rev Anticancer Ther. 2015;15(12):1443–1458. doi: 10.1586/14737140.2015.1096203.
- Ganeshan D, Amini B, Nikolaidis P, et al. Current update on desmoid fibromatosis. J Comput Assist Tomogr. 2019;43(1):29–38. doi: 10.1097/RCT.0000000000000790.
- Skubitz KM. Biology and treatment of aggressive fibromatosis or desmoid tumor. Mayo Clin Proc. 2017;92(6):947–964. doi: 10.1016/j.mayocp.2017.02.012.
- Penel N, Le Cesne A, Bonvalot S, et al. Surgical versus non-surgical approach in primary desmoid-type fibromatosis patients: a nationwide prospective cohort from the french sarcoma group. Eur J Cancer. 2017;83:125–131. doi: 10.1016/j.ejca.2017.06.017.
- Kasper B, Gruenwald V, Reichardt P, et al. Correlation of CTNNB1 mutation status with progression arrest rate in RECIST progressive Desmoid-Type fibromatosis treated with imatinib: translational research results from a phase 2 study of the german interdisciplinary sarcoma group (GISG-01). Ann Surg Oncol. 2016;23(6):1924–1927. doi: 10.1245/s10434-016-5132-4.
- Nishida Y, Kawai A, Toguchida J, et al. Clinical features and treatment outcome of desmoid-type fibromatosis: based on a bone and soft tissue tumor registry in Japan. Int J Clin Oncol. 2019;24(11):1498–1505. doi: 10.1007/s10147-019-01512-z.
- Von Mehren M, Randall L, Benjamin R, et al. Soft tissue sarcoma, version 2.2014: featured updates to the NCCN guidelines. J Natl Compr Canc Netw. 2014;12(4):473–483. doi: 10.6004/jnccn.2014.0053.
- Kunder R, Jalali R, Sridhar E, et al. Real-time PCR assay based on the differential expression of microRNAs and protein-coding genes for molecular classification of formalinfixed paraffin embedded medulloblastomas. Neuro Oncol. 2013;15(12):1644–1651. doi: 10.1093/neuonc/not123.
- Gulino R, Forte S, Parenti R, et al. MicroRNA and pediatric tumors: future perspectives. Acta Histochem. 2015;117(4-5):339–354. doi: 10.1016/j.acthis.2015.02.007.
- Sbaraglia M, Bellan E, Dei Tos AP. The 2020 WHO classification of soft tissue tumours: news and perspectives. Pathologica. 2021;113(2):70–84. doi: 10.32074/1591-951X-213.
- Skapek SX, Ferguson WS, Granowetter L, et al. Vinblastine and methotrexate for desmoid fibromatosis in children: results of a pediatric oncology group phase II trial. J Clin Oncol. 2007;25(5):501–506. doi: 10.1200/JCO.2006.08.2966.
- Stephen BD, Byrd D. AJCC. 7th ed. Cancer Staging Manual. New York: Springer; 2015.
- Andrews S. FastQC: a quality control tool for high throughput sequence data. 2019. http://www.bioinformatics.babraham.ac.uk/projects/fastqc/.
- Martin M. Cutadapt removes adapter sequences from high-throughput sequencing reads. EMBnet J. 2011;17(1):10. doi: 10.14806/ej.17.1.200.
- Ewels P, Magnusson M, Lundin S, et al. MultiQC: summarize analysis results for multiple tools and samples in a single report. Bioinformatics. 2016;32(19):3047–3048. doi: 10.1093/bioinformatics/btw354.
- Langmead B, Trapnell C, Pop M, et al. Ultrafast and memory-efficient alignment of short DNA sequences to the human genome. Genome Biol. 2009;10(3):R25. doi: 10.1186/gb-2009-10-3-r25.
- Liao Y, Smyth GK, Shi W. FeatureCounts: an efficient general purpose program for assigning sequence reads to genomic features. Bioinformatics. 2014;30(7):923–930. doi: 10.1093/bioinformatics/btt656.
- Kozomara A, Birgaoanu M, Griffiths-Jones S. MiRBase: from microRNA sequences to function. Nucleic Acids Res. 2019;47(D1):D155–D162. doi: 10.1093/nar/gky1141.
- Love MI, Huber W, Anders S. Moderated estimation of fold change and dispersion for RNA-seq data with DESeq2. Genome Biol. 2014;15(12):550. doi: 10.1186/s13059-014-0550-8.
- Piper M, Kirchner R. Package ‘DEGreport‘. 2023.
- Create T, Data E. Using V, Description G. Package ‘ggplot2.’ 2023.
- Chang L, Zhou G, Soufan O, et al. miRNet 2.0: network-based visual analytics for miRNA functional analysis and systems biology. Nucleic Acids Res. 2020;48(W1):W244–W251. doi: 10.1093/nar/gkaa467.
- Dufresne A, Paturel M, Alberti L, et al. Prediction of desmoid tumor progression using miRNA expression profiling. Cancer Sci. 2015;106(5):650–655. doi: 10.1111/cas.12640.
- Doudney CO, Rinaldi CN. Modification of UV-induced mutation frequency and cell survival of Escherichia coli B/r WP2 trp E65 by treatment before irradiation. J Bacteriol. 1984;160(1):233–238. doi: 10.1128/jb.160.1.233-238.1984.
- Andy Bunn MK. A language and environment for statistical computing. R Foundation for Statistical Computing; 2017. http://www.gnu.org/copyleft/gpl.html.%0Ahttp://www.r-project.org/%0Ahttp://www.r-project.org.
- Salas S, Dufresne A, Bui B, et al. Prognostic factors influencing progression-free survival determined from a series of sporadic desmoid tumors: a wait-and-see policy according to tumor presentation. J Clin Oncol. 2011;29(26):3553–3558. doi: 10.1200/JCO.2010.33.5489.
- Ruspi L, Cananzi FCM, Sicoli F, et al. Event-free survival in Desmoid-Type fibromatosis (DTF): a pre-post comparison of upfront surgery versus wait-and-see approach. Eur J Surg Oncol. 2021;47(5):1196–1200. doi: 10.1016/j.ejso.2020.08.009.
- Salas S, Brulard C, Terrier P, et al. Gene expression profiling of desmoid tumors by cDNA microarrays and correlation with progression-free survival. Clin Cancer Res. 2015;21(18):4194–4200. doi: 10.1158/1078-0432.CCR-14-2910.
- Rotelli MT, Refolo MG, Lippolis C, et al. The role of miRNA-133b and its target gene SIRT1 in FAP-derived desmoid tumor. Oncotarget. 2020;11(26):2484–2492. doi: 10.18632/oncotarget.27622.
- Tornin J, Martinez-Cruzado L, Santos L, et al. Inhibition of SP1 by the mithramycin analog EC-8042 efficiently targets tumor initiating cells in sarcoma. Oncotarget. 2016;7(21):30935–30950. doi: 10.18632/oncotarget.8817.
- Schmit K, Michiels C. TMEM proteins in cancer: a review. Front Pharmacol. 2018;9:1345. doi: 10.3389/fphar.2018.01345.
- Wang Y, Gu W, Wen W, et al. SERPINH1 is a potential prognostic biomarker and correlated with immune infiltration: a Pan-Cancer analysis. Front Genet. 2021;12:756094. doi: 10.3389/fgene.2021.756094.
- Gungormez C, Gumushan Aktas H, Dilsiz N, et al. Novel miRNAs as potential biomarkers in stage II Colon cancer: microarray analysis. Mol Biol Rep. 2019;46(4):4175–4183. doi: 10.1007/s11033-019-04868-7.
- Crimi S, Falzone L, Gattuso G, et al. Droplet digital pcr analysis of liquid biopsy samples unveils the diagnostic role of hsa-mir-133a-3p and hsa-mir-375-3p in oral cancer. Biology (Basel). 2020;9(11):1–14. doi: 10.3390/biology9110379.
- Je EM, An CH, Yoo NJ, et al. Mutational analysis of PIK3CA, JAK2, BRAF, FOXL2, IDH1, AKT1 and EZH2 oncogenes in sarcomas. APMIS. 2012;120(8):635–639. doi: 10.1111/j.1600-0463.2012.02878.x.
- Zhai Y, Jiang S, Li B, et al. Potential mechanisms of yanghe decoction in the treatment of soft tissue sarcoma and arteriosclerosis obliterans based on network pharmacology. Chinese Med Nat Prod. 2022;02(02):e77–e88. doi: 10.1055/s-0042-1755401.
- Gong H, Jiang A, Jiang R, et al. PTBP1 as a promising predictor of poor prognosis by regulating cell proliferation, immunosuppression, and drug sensitivity in SARC. Oxid Med Cell Longev. 2022;2022:5687238. doi: 10.1155/2022/5687238.
- Wu N, Ren D, Li S, et al. RCC2 over-expression in tumor cells alters apoptosis and drug sensitivity by regulating Rac1 activation. BMC Cancer. 2018;18(1):67. doi: 10.1186/s12885-017-3908-y.
- Claesson-Welsh L, Welsh M. VEGFA and tumour angiogenesis. J Intern Med. 2013;273(2):114–127. doi: 10.1111/joim.12019.
- Zhang H, Zhang Z, Gao L, et al. miR-1-3p suppresses proliferation of hepatocellular carcinoma through targeting SOX9. Onco Targets Ther. 2019;12:2149–2157. doi: 10.2147/OTT.S197326.
- Riquelme I, Tapia O, Leal P, et al. miR-101-2, miR-125b-2 and miR-451a act as potential tumor suppressors in gastric cancer through regulation of the PI3K/AKT/mTOR pathway. Cell Oncol (Dordr). 2016;39(1):23–33. doi: 10.1007/s13402-015-0247-3.