
Abstract
Purpose
This study aims to evaluate different methods for calibrating EBT-XD films to develop a precise pre-treatment verification method for stereotactic radiotherapy (SRT) patients using the HyperArc (HA, Varian Medical System) technique.
Methods
Gafchromic EBT-XD films were calibrated using three different approaches: manual calibration, EDW calibration, and PDD calibration. Films were digitalized with an Epson V850 Pro scanner applying the local scanning protocol. Three clinical treatment plans were selected for evaluation. Patient-specific QA films were irradiated in the Mobius MVP phantom and the STEEV phantom. Scanned film images were converted into dose images using the calibration curves. Gamma analysis was performed to compare film dose and TPS calculated dose with various criteria.
Results
The scan-to-scan variation was evaluated to be ≤ 0.2%. The accuracy of the calibration curves was verified and the deviation from the converted dose deviates ≤ 3% from the known delivered dose. The gamma passing rate for all calibration methods was found to be over 94% with clinically relevant criteria. EDW calibration demonstrated higher average gamma passing rates compared to the manual method for single target plans, which is 99% ± 1.2% and 98.8% ± 1.5%, respectively. PDD method demonstrated improved agreement for multiple targets with the result of 99.3% ± 0.8%.
Conclusions
The three calibration methods were validated, and they produced accurate calibration curves for EBT-XD films to enable pre-treatment patient-specific QA for stereotactic radiotherapy.
Background
Stereotactic radiotherapy (SRT) is becoming a worldwide standard of care for small, intracranial lesions because it enables better optimization of therapeutic ratios by delivering a highly conformed dose to the target with a steep dose fall-off. HA is a semi-automated optimization method that typically contains a single iso-centre and four non-coplanar arcs combined with highly modulated MLC motion. This, however, introduces some challenges due to the added uncertainties stemming from small field dosimetry and the machine’s mechanical accuracy. Therefore, patient-specific QA(PSQA) remains a challenge for radiotherapy physicists [Citation1].
Gafchromic films are regarded as a suitable QA tool for 2-D dose distribution verification due to their physical and dosimetric properties [Citation2,Citation3]. EBT-XD films have been recommended by several authors and the manufacturer (Ashland, Inc.) as the most suitable film for SRT verification since it can be used to measure doses above 10 Gy [Citation4]. Nevertheless, gafchromic film dosimetry presents several inherent challenges, such as influence from the scanning direction, uncertainties linked to temperature, sensitivity to scratches and dust, etc. Flatbed scanners are widely used in clinics for digitizing gafchromic films. However, errors could originate from the scanner such as scan-to-scan random difference [Citation5], uncertainties related to lamp warm-up, variations generated from scanning location, non-uniform response that varies with colour channels, etc. Therefore, a comprehensive scanning protocol that considers artifacts from both gafchromic films and flatbed scanners needs to be determined before clinical use.
Several methods have been investigated to improve the accuracy of film dosimetry to reduce the influence of inherent challenges to a clinically acceptable level. Lewis et al. [Citation6] published an efficient protocol to combine calibration and measurement in a single scan to avoid the scan-to-scan variation by adopting a reference film for every scan, which has later become a popular method for film users. Wen et al. [Citation7] registered the film to a 2D array formed with ion chambers to correct the scanner’s non-uniformity for EBT-3. This study shows that the correction is significant when the field is larger than 10 × 10 cm2, which could result in up to 5% deviation when all colour channels are included.
Other research groups have reported successful experiences in implementing film dosimetry for SRT/SRS QA [Citation4,Citation7,Citation8]. Santos et al. [Citation8] proposed a protocol for SBRT/SRS treatment plan verification using EBT-XD films applying both red and triple channel methods. A thorough procedure was presented, while the lateral response artifact (LRA) was studied. Palmer et al. [Citation4] compared EBT-XD and EBT-3 in verifying high-dose treatments with the conclusion that EBT-XD showed a better result with the triple-channel method, improved calibration curve gradient at high dose, and reduced LRA compared to EBT-3. Ning et al. [Citation7] developed a protocol based on EBT-3 measuring doses up to 15 Gy with uncertainty within 1.5%.
However, to the best of the authors’ knowledge, there is no published work comparing different calibration methods. To accurately calibrate the EBT-XD for clinical use, three calibration methods were adopted in this work namely manual calibration, EDW calibration and PDD calibration. LRA was not investigated since the scanned films or evaluated area were no larger than 5 × 5 cm2. The scanner scan-to-scan variation is assessed for the EBT-XD films and the EPSON V850 Pro scanner. Triple-channel dosimetry was adopted rather than single-channel dosimetry as it has been verified to be better suited for high-dose treatment QA.
Material and methods
Film scanning protocol
Measurements were performed with film model EBT-XD® batch #05312201. Films were carefully handled with latex gloves and cut with sharp scissors to prevent bent edges. Films were stored in dark envelopes at a room temperature of around 22 °C with the humidity kept at 20%-60% [Citation3]. The Epson Perfection V850 Pro (Seiko Epson Corporation, Japan) flatbed scanner was employed for film scanning.
The local film scanning protocol was adopted by referring to several publications [Citation3,Citation4,Citation8]. Before film scanning, seven full-size scans were performed to properly warm up the scanner. Films were scanned in the same position which is along the central axis along the scanning direction on the scanner bed to reduce the LRA. When the film was cut into small pieces (normally 5.2 × 5.2 cm2 square), the orientation was marked and kept consistent. A full-scanner-size 2 mm thick glass plate was used to compress the film. Transmission mode was applied for scanning at 72 dpi in a triple-channel (RGB) 48-bit format. No corrections were applied, and images were saved in TIFF format. Each blank film was scanned before the irradiation to correct for non-uniformities. Films were saturated for 22 h after exposure before being scanned.
Scan-to-scan response variation
To validate the local film scanning protocol, the scanner’s scan-to-scan response was determined. An irradiated 5 × 5 cm2 film piece which had been properly stored for three months was scanned following the scanning protocol. Three series of 10 consecutive scans were acquired, with 5 min between the first and second series and 10 min between the second and third series. All TIFF images were converted into optical density (OD) images in the DoseLab (Varian, version 7.0) software, after which a ROI of 1 × 1 cm2 was manually defined and the mean values read in the same manner as the QA films.
Film Calibration
The 6 MV photon beam of a Varian TrueBeam accelerator was used for the calibration procedure. The department’s linacs are calibrated to deliver 1 Gy/100 MU at a depth of 5 cm and SSD = 95 cm for the field size 10 × 10 cm2 according to the TRS-398 report [Citation9]. Three film calibration methods were applied in this study.
Manual calibration
Ten film pieces (5 × 5 cm2) were irradiated to 0.5, 1, 3, 8, 12, 19, 23, 30, and 35 Gy in the polymethyl metacrylate (PMMA) block under the linac’s calibrated condition (as described in the last section). The TIFF files were imported into DoseLab and converted into net-OD images after correcting non-uniformity using the previously acquired scan of the film before irradiation. In the ‘Single Image Analysis’ module in DoseLab, a denoising 5 × 5 Wiener filter was applied first to all the net-OD images [Citation14]. A 1 × 1 cm2 ROI was used to measure the average net-OD values for the ten films to generate points for the calibration curve. The set of points was fitted with a third-order polynomial (also used for the other methods) to produce a calibration curve with dose versus film intensity, which was converted from OD value in DoseLab by multiplying with a known factor automatically determined by the software [Citation10].
Enhanced dynamic Wedge (EDW) calibration
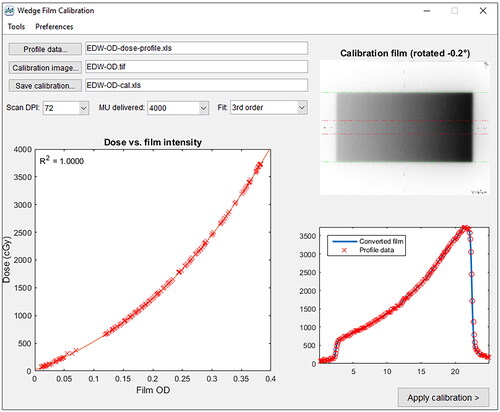
A full-scale single sheet of the film (20.3 × 25.4 cm2) was irradiated with a 10 × 20 cm2 field with 60° enhanced dynamic wedge (EDW) and 4000 monitor units at a depth of 5 cm in the PMMA block. The dose range is between 0 to 37.3 Gy. This TIFF image was converted into net-OD image in DoseLab in the same manner as manual calibration films. The manual calibration curve created from manual calibration was applied to convert the EDW OD image into a dose image. The dose distribution from this dose image is used to generate the corresponding wedge profile (formatted in DoseLab as *-profile.xls file). This wedge profile was then loaded in the ‘Wedge Film Calibration’ module to be correlated to the EDW OD image to fit the EDW calibration curve, as displayed in . There, the ‘Dose vs. Film intensity’ and the ‘Dose Profiles’ were plotted to help determine if the curve fitting is appropriate.
Figure 1. Interface of ‘Wedge Film Calibration’ in DoseLab. The input files are the pre-determined ‘*-profile.xls’ file from manual calibration. The Film OD vs. Dose calibration file is created by fitting the EDW dose image. By visual inspection, the accuracy of the fitting function can be evaluated.
Percentage dose depth (PDD) method
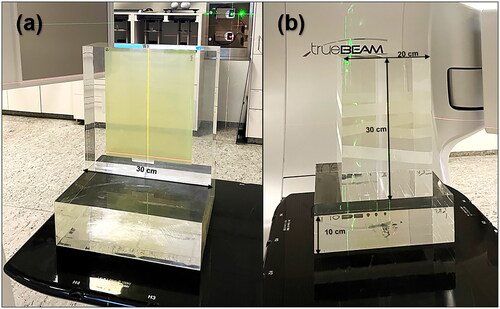
The Percentage Dose Depth (PDD) method was adapted from the study of Chang et al. [Citation11]. The full-scale film was sandwiched vertically between two 30 × 30 × 10 cm3 PMMA blocks and with an additional third block on the bottom, as is shown in . The short side of the film was aligned with the upper border of the PMMA block, while the long side of the film was along the beam direction. The SSD was set to 100 cm and the field size was 10 × 10 cm2. Four films were irradiated with this setup under 3700, 1200, 390 and 120 MU respectively to cover a full range of 0–40 Gy.
Figure 2. the setup of the EBT-XD film for the PDD method. (a) the position of the film and orientation of the phantom. (b) the setup for radiation Delivery.
The corresponding PDD data was measured with our PTW BEAMSCAN water phantom and a 0.016 cc PinPoint 3D ion chamber (PTW, type 31022). The density correction of the PMMA block was not taken into consideration due to the limit of equipment. After exposure, films were scanned and converted into net-OD images in the same manner as illustrated in the previous section. An in-house Python script was developed to correlate the BEAMSCAN PDD data to the film intensity data to create the calibration curve. The film intensity value was averaged with a step size of 0.3 cm, which is consistent with the cavity diameter of the PinPoint detector.
The accuracy of the calibration curve for the EDW method and PDD method was verified by adopting the film pieces used in the manual calibration, the film intensities were converted into dose images using the corresponding calibration curves. The resulting doses are compared to the known delivered dose.
Evaluation of the PSQA for HA treatment using films
The PSQA was performed retrospectively for three clinical HA plans. Two cases had a single metastasis: Case #1 with a target size of 1.28 cc prescribed 7 Gy per fraction and case #2 with a target size of 2.6 cc prescribed 24 Gy per fraction. Case #3 contained two targets (0.6 cc and 6.15 cc, respectively) that were separated by approximately 11 cm prescribed with 7 Gy per fraction. Plans were optimized in Eclipse 15.6 using a 6 MV flattening filter-free (FFF) photon beam and calculated with Acuros algorithm with a grid size of 1.25 mm. All plans passed the departmental pre-treatment QA which combines portal dosimetry with the gamma criteria of 3%, 1 mm, and point dose measurement with a 2% tolerance.
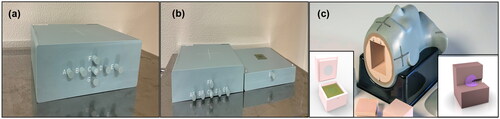
The test films were marked with orientation and were sandwiched in a water equivalent Mobius3D Verification Phantom (MVP). The phantom is 25 × 13 x 20 cm3 in dimension and there are markers to help with aligning the measurement film, as indicated in . PSQA was also performed with a more complex anthropomorphic STEEV phantom (CIRS, Norfolk, VI). The plan for case #3 was delivered to STEEV with a QA film and the point dose was measured simultaneously with a volume of 0.016 cc PinPoint 3D ion chamber (PTW, type 31022), as shown in .
Figure 3. Phantoms used for patient QA. (a) MVP phantom assembled for irradiation. (b) Positioning of the film in the Middle of the MVP phantom. (c) The anthropomorphic STEEV phantom with the special film holder.
After delivering the radiation, the measured dose was compared to the TPS exported plane dose in DoseLab. In DoseLab’s ‘Dose Comparison Interface’, the two distributions were automatically orientated, positioned, and registered followed by a manual inspection. The comparison dpi was automatically changed to the resolution of the lower image, which is 65 dpi in this study. The dose distribution was normalized to the maximum dose while the measured film dose was also normalized to match the TPS calculated dose. Global gamma evaluation with criteria of 3%/1 mm, 2%/2 mm, and 2%/1 mm were applied for film analysis. The cut-off value was 10% for the single target case and 50% for the multiple target case.
Results
Scan-to-scan response variability
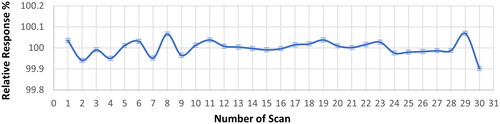
The relative OD response of each scan is plotted in . The maximum deviation over 30 scans appeared at the last scan with a 0.1% difference from the average. The difference between the maximum value and the minimum value was 0.17%. This indicates the scanner’s uncertainty of scan-to-scan variability is lower than 0.2% if the scan is performed within 10 min and less than 30 times.
Figure 4. the plot of the Relative OD response over 30 scans. The average OD reading for all scans was levelled as 100% in the graph. The standard deviation was calculated for each scan.
Calibration of EBT-XD films using three methods
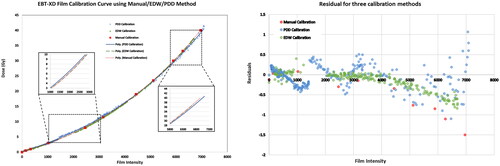
The calibration curves, as well as data points, are plotted in . The manual and EDW curves mostly overlap while the PDD curve shows a higher dose response in the range of 3–10 Gy and a lower response when the dose is above 28 Gy. The maximum deviation between the PDD curve and the other curves is found where the value of the film intensity is around 3700, where the PDD method gives 2.7% lower dose compared to the other methods. The data collected from the PDD method fluctuates more than the other two methods with the presence of films’ noise and there are also uncertainties for the PDD method from the inter-measurement setup error for the four films that were used to generate the full curve. From the residual plot, it could be seen that EDW method yielded the best fit while manual method showed a clear overfitting in the high dose region. PDD method produced the most residual uncertainties.
Figure 5. EBT-XD Film calibration curves using manual, EDW and PDD methods. Ten, 201 and 303 data points from manual, EDW, and PDD calibration methods were collected and fitted with third-order polynomials with the correlation coefficient, i.e., R-squared values being 1.0000, 1.0000 and 0.9994, respectively. Zoomed-in plots for the dose range of 3-10 Gy and above 28 Gy.
The accuracy of calibration curves was verified for EDW calibration and PDD calibration, as given in . The manual calibration was not included since it was similar to the EDW calibration. The difference between the converted dose and the delivered dose was generally within 3%, except for the low doses (< 3 Gy). The EDW calibration curve showed the mean dose error range of 0.1 ± 0.7%. The PDD calibration displayed a larger uncertainty of 1.1 ± 1.8%.
Table 1. The accuracy of EDW and PDD calibration curves was verified. Eight films with known irradiated doses were converted into dose information and compared with actual doses.
PSQA for stereotactic radiotherapy (SRT) with HA technique
The PSQA results using gamma analysis with various criteria are listed in . The gamma passing rates were all above 94% for the three calibration methods using clinically relevant criteria, i.e., 3%, 1 mm and 2%, 2 mm [Citation6,Citation9]. The strictest criteria of 2%, 1 mm was tested to acquire extra detailed information. For cases with a single target (case #1 and case #2) measured in the MVP phantom, all methods showed over 98% passing rates, while the EDW method showed the highest result with 99% ± 1.2%. Manual calibration and PDD calibration had similar results in these cases with 98.8 ± 1.5% and 98.8 ± 1.3%, respectively. For case #3 with two targets, the PDD method yielded a higher passing rate compared to the other two methods, which reached 99.3% ± 0.8%. Potentially, this might originate from the difference in the calibration curves in the dose range of 3–10 Gy. Manual calibration and EDW calibration had similar results, but the EDW method is again superior.
Table 2. Gamma passing rate with various criteria, dose converted using three calibration approaches.
It should be well noted that the threshold value for case #1 and case #2 was 10%, while this value was 50% for case #3. The reason being that for a case with two targets separated by 8 cm, there is a dose bridge that consists of low doses, which is very sensitive to the setup.
The result for the film measurement in the STEEV phantom is given in as case #4. The test results for manual calibration and EDW calibration were similarly good but a huge difference was exhibited with the PDD method. When the 2%, 1 mm dose difference criterion was adopted, the passing rate was only 71%, which came from the relatively low-dose region (< 7 Gy). When the threshold was set to 50%, the passing rate for 2%, 1 mm criteria was improved to 90.2%. Nevertheless, the overall result was still satisfying. The point dose was measured with the PinPoint 3D ion chamber separately for each of the arcs. The reading was corrected according to report TRS-398. The total summed dose was 1.0% lower than the calculated point dose.
Discussion
This work presents the use of three calibration methods to calibrate the EBT-XD films in the use of HA plan verification. The calibration curves were investigated, both by simple squared fields and clinical SRT plans. Accuracy of calibration curves was firstly verified, and it turned out that converted doses deviated less than 3% from actual delivered doses. Regarding the patient plan QA, EDW method showed a slightly improved but similar result to the manual calibration, as can be seen from their well-matched calibration curves. The performance of the PDD method was better than the other two methods for the multiple targets case but worse in the STEEV phantom measurement, both can be caused by the difference of the calibration curve in the low dose range. The PDD calibration procedure, which includes setting up the heavy PMMA blocks, taping the film and taping the blocks together, and aligning to the room lasers, is considered to have potential uncertainties. Besides, the density of the PMMA block should be ideally corrected. This high-dose application differs from the original PDD method application, which was only up to 10 Gy [Citation11]. The conventional manual calibration is verified as an accurate method even for the HA plan with a high degree of complexity. The EDW method is proven to be well-suited for the application of film dosimetry, which is adopted in the author’s department for clinical verification and therefore recommended for clinical use. One limitation of this EDW method is that the manual calibration curve was adopted for EDW curve fitting, which might lead to their similar calibration curves. It was not a concern in this work since the ‘Wedge Film Calibration’ interface in DoseLab enables a visual inspection if the wedge field is well fitted. Another option is to acquire the reference dose profile using a 2-D array.
The gamma analysis performed in this study utilized three criteria: 3%, 1 mm, 2%, 2 mm and 2%, 1 mm, among which the 3%, 1 mm is currently in clinical use in the authors’ department. Some authors adopted and recommended 2%, 2 mm agreement criteria based on their own QA tools and experiments [Citation12,Citation13]. The dose distribution was normalized to the maximum dose to conduct the global gamma analysis, which is consistent with some authors’ work [Citation14]. This can be altered to perform the local gamma evaluation, which can highlight better the low dose region. However, this was not an option in DoseLab which only calculates the local percent difference. The dose distribution was also normalized to the TPS calculation dose because the linac had an output fluctuation. This makes it difficult to compare to other publications since the normalization methods are not revealed, as discussed by Pócza et al. [Citation12].
The weakness of this paper is that the scanner’s scan-to-scan response investigation is limited to the central region of the scanner and has no extension laterally more than 5 cm. Authors have reported a detailed characterization of this effect and the corresponding correction methods [Citation5] and the lateral response artifact correction [Citation6–8,Citation11]. It is recommended that each department fully test their scanner before any further use. Software used for the film analysis could also have a significant impact on the result. As reported by Pócza et al. [Citation12] FilmQA Pro achieved the best gamma passing rate compared to PTW Mephysto and Radiochromic.com. Being one of the available software for film analysis [Citation3], DoseLab can convert the exposed film into a netOD image with the non-uniformity correction from the blank film, generating the calibration curves automatically and having an interactive interface for the dose comparison. However, the calibration curve can’t be separated for each colour channel and the correction method of including a reference film [Citation6] is not easy to achieve. Therefore, a specific protocol needs to be decided depending also on the software and its capabilities.
Conclusion
This work has validated and compared three calibration methods for EBT-XD film. The calibration and measurement protocol has been established. The scan-to-scan variation for the specific scanner has also been investigated. It is proved that EBT-XD film is a suitable tool for HA patient-specific QA.
Disclosure statement
No potential conflict of interest was reported by the author(s).
Data availability statement
The data that support the findings of this study are openly available in Harvard Dataverse at https://doi.org/10.7910/DVN/RN3IC5.
References
- Wilke L, Andratschke N, Blanck O, et al. ICRU report 91 on prescribing, recording, and reporting of stereotactic treatments with small photon beams: statement from the DEGRO/DGMP working group stereotactic radiotherapy and radiosurgery. Strahlenther Onkol. 2019;195(3):193–198. doi:10.1007/s00066-018-1416-x.
- Santos T, Ventura T, Lopes M. A review on radiochromic film dosimetry for dose verification in high energy photon beams. Radiat Phys Chem. 2021;179:109217. doi:10.1016/j.radphyschem.2020.109217.
- Niroomand-Rad A, Chiu-Tsao ST, Grams MP, et al. Report of AAPM task group 235 radiochromic film dosimetry: an update to TG-55. Med Phys. 2020;47(12):5986–6025. doi:10.1002/mp.14497.
- Palmer AL, Dimitriadis A, Nisbet A, et al. Evaluation of gafchromic EBT-XD film, with comparison to EBT3 film, and application in high dose radiotherapy verification. Phys Med Biol. 2015;60(22):8741–8752. doi:10.1088/0031-9155/60/22/8741.
- Lewis D, Devic S. Correcting scan-to-scan response variability for a radiochromic film-based reference dosimetry system. Med Phys. 2015; Oct42(10):5692–5701. doi:10.1118/1.4929563.
- Lewis D, Micke A, Yu X, et al. An efficient protocol for radiochromic film dosimetry combining calibration and measurement in a single scan. Med Phys. 2012;39(10):6339–6350. doi:10.1118/1.4754797.
- Wen N, Lu S, Kim J, et al. Precise film dosimetry for stereotactic radiosurgery and stereotactic body radiotherapy quality assurance using gafchromic EBT3 films. Radiat Oncol. 2016;11(1):132. Oct 4doi:10.1186/s13014-016-0709-4.
- Santos T, Ventura T, Capela M, et al. A protocol for absolute dose verification of SBRT/SRS treatment plans using gafchromic EBT-XD films. Phys Med. 2021;82:150–157. doi:10.1016/j.ejmp.2021.01.082.
- International Atomic Energy Agency. Absorbed Dose Determination in External Beam Radiotherapy, Technical Reports Series No. 398, IAEA, Vienna, 2000.
- Mobius Medical Systems. DoseLab user manual version 7.0. Houston (TX): Mobius Medical Systems; 2018.
- Chang L, Ho SY, Lee TF, et al. Calibration of EBT2 film using a red-channel PDD method in combination with a modified three-channel technique. Med Phys. 2015;42(10):5838–5847. doi:10.1118/1.4930253.
- Pocza T, Zongor Z, Melles-Bencsik B, et al. Comparison of three film analysis softwares using EBT2 and EBT3 films in radiotherapy. Radiol Oncol. 2020;54(4):505–512. 5doi:10.2478/raon-2020-0049.
- Dimitriadis A, Palmer AL, Thomas RAS, et al. Adaptation and validation of a commercial head phantom for cranial radiosurgery dosimetry end-to-end audit. Br J Radiol. 2017;90(1074):20170053. doi:10.1259/bjr.20170053.
- Brown TAD, Fagerstrom JM, Beck C, et al. Determination of commissioning criteria for multileaf-collimator, stereotactic radiosurgery treatments on varian TrueBeam and edge machines using a novel anthropomorphic phantom. J Appl Clin Med Phys. 2022;23(6):e13581.