
Abstract
Background
Patients with stage II seminoma have traditionally been treated with photons to the retroperitoneal and iliac space, which leads to a substantial dose bath to abdominal and pelvic organs at risk (OAR). As these patients are young and with excellent prognosis, reducing dose to OAR and thereby the risk of secondary cancer is of utmost importance. We compared IMPT to opposing IMRT fields and VMAT, assessing dose to OAR and both overall and organ-specific secondary cancer risk.
Material and methods
A comparative treatment planning study was conducted on planning CT-scans from ten patients with stage II seminoma, treated with photons to a ‘dog-leg’ field with doses ranging from 20 to 25 Gy and a 10 Gy sequential boost to the metastatic lymph node(s). Photon plans were either 3–4 field IMRT (Eclipse) or 1–2 arc VMAT (Pinnacle). Proton plans used robust (5 mm; 3.5%) IMPT (Eclipse), multi field optimization with 3 posterior fields supplemented by 2 anterior fields at the level of the iliac vessels. Thirty plans were generated. Mean doses to OARs were compared for IMRT vs IMPT and VMAT vs IMPT. The risk of secondary cancer was calculated according to the model described by Schneider, using excess absolute risk (EAR, per 10,000 persons per year) for body outline, stomach, duodenum, pancreas, bowel, bladder and spinal cord.
Results
Mean doses to all OARs were significantly lower with IMPT except similar kidney (IMRT) and spinal cord (VMAT) doses. The relative EAR for body outline was 0.59 for IMPT/IMRT (p < .05) and 0.33 for IMPT/VMAT (p < .05). Organ specific secondary cancer risk was also lower for IMPT except for pancreas and duodenum.
Conclusion
Proton therapy reduced radiation dose to OAR compared to both IMRT and VMAT plans, and potentially reduce the risk of secondary cancer both overall and for most OAR.
Background
Testicular cancer is the most common solid tumor in men aged 20–45 years and the incidence has been rising (Znaor [Citation1], Efstathiou [Citation2]). For stage I seminoma, active surveillance and salvage treatment of recurrences gives the same excellent prognosis as adjuvant chemo- or radiotherapy upfront [Citation3]. Active surveillance for stage I seminoma is the preferred strategy in Denmark, and radiotherapy is mainly reserved for solitary retroperitoneal lymph node recurrences <3 cm and for primary stage IIa and IIb (if lymph nodes are <3 cm) [Citation4].
The standard radiation volume for both recurrences and primary stage II comprises retroperitoneal (para-aortic, paracaval, interaorto-caval, precaval, and pre-aortic) and ipsilateral internal and external iliac lymph nodes regions – the so-called ‘dog-leg’ (Pierorazio [Citation5]). Further, a sequential boost to the pathological lymph node is added. Due to the extent of this radiation field, several organs at risk (OARs), including stomach, pancreas, bowel bag, kidneys, spinal cord, duodenum and bladder are exposed to radiation.
Acute toxicity is most often minor (Pasalic [Citation6], Pierorazio [Citation5]), but some patients experience late morbidity including erectile dysfunction [Citation7], neurological, gastrointestinal, and urogenital events with increased risk of mortality from complications up to 30 years after the treatment (Knap [Citation8], Pierorazio [Citation5]). Studies have also documented an increased risk of secondary cancer after radiotherapy for seminoma (Travis [Citation9] and Kier [Citation10]). The young age of the patients and the favorable prognosis make reduction of secondary cancer risk pertinent, thus optimizing radiotherapy is essential to improve outcome for these patients.
Published studies on photon therapy for seminoma includes conventional 3D or IMRT techniques with anterior/posterior field orientation (Simone [Citation11], Pasalic [Citation6]). Volumetric arc techniques (VMAT) have been implemented for several cancer types, as it offers increased conformity and rapid treatment delivery, but VMAT also increase the low dose bath to surrounding OARs [Citation12].
Previous studies have compared conventional photon therapy with different proton techniques and field orientations (Pasalic [Citation6], Simone [Citation11], Efstathiou [Citation2], Hoppe [Citation13]). One recent study have compared proton therapy (both passive scattering (PS)/uniform scattering (US) and pencil beam scattering (PBS)) with 3D AP-PA (anterior-posterior) photon fields and IMRT/VMAT and assessed secondary cancer risks between modalities for selected OARs (Maxwell [Citation14]).
With this study we compare radiation dose to OAR with AP-PA, modern IMRT, VMAT and IMPT for patients with seminoma and indication for radiotherapy. Further, we model the secondary cancer risk for each technique, both over-all and organ specific.
Material and methods
Patients
Treatment planning scans from ten patients with recurrent stage I or stage II seminoma, previously treated with traditional ‘dog-leg’ volume and photon therapy, were used for comparative dose planning, . The elective target (CTV-E) was defined as para-aortic, paracaval, interaorto-caval, precaval, and pre-aortic and ipsilateral internal and external iliac lymph nodes as described by Wilder et al. [Citation15], individual modifications were allowed. Prescribed dose to CTV-E ranged from 20 to 25 Gy. Metastatic lymph node(s) with a 10 mm margin (CTV-T) was subsequently boosted with 10 Gy. Bladder, duodenum, pancreas, stomach, bowel bag, kidneys and spinal cord were considered organs at risk (OAR) and they were delineated according to RTOG guidelines [Citation16,Citation17] or anatomy (spinal cord). Body outline comprise the entire CT scan volume.
Table 1. Patient and treatment characteristics.
The study was approved by the Aarhus University Hospital institutional review board. According to national legislation, informed consent was not required.
Photon therapy dose planning, IMRT and VMAT
Photon plans were either IMRT (Eclipse, Varian Medical Systems, v16.1) or VMAT (Pinnacle, Philips Healthcare, v16.2) based on local treatment centre standards.
IMRT plans used either 3 field AP-PA (gantry angles: 15, 180, 345) with 6 MV and 15 MV or 4 fields AP-PA (gantry angles: 0, 180) with 6 MV and 18 MV. VMAT plans used 1 or 2 arcs with 6 MV. Boost plans used 3 fields not at fixed gantry angles with 15 MV or 1 arc with 6 MV.
An expansion of CTV-E and CTV-T with 5 mm in the horizontal plane and 6–9 mm in cranial-caudal direction formed the (planning target volume) PTV-E and PTV-T.
Proton therapy dose planning, IMPT
Proton IMPT plans used 5 fields for the elective target − 3 posterior fields (gantry angles: 150, 180, 210) covering the entire CTV-E supplemented by 2 anterior fields (gantry angle 5, 30, or 330, 355) at the level of the iliac vessels (Eclipse, Varian Medical Systems v13.7). A 5 cm polycarbonate (Lexan) range shifter was used for the 2 anterior fields as the water equivalent thickness (WET) from the outer contour of the body outline to CTV-E was less than 4 cm.
The robust target volumes (RTVs) were based on the CTVs with a 5 mm setup error, a calibration curve error of 3.5% and a 1 mm proximal and distal margin, respectively.
IMPT with multi-field optimization (MFO) robust optimization and evaluation was done for 14 scenarios: 2 scenarios with 0 mm setup error and ±3.5% calibration curve error and 12 scenarios with 5 mm setup error and ±3.5% calibration curve error. A constant relative biological effectiveness (RBE) factor of 1.1 was used. All IMPT plans were normalized to the target mean. Air cavities (bowel gas) near the target area were contoured and overwritten to water for optimization, but not for final dose calculation. The dose coverage criterion for the worst-case scenario was CTV V95% ≥98%.
A total of 30 plans were used − 10 clinical plans and in addition 10 VMAT/IMRT plans and 10 IMPT plans for the comparison. The clinical plans were not consulted until after the generation of the extra IMRT/VMAT and IMPT plans. Patient and treatment characteristics are summarized in .
Analysis
The clinical photon (IMRT or VMAT) treatment plans were used for comparison. The mean organ dose for the following OARs were compared for IMRT vs IMPT and VMAT vs IMPT: body outline, bowel bag, spinal cord, duodenum, left kidney, right kidney, pancreas, stomach, bladder. The comparison was done for the summed doses – primary (CTV-E) plus boost (CTV-T).
The risk of secondary cancer was calculated by the model described in Schneider et al. [Citation18] We used the differential DVHs as input to the model by Schneider et al. As pancreas and duodenum is not present in the model by Schneider et al. we used same data as for small intestine as described by Efstathiou et al. [Citation2]: ‘Organ-specific parameters for kidneys and pancreas were not present in Schneider’s publication. Thus, these organs were assigned the same parameters as small bowel because Preston et al. presented similar second cancer induction coefficients in pancreas, kidney and small bowel…’. Likewise, for spinal cord we used the data for brain + CNS as argued in Timlin et al. [Citation19] For the bowel bag we used both the data for small intestine and colon to display the difference. The selected OARs were chosen based on secondary cancer risk according to Kier et al. [Citation10] The excess absolute risk (EAR, per 10.000 persons per year) was calculated for body outline and the following OARs: stomach, pancreas, duodenum, bowel bag, bladder and spinal cord. For each patient the individual total dose and age at treatment was used in the model along with a fractionation size of 2 Gy [Citation20]. The relative EAR was calculated for body outline, stomach, pancreas, duodenum, bowel bag, bladder and spinal cord for IMPT vs. IMRT and IMPT vs. IMPT according to Timlin et al. [Citation19]
Wilcoxon’s signed rank test with Holm–Bonferroni corrected p-values was used for comparison (MATLAB ver. R2022a). A p-value <.05 was considered statistically significant.
Results
Comparative treatment planning was performed in 10 patients previously treated with photons.
Dose to organs at risk
Median GTV volume was 5.6 cm3 (range: 2.2–12.7 cm3). Localisation of pathological lymph nodes were para-aortic left (n = 6), pre-caval (n = 3) and internal iliac (n = 1). CTV-E volumes differed with a median (range) of 614 cm3 (418–877 cm3) and 65 cm3 (25–104 cm3) for the CTV-T.
For the IMRT and VMAT plans the median PTV-E coverage for the elective volume and the median PTV-T coverage for the boost all fulfilled D98% > 95%. Likewise, for the IMPT plans the median worst-case scenario CTV-E coverage and CTV-T coverage fulfilled D98% > 95%, respectively.
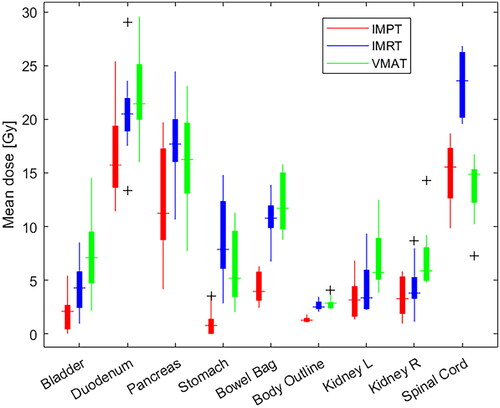
Mean doses (Dmean) to all OARs were significantly lower with IMPT compared to IMRT (p < .05) except for comparable kidney doses. For IMPT compared to VMAT, Dmean to all OARs were significantly lower with IMPT (p < .05) except for comparable spinal cord doses ().
Figure 1. Box plots for mean doses for body outline, bowel bag, bladder, spinal cord, duodenum, kidney left, kidney right, pancreas and stomach. IMPT (red), IMRT (blue), VMAT (green). Box plots define the interquartile range (IQR) with the 25th and 75th percentile as top and bottom. The whisker length is defined as 1.5 times the IQR and outliers beyond are marked (Black).
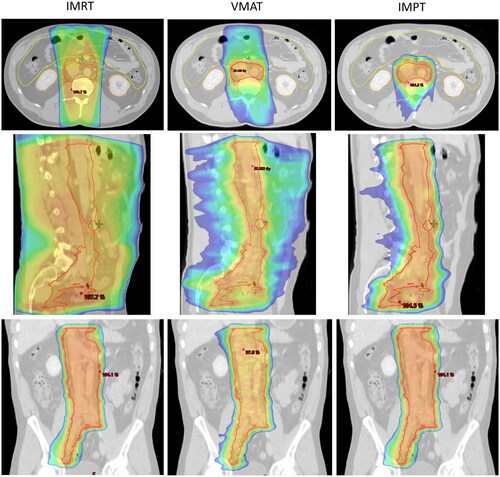
The posterior field orientation of IMPT resulted in similar spinal cord doses. An example of dose distribution (50% isodose) can be seen in for IMRT, VMAT, IMPT.
Figure 2. Dose distribution for CTV-E shown for IMRT, VMAT and IMPT. Top row: Transversal view; Middle row: Sagittal view; Bottom row: Coronal view. Shown is the 50% dose colour wash.
summarizes mean OAR doses including p-values. Full DVH's for all analysed OAR's are presented in the supplementary (Figure S1) displaying the increased low-dose bath with VMAT for several of the OARs. Individual mean dose comparisons and identity lines (IMPT vs IMRT and IMPT vs VMAT) are shown in the supplementary (Figure S2). Pancreas median Dmean was reduced from 16.2 Gy (IMRT) and 14.7 Gy (VMAT) to 10.6 Gy for IMPT. Duodenum Dmean went from 20.6 Gy (IMRT) to an increased 22.2 Gy (VMAT) and to a decreased 17.0 Gy (IMPT). For the stomach, the reduction was from 8.7 Gy (IMRT) and 6.0 Gy (VMAT) to 1.2 Gy (IMPT). Kidneys were evaluated separately (lift and right). The kidney median Dmean was reduced from 4.3 Gy (IMRT) and 7.0 Gy (VMAT) to 3.5 Gy (IMPT) for the left side and from 4.5 Gy (IMRT) and 7.0 Gy (VMAT) to 3.5 Gy (IMPT) for the right side, respectively. For the spinal cord, Dmean were 23.6 Gy (IMRT), 13.3 Gy (VMAT), and 15.1 Gy (IMPT), respectively.
Table 2. Results - Median (range) Dmean and median (range) relative EAR.
The risk of secondary cancer
The relative EAR for IMPT vs IMRT and IMPT vs VMAT is summarized in and . For the body outline the relative EAR was 0.59 (IMPT/IMRT) and 0.33 (IMPT/VMAT). For the individual OARs, the difference in the relative EAR for the stomach was 0.23 (IMPT/IMRT) and 0.18 (IMPT/VMAT). For the bowel bag, on the basis of data for the small intestine, the difference in relative EAR was 0.37 (IMPT/IMRT) and 0.72 (IMPT/VMAT); based on the data for colon, the difference was 0.4 (IMPT/IMRT) and 0.36 (IMPT/VMAT). For bladder, the relative EAR was 0.36 (IMPT/IMRT) and 0.30 (IMPT/VMAT). All in favor of IMPT and statistically significant (p < .05). For duodenum the difference was 1.08 (IMPT/IMRT) and 1.50 (IMPT/VMAT) – only statistically significant for IMPT/VMAT and for spinal cord the difference was 0.71 (IMPT/IMRT) and 1.03 (IMPT/VMAT) – only statistically significant for IMPT/IMRT. For pancreas 0.78 (IMPT/IMRT) and 1.17 (IMPT/VMAT) – not statistically significant.
Figure 3. Top row: The excess absolute risk (EAR) per 10.000 persons per year of secondary cancer for IMPT (Red), IMRT (blue) and VMAT (green), respectively, according to Schneider et al. [Citation17]. Bottom row: The relative EAR for IMPT vs IMRT (blue) and IMPT vs VMAT (green). Bladder, duodenum, pancreas, stomach, spinal cord, bowel bag (small intestine), bowel bag (colon), and body outline. Box plots define the interquartile range (IQR) with the 25th and 75th percentile as top and bottom. The whisker length is defined as 1.5 times the IQR and outliers beyond are marked (Black).
![Figure 3. Top row: The excess absolute risk (EAR) per 10.000 persons per year of secondary cancer for IMPT (Red), IMRT (blue) and VMAT (green), respectively, according to Schneider et al. [Citation17]. Bottom row: The relative EAR for IMPT vs IMRT (blue) and IMPT vs VMAT (green). Bladder, duodenum, pancreas, stomach, spinal cord, bowel bag (small intestine), bowel bag (colon), and body outline. Box plots define the interquartile range (IQR) with the 25th and 75th percentile as top and bottom. The whisker length is defined as 1.5 times the IQR and outliers beyond are marked (Black).](/cms/asset/96519b3c-c427-4536-9730-0baf3bf05a69/ionc_a_2254925_f0003_c.jpg)
The data for absolute EAR of secondary cancer for body outline and the individual OARs are presented in and supplementary material Table S1. In the supplementary (Figure S3) a scatter plot for EAR vs mean dose is presented.
Discussion
In this study, we report the results of comparative IMRT, VMAT, and IMPT dose planning for testicular seminoma. This is the first comparative dose planning study for seminoma where modern proton pencil beam scanning, IMPT with five fields has been compared to standard of care IMRT and VMAT. In the comparison we used the clinical photon plans and we found that IMPT significantly reduced the dose to all delineated OARs except kidneys and spinal cord compared to photon treatment (IMRT and VMAT respectively), which could result in reduced acute and late toxicity, as also described in a small study comparing photon and proton treated patients (Pasalic [Citation6]).
The lower radiation dose with IMPT resulted in modelling a lower risk of secondary cancer overall and for most OARs, but not for the pancreas, duodenum, and spinal cord across the different treatment modalities. For VMAT the relative EAR was significantly higher for duodenum, favouring VMAT over IMPT, while non-significant for the pancreas and spinal cord. For IMRT the relative EAR was not significantly lower for the pancreas and duodenum but significantly lower for the spinal cord, favouring IMPT over IMRT. For most OARs the absolute modelled risk of secondary cancer was in general low.
In 2012 Efstathiou et al. [Citation2], published a study comparing protons to photons for the treatment of early-stage seminoma. They compared passive scattering to IMRT and found a reduced dose to OARs with proton therapy and likewise concluded it could reduce the risk of secondary cancers. The two small studies by Simone et al. [Citation11] and Hoppe et al. [Citation13] found similar results.
The recent study by Maxwell et al. [Citation14] in 2023 compared both PS/US and PBS to AP-PA 3D photon and IMRT/VMAT plans. They also found a reduced dose to surrounding OAR and a modelled reduced EAR with protons compared to photons including stomach, colon, liver, and bladder. Comparing EAR for the stomach and bladder they found a higher absolute EAR for the stomach for both IMRT/VMAT and protons and a lover absolute EAR for the bladder for both techniques. For both stomach and bladder, we found a lover relative EAR comparing IMPT to IMRT/VMAT. However, they used two limiting cases of the model where we used the full mechanistic model. Furthermore, in Maxwell et al. 79% of the plans where PBS and they only used one posterior or two oblique posterior fields (87.5%) or one posterior plus one ipsilateral posterior oblique field (12.5%) resulting in different OAR dose and subsequent EAR modelling compared to our study.
We used five proton fields in our study, which is markedly more than the one or two fields in the previous studies. The choice of one to two fields is pragmatic and based to clinical flow and resource arguments. Pencil beam scanning technology allow the use of multiple fields and improved conformity and robustness; we have therefore implemented multiple fields in our clinical work flow for testicular seminoma.
Absolute risk estimates for secondary cancers on the basis of the model by Schneider et al. [Citation18] should be interpreted with care. The model is based on data from atomic bomb survivors and Hodgkin’s patients and are associated with large errors. But Timlin et al. [Citation19] showed that relative EAR data is useful to compare radiotherapy plans in regards to the risk of secondary cancers and as long as the comparison is done organ by organ for an individual patient the uncertainties are small. Furthermore, despite the models uncertainties we have looked at the OARs where we know these patients do get secondary cancers [Citation10,Citation21,Citation22]. To compare with the data in Kier et al. [Citation10] we have converted the EAR of 31 for AP-PA IMRT to a cumulative incidence of secondary cancers of 6.4% after 20 years which is in line with the overall cumulative increase after 20 years of 6.5% found in Kier et al. [Citation10] For an EAR of 51 (VMAT) and 17 (IMPT) the cumulative increase of secondary cancers convert to 3.5% and 10.8%, respectively. Kier et al. does not include data from modern techniques like VMAT and IMPT.
A special caution regarding the results for the risk model for body outline as mentioned in Schneider et al. [Citation18] it should only be used for Hodgkin’s patients. We have chosen to use the model by Schneider to calculate the EAR for body outline as this has been done by others, e.g., Efstathiou et al. [Citation2,Citation14], for the same group of testicular seminomas patients as included in our study.
As the pancreas and duodenum are not present in the model by Schneider et al. [Citation18] we used the risk data for the small intestine as also argued and done by others [Citation2,Citation23], likewise for the spinal cord where we used the risk data for brain + CNS [Citation19]. As the bowel bag contains both small and large bowel, we also compared EAR on the basis of data for the colon. The use of colon data gave a higher EAR for bowel bag which underlines the uncertainties of modelling the secondary cancer risk, however, both favoured IMPT to IMRT and VMAT. The model (Schneider et al. fig 7 [Citation18]) for the small intestine implies a high risk of secondary cancer with low organ doses. This explains why even a lower mean OAR dose does not translate into a reduced risk of secondary cancer for duodenum and pancreas as we used the differential DVHs in the model for calculation of the EAR where IMPT contributes in the low dose area which IMRT and VMAT does not. This is in line with the model where there is no low-dose contribution from IMRT and VMAT. Cumulative DVHs for the delineated OARs is shown in the supplementary (Figure S1).
We have not included the impact from neutrons in the estimation of secondary cancers. In 2015 Schneider et al. showed the out-of-field neutron contribution from proton pencil beam scanning is less (in the orders of µSv/Gy) than the contribution from high energy photon IMRT and passive (non-scanning pencil beam) [Citation24,Citation25]. And even so, for passive proton therapy the contribution from neutrons is very low compared to the general dose sparing from protons compared to photons [Citation26].
We primarily used posterior fields to reduce impact from changing bowel gas and fillings, weight changes etc [Citation27]. The use of posterior fields gives a slightly higher dose to spinal cord with IMPT compared to VMAT. In the optimization we have a high weighted and robust setting for the maximum dose to spinal cord to keep it as low as possible. The dose to spinal cord with IMPT is still well below its tolerance according to Quantec [Citation28].
The dose to kidneys is very patient-dependent. For some patients, the kidneys are not near the elective or boost volumes for others near the target which results in similar kidney doses comparing IMRT, VAMT, and IMPT. The high dose area right next to the target is not reduced with protons.
Both the pancreas and duodenum overlap with the elective target volume. The extend of the overlap is dependent on patient anatomy. This is shown in the overlapping OAR DVHs in the supplementary (Figure S1). This resulted in the modeled absolute EAR being lower for the pancreas and duodenum for VMAT compared to IMPT and lower for the duodenum for IMRT compared to IMPT.
In conclusion, IMPT for the treatment of testicular seminoma resulted in lower radiation doses to OARs. According to the model by Schneider [Citation18] these dose reductions result in a reduction of secondary cancer risk. As patients with seminomas often are younger men with a good prognosis, reducing the risk of secondary cancer is essential. Based on the results from this study, proton therapy and the presented dose planning technique is now chosen as standard radiotherapy for seminomas in Denmark. Continuous evaluation should be done to monitor if the reduced OAR doses translate into improvement in toxicity profiles and a reduction in radiation induced secondary cancers.
Supplemental Material
Download MS Word (853.7 KB)Disclosure statement
No potential conflict of interest was reported by the author(s).
Data availability statement
Due to the national legislation it is not possible to share data.
References
- Znaor A, Skakkebaek NE, Rajpert-De Meyts E, et al. Global patterns in testicular cancer incidence and mortality in 2020. Int J Cancer. 2022;151(5):692–698. doi: 10.1002/ijc.33999.
- Efstathiou JA, Paly JJ, Lu HM, et al. Adjuvant radiation therapy for early stage seminoma: proton versus photon planning comparison and modeling of second cancer risk. Radiother Oncol. 2012;103(1):12–17. doi: 10.1016/j.radonc.2012.01.012.
- Mortensen MS, Bandak M, Kier MGG, et al. Surveillance versus adjuvant radiotherapy for patients with high-risk stage I seminoma, surveillance versus adjuvant radiotherapy for patients with high-risk stage I seminoma. Cancer. 2017;123(7):1212–1218. doi: 10.1002/cncr.30458.
- Mortensen MS, Lauritsen J, Gundgaard MG, et al. A nationwide cohort study of stage I seminoma patients followed on a surveillance program. Eur Urol. 2014;66(6):1172–1178. doi: 10.1016/j.eururo.2014.07.001.
- Pierorazio PM, Cheaib JG, Tema G, et al. Performance characteristics of clinical staging modalities for early stage testicular germ cell tumors: a systematic review. J Urol. 2020;203(5):894–901. doi: 10.1097/JU.0000000000000594.
- Pasalic D, Prajapati S, Ludmir EB, et al. Outcomes and toxicities of proton and photon radiation therapy for testicular seminoma. Int J Part Ther. 2020;7(2):11–20. doi: 10.14338/IJPT-20-00018.1.
- Bandak M, Lauritsen J, Johansen C, et al. Sexual function in a nationwide cohort of 2,260 survivors of testicular cancer after 17 years of followup. J Urol. 2018;200(4):794–800. doi: 10.1016/j.juro.2018.04.077.
- Knap MM, Bentzen SM, Jens Overgaard J. Late neurological complications after irradiation of malignant tumors of the testis. Acta Oncol. 2007;46(4):497–503. doi: 10.1080/02841860601052752.
- Travis LB, Fosså SD, Schonfeld SJ, et al. Second cancers among 40,576 testicular cancer patients: focus on long-term survivors. J Natl Cancer Inst. 2005;97(18):1354–1365. doi: 10.1093/jnci/dji278.
- Kier MG, Hansen MK, Lauritsen J, et al. Second malignant neoplasms and cause of death in patients with germ cell cancer. A Danish nationwide cohort study. JAMA Oncol. 2016;2(12):1624–1627. doi: 10.1001/jamaoncol.2016.3651.
- Simone CB, Kramer K, William P, et al. Predicted rates of secondary malignancies from proton versus photon radiation therapy for stage I seminoma. Int J Radiat Oncol Biol Phys. 2012;82(1):242–249. doi: 10.1016/j.ijrobp.2010.11.021.
- Teoh M, Clark CH, Whitaker S, et al. Volumetric modulated arc therapy: a review of current literature and clinical use in practice. Br J Radiol. 2011;84(1007):967–996. doi: 10.1259/bjr/22373346.
- Hoppe BS, Mamalui-Hunter M, Mendenhall NP, et al. Improving the therapeutic ratio by using proton therapy in patients with stage I or II seminoma. Am J Clin Oncol. 2013;36(1):31–37. doi: 10.1097/COC.0b013e3182354b9e.
- Maxwell R, Chang Y, Paul C, et al. Cancer control, toxicity, and secondary malignancy risks of proton radiation therapy for stage I-IIB testicular seminoma. Adv Radiat Oncol. 2023;8(5):101259. doi: 10.1016/j.adro.2023.101259.
- Wilder RB, Buyyounouski MK, Efstathiou JA, et al. Radiotherapy treatment planning for testicular seminoma. Int J Radiat Oncol Biol Phys. 2012;83(4):e445–e452. doi: 10.1016/j.ijrobp.2012.01.044.
- Gay HA, Barthold HJ, O'Meara E, et al. Pelvic normal tissue contouring guidelines for radiation therapy: a radiation therapy oncology group consensus panel atlas. Int J Radiat Oncol Biol Phys. 2012;83(3):e353–e362. doi: 10.1016/j.ijrobp.2012.01.023.
- Jabbour SK, Hashem SA, Bosch W, et al. Upper abdominal normal organ contouring guidelines and atlas: a radiation therapy oncology group consensus. Pract Radiat Oncol. 2014;4(2):82–89. doi: 10.1016/j.prro.2013.06.004.
- Schneider U, Sumila M, Robotka J. Site-specific dose-response relationships for cancer induction from the combined Japanese A-bomb and Hodgkin cohorts for doses relevant to radiotherapy. Theor Biol Med Model. 2011;8(1):27. doi: 10.1186/1742-4682-8-27.
- Timlin C, Loken J, Kruse J, et al. Comparing second cancer risk for multiple radiotherapy modalities in survivors of Hodgkin lymphoma. Br J Radiol. 2021;94(1121):20200354.
- Schneider U, Lomax A, Pemler P, et al. The impact of IMRT and proton radiotherapy on secondary cancer incidence. Strahlenther Onkol. 2006;182(11):647–652. doi: 10.1007/s00066-006-1534-8.
- Groot HJ, Lubberts S, de Wit R, et al. Risk of solid cancer after treatment of testicular germ cell cancer in the platinum era. J Clin Oncol. 2018;36(24):2504–2513. doi: 10.1200/JCO.2017.77.4174.
- Hellesnes R, Myklebust TÅ, Fosså SD, et al. Testicular cancer in the cisplatin era: causes of death and mortality rates in a population-based cohort. J Clin Oncol. 2021;39(32):3561–3573. doi: 10.1200/JCO.21.00637.
- Preston DL, Ron E, Tokuoka S, et al. Solid cancer incidence in atomic bomb survivors: 1958–1998. Radiat Res. 2007;168(1):1–64. doi: 10.1667/RR0763.1.
- Schneider U, Hälg R. The impact of neutrons in clinical proton therapy. Front Oncol. 2015;5:235. doi: 10.3389/fonc.2015.00235.
- Hälg RA, Schneider U. Neutron dose and its measurement in proton therapy—current state of knowledge. Br J Radiol. 2020;93(1107):20190412. doi: 10.1259/bjr.20190412.
- Schneider U, Agosteo S, Pedroni E, et al. Secondary neutron dose during proton therapy using spot scanning. Int J Radiat Oncol Biol Phys. 2002;53(1):244–251. doi: 10.1016/s0360-3016(01)02826-7.
- Gort EM, Beukema JC, Matysiak W, et al. Inter-fraction motion robustness and organ sparing potential of proton therapy for cervical cancer. Radiother Oncol. 2021;154:194–200. doi: 10.1016/j.radonc.2020.09.022.
- Marks LB, Yoke ED, Jackson A, et al. Use of normal tissue complication probability models in the clinic. Int J Radiat Oncol Biol Phys. 2010;76(3 Suppl):10–19.