
Abstract
Background
Genomic profiling is increasingly used both in therapeutic decision-making and as inclusion criteria for trials testing targeted therapies. However, the mutational landscape may vary across different areas of a tumor and intratumor heterogeneity will challenge treatments or clinical decisions based on single tumor biopsies. The purpose of this study was to assess the clinical relevance of genetic intratumor heterogeneity in head and neck squamous cell carcinomas (HNSCC) using the ESMO Scale for Clinical Actionability of Molecular Targets (ESCAT).
Materials and methods
This prospective study included 33 whole tumor specimens from 28 patients with primary or recurrent HNSCC referred for surgery. Three tumor blocks were selected from central, semi-peripheral, and peripheral positions, mimicking biopsies in three different locations. Genetic analysis of somatic copy number alterations (SCNAs) was performed on the three biopsies using Oncoscan, focusing on 45 preselected HNSCC genes of interest. Clinical relevance was assessed using the ESCAT score to investigate whether and how treatment decisions would change based on the three biopsies from the same tumor.
Results
The SCNAs identified among 45 preselected genes within the three tumor biopsies derived from the same tumor revealed distinct variations. The detected discrepancies could potentially influence treatment approaches or clinical decisions in 36% of the patients if only one tumor biopsy was used. Recurrent tumors exhibited significantly higher variation in SCNAs than primary tumors (p = .024). No significant correlation between tumor size and heterogeneity (p = .7) was observed.
Conclusion
In 36% of patients diagnosed with HNSCC, clinically significant intratumor heterogeneity was observed which may have implications for patient management. This finding substantiates the need for future studies that specifically investigate the clinical implications associated with intratumor heterogeneity.
Background
Intratumor heterogeneity in head and neck cancer has previously been described [Citation1–4], but studies addressing the clinical consequences of intratumor heterogeneity when using standard genomic diagnostics are lacking. We have previously reported substantial intratumor heterogeneity in PD-L1 expression, as measured by immunohistochemical assays, which has had direct implications for the management of patients with head and neck squamous cell carcinoma (HNSCC) [Citation5]. The purpose of this study was to investigate the effects of the exact site from which the tumor biopsy was taken on the results from genomic diagnostics. Additionally, the study sought to determine whether treatment or enrollment in clinical trials testing targeted therapy would vary depending on the biopsy site. Thus, we aimed to detail the practical clinical consequences of intratumor heterogeneity in a genomic medicine setting.
HNSCC constitutes a diverse disease concerning prognosis, genetics, and tumor biology [Citation6–9]. Biological variability exists between patients, within each patient, and within each tumor [Citation10]. Intratumor heterogeneity has been documented in various cancer types, including HNSCC. This study primarily centers on genetic heterogeneity, although other factors such as epigenetics and transcriptomics can also influence heterogeneity [Citation11–14].
Intratumor heterogeneity is manifested through variations in the mutational landscape across different areas of a tumor, potentially undermining the effectiveness of targeted therapies when relying solely on diagnostics from single biopsies [Citation1,Citation15–17]. This heterogeneity stems from distinct genetic subpopulations of cancer cells within the same tumor and can exist across various tumor regions or evolve over time [Citation6,Citation7]. Heterogeneity arises as a consequence of mutation, selection, and adaptation. Diagnostic methods, including analysis of somatic copy number alterations (SCNAs) [Citation18] and immunohistochemistry (IHC) [Citation19] of cancer-related biomarkers, can determine heterogeneity. Molecular profiling of tumors through SCNA analysis, which encompasses deletions or amplifications, can offer insights into intratumor heterogeneity and contribute to identifying eligible patients for targeted therapy [Citation18,Citation20]. Prior studies have focused on the genetic landscape of HNSCCs, initiating the identification of novel potential targets and targeted treatment alternatives for patients [Citation1,Citation8,Citation9,Citation21]. Understanding the biological drivers of cancer will lead to personalized cancer treatment [Citation21–23] and has motivated the development of frameworks such as the ESMO Scale for Clinical Actionability of Molecular Targets (ESCAT) [Citation14,Citation15].
However, heterogeneity presents a challenge for targeted treatment, as obtaining serial biopsies is seldom feasible, thus limiting the potential to detect inter- or intra-tumoral heterogeneity and to monitor tumor evolution and treatment response. Conversely, if heterogeneity is limited a single biopsy might be sufficient for diagnosis and patient stratification. In this study, we assessed the clinical relevance of genetic intratumor heterogeneity in HNSCC using the ESCAT scale [Citation24,Citation25].
Material and methods
Patient cohort
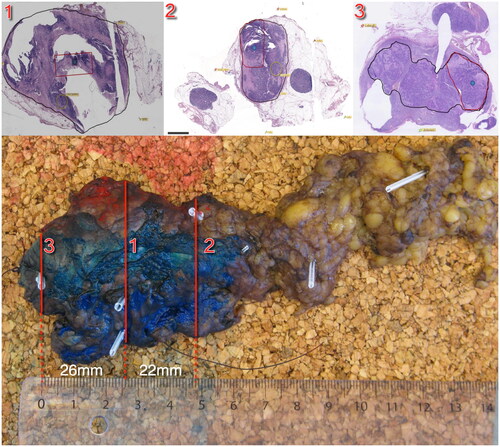
This prospective study included patients with primary or recurrent HNSCC referred for surgery with curative intent [Citation26]. All patients were scanned with an integrated PET/MRI scanner (Siemens Biograph mMR) before surgery using the PET tracer 18 F-fluorodeoxyglucose (FDG). The specimens were scanned with a 3D MRI, and each specimen scan was co-registered with the patient scan, as described in detail elsewhere. The data for this study was collected in a previous investigation [Citation26]. All tumors were removed en bloc and tumor specimens were fixed in formalin. From each tumor specimen, three tumor blocks were selected for sampling mimicking biopsies in three different locations, as illustrated in . Biopsy 1 was taken centrally in the tumor; biopsy 2 was taken in the semi-periphery of the tumor; and biopsy 3 was taken in the periphery of the tumor, either on the same side as the semi-peripheral biopsy or on the opposite side. The study was approved by the local ethics committee approval number H-16049387, and the protocol was published on clinicaltrials.gov (ID number NCT03160495).
Figure 1. Illustration of the pathological sectioning. This figure illustrates the pathological sectioning of the tumor specimen. The red lines indicate the locations of biopsies taken from block 1 (central), block 2 (semi-peripheral), and block 3 (peripheral). The top panels depict the specimen, with the black contour delineating the tumor tissue and the area where biopsies for genetic analyses were performed. Distances between the biopsies are indicated for reference.
Genetic analysis
DNA from FFPE-embedded tissue slides was extracted using GeneRead DNA FFPE Kit using QiaCube (Qiagen) according to the manufacturer’s instructions [Citation27]. The genetic analyses were performed using OncoScan™ CNV Plus Assay, Applied Biosystems™, Thermo Fisher Scientific [Citation18], which is a robust assay designed for formalin-fixed paraffin-embedded (FFPE) material and provides information about genome-wide SCNA and selected hotspot mutations [Citation28]. Sixty-four hotspot mutations from nine genes are detectable by OncoScan (Table 1, Supplemental), that is, EGFR, PIK3CA, PTEN, NRAS, KRAS, BRAF, IDH1, IDH2, and TP53. The OSCHP files generated by Oncoscan were processed by NEXUS software (BioDiscovery). The data was presented as LogR ratios of probe densities and as major and minor allele frequencies. These were used to assess SCNA, e.g., deletion, loss of heterozygosity (LOH), and amplification. The assay has a 50–100 kB copy number resolution. Somatic copy number alterations were used to determine the subclonal composition of the specimens and to draw dendrograms. Specifically, samples were clustered by similar aberration profiles using clustering algorithms (Average Linkage, nomclust [Citation29]).
These assays are highly sensitive to SCNA, also from formalin. However, they lack the capability for high-throughput analysis at a clinical-grade level. The data was therefore manually analyzed and curated by an expert in clinical diagnostics. Forty-five HNSCC-relevant genes were selected for this analysis (Table 2, supplemental). Eight of the 45 genes were chosen based on their association with cancer-related IHC biomarkers [Citation26]. The eight genes along with the IHC biomarker they are associated with are: CD274 (PDL1), MKI67 (KI-67), SLC2A1 (GLUT1), VEGF (VEGF), Bcl-2 (Bcl-2), CaIX (CAIX), EGFR (EGFR), and TP53 (TP53). Three of the 45 genes were selected based on their inclusion in a biomarker related to HNSCC, and these three genes, IKZF3, ARHGAP26, and CACNA1D, appear to be the most important [Citation30]. The remaining genes were selected based on literature; genes were selected if they were reported in multiple studies regarding HNSCC e.g., studies from The Cancer Genome Atlas (TCGA) [Citation9,Citation21,Citation22]. We specifically emphasized genes with biological relevance to HNSCC, that is, whether the genes frequently exhibited mutations or SCNA. The investigation of cancer-related IHC biomarkers has been thoroughly explored in preceding studies [Citation26]; consequently, this research did not incorporate an examination of these particular biomarkers.
The differences in SCNA between the three biopsies were illustrated with figures, grouped by patient number, biopsy location, and type of change in aberration. To assess the clinical relevance and implications of the differences in SCNA between the three biopsies reported in this study, the ESCAT scoring system, which aims to provide terminology and framework based on tiers into which current and future therapeutic targets may be assigned, was used to reflect their clinical relevance when selecting targeted treatment therapies for patients. ESCAT is a standardized tool designed to assess the clinical significance of molecular alterations in cancer patients. It enables oncologists to categorize these alterations into tiers, guiding treatment decisions and personalized therapy selection. The assignment of tiers to a target is based on the strength of evidence from clinical studies. ESCAT ranges from Tier I, indicating high clinical utility, to Tier X, indicating a lack of evidence. These tiers are defined based on factors such as the availability of targeted therapies, clinical trial evidence, and the level of scientific support for the association between the molecular alteration and the specific cancer type. For instance, Tier I alterations are associated with FDA-approved therapies for the same cancer type, while Tier X alterations may have limited or no supporting evidence [Citation24,Citation25].
To test the hypothesis that genetic dissimilarities or mutational burden increase with tumor size, the correlation between tumor volume defined from imaging with PET/MRI and the number of SCNA in the respective biopsies was assessed using Spearman correlation. The tumor volume was defined on anatomical MRI and FDG PET images by a radiologist and specialist in nuclear medicine. The Wilcoxon test was used to determine if the occurrence of SCNA was higher in recurrent tumors than in primary tumors. Statistical analyses were performed using SPSS version 25 and R version 4.1.2. Sinaplots [Citation31], and boxplots were used to visualize the number of SCNA between the three different biopsy locations and between the number of SCNA in recurrent tumors and primary tumors.
Results
Patients
Twenty-nine patients were eligible for inclusion. However, one patient had to be excluded because the specimen fragmented during histologic processing, leaving 28 patients with a total of 33 HNSCC tumor specimens for inclusion. From each of the 33 tumors, three tumor blocks were selected mimicking clinical biopsies in three different locations yielding a total of 99 biopsies available for analysis, and where one analysis failed. The mean distances between biopsies within each of the 33 tumors were calculated, and the overall mean distance between biopsies, averaged across all tumors, was 15.25 mm. Patient and tumor characteristics can be seen in . Sixteen patients were male, twelve were female, and the median age was 63 years (range 50–80). Of the 28 patients, 18 had a primary tumor and 10 patients had recurrent tumors. For all 10 cases with recurrence, the patient’s initial primary tumor treatment consisted of radiotherapy and in four of these chemotherapy with Cisplatin was also given. Sixteen patients had a tumor in the oral cavity, three in the hypopharynx/larynx, four in the oropharynx, and two patients had a tumor in the maxillary sinus invading the oral cavity. Three patients had only a lymph node metastasis and material from primary tumors was not available in these three patients. In five patients with both a primary tumor and a lymph node metastasis both tumors were analyzed.
Table 1. Patient characteristics.
Genetic results
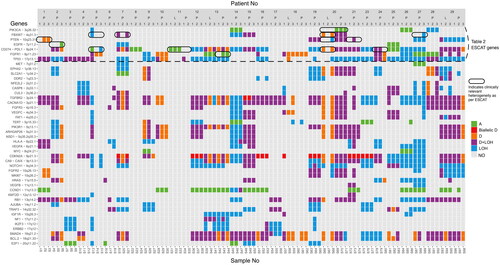
depicts the analysis of SCNA in the 45 preselected genes across all biopsies in the 33 tumors and illustrates that different SCNA were found between the three biopsies from the same tumor (). 15% of the tumors (5/33 tumors) had no differences in SCNA between the three biopsies. Of the five patients with homogenous tumors, two had a tumor in the oral cavity; one had a tumor in the oropharynx; and two had lymph node metastasis. Only one of the five patients with homogenous tumors had a recurrent tumor. In the remaining 28 tumors, differences were found in one or more genes among the three biopsies, indicating that intratumor heterogeneity was detected in 85% of the tumors. The genes that are most frequently altered, as per the TCGA [Citation9], and can also be detected by Oncoscan, were analyzed for the frequency of genetic alterations. The EGFR gene had relevant genetic alterations in 7.1% of the patients, SMAD in 53.4%, PTEN in 21.4%, PIK3CA in 10.7%, MYC in 7.1%, CDKN2A in 53.4%, NOTCH1 in 10.7%, and TP53 exhibited mutations in 25%, which is consistent with previous studies in the literature [Citation9,Citation32–39].
Figure 2. Illustration of SCNAs detected in 45 preselected genes in biopsies from the 33 tumors. The Y-axis depicts the 45 preselected genes and the X-axis depicts the biopsies grouped and ordered by patient number. At the bottom, sample numbers are visible. The three entries for each tumor correspond to the three biopsy positions: the central biopsy is labeled as 1, the semi-peripheral biopsy as 2, and the peripheral biopsy as 3. Primary tumors and lymph node metastases are indicated with P and L respectively. The color bar to the right displays the actual aberration in the specific gene. Abbreviations. A: amplification; D: deletion; LOH: loss of heterozygosity; NO: none observed. The genes above the dashed horizontal line correspond to and the results marked with a circle indicate clinically relevant heterogeneity in genes in as well.
Genomic diversity across tumor regions
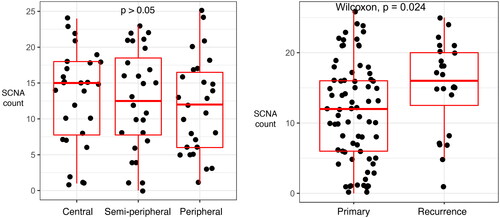
The number of SCNAs did not differ between the three biopsy locations (central and semi-peripheral; central and peripheral; semi-peripheral and peripheral) ( panel A) and there was only a small variation in types of SCNAs between the three different biopsy locations (Supplemental Figure 1). However, recurrent tumors had significantly more SCNA than new primary tumors (p = 0.024, Wilcoxon) ( panel B).
Figure 3. Sinaplots and boxplots illustrate differences in numbers of SCNAs. The Y-axis depicts the number of SCNAs and the X-axis depicts the biopsy location (left panel) or the primary versus recurrent disease (right panel). Each dot in both panels represents one of the biopsies. The left panel depicts the number of SCNA in a biopsy, grouped by the biopsy location in the tumor (central, semi-peripheral, and peripheral). The right panel depicts the number of SCNA in a biopsy, grouped by new primary and recurrent disease.
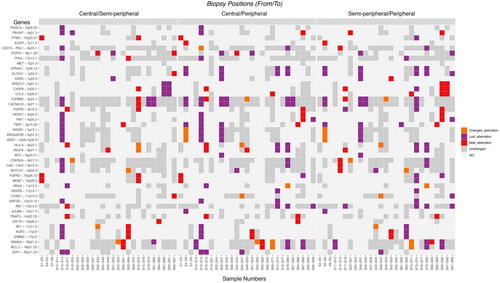
illustrates the type of change between the biopsies taken from the same tumor. Comparing the three biopsy locations for each gene the amounts of new, lost, and changed aberrations are distributed quite evenly (). Comparing the central and semi-peripheral biopsies, 6 had a changed aberration, 36 had a lost aberration, and 27 had a new aberration. Comparing the central and peripheral biopsies, 11 had a changed aberration, 68 had a lost aberration, and 23 had a new aberration. Finally, comparing the semi-peripheral and peripheral biopsies, 12 had a changed aberration, 62 had a lost aberration, and 26 had a new aberration. In line with this, there was no significant correlation between tumor volume, as determined by PET/MRI, and the numbers of SCNA in the respective biopsies (p = 0.7; tested with Spearman Rank correlation).
Figure 4. Illustration of the type of change in SCNAs between the three biopsies. The Y-axis depicts the 45 preselected genes and the X-axis depicts biopsies from primary tumors grouped by biopsy location (central and semi-peripheral; central and peripheral; semi-peripheral and peripheral). At the bottom, sample numbers are visible. Left: the differences between central and semi-peripheral biopsies amount to 6 changed aberrations, 36 lost aberrations, and 27 new aberrations. Middle: the differences between central and peripheral biopsies: 11 changed, 68 lost, and 23 new aberrations. Right: the differences between semi-peripheral and peripheral biopsies: 12 changed, 62 lost, and 26 new aberrations. The color bar to the right depicts the type of aberration. Abbreviations. A: amplification; D: deletion; LOH: loss of heterozygosity; NO: none observed.
ESCAT scoring
The ESCAT scoring system was used to assess clinical relevance and to illustrate the potential implication of taking a biopsy in one place versus another. In total, 7 genes with heterogeneity in SCNAs or hotspot mutations were assessed to potentially predict response or lack of response to targeted therapies according to ESCAT. The genes include PIK3CA, FBXW7, EGFR, FGFR1, CD274 (PD-L1), PTEN, and TP53. Differences in SCNA or hotspot mutations in genes that potentially could influence the use or choice of targeted therapy were observed in 36% of the patients (10/28 patients; 10/33 tumors), see and . For example, analysis of the peripheral biopsy of tumor two would make the patient a candidate for EGFR inhibitor treatment as opposed to selecting the central or semi-peripheral biopsy (, ), illustrating the clinical impact of genetic intratumor heterogeneity.
Table 2. ESCAT score of assessable SCNAs and hotspot mutations with relevant findings in the current population.
Table 3. The 10 tumors with heterogeneity in SCNAs and hotspot mutations with potential clinical relevance and the implications for therapy.
Intertumor heterogeneity between tumor and metastasis
Intertumor heterogeneity could be investigated in five of the patients with both a primary tumor and a lymph node metastasis (Figure 2 supplemental). Two of the four patients with intertumor heterogeneity had assessable alterations included in the ESCAT score. Examining biopsy samples from primary tumor 20 could potentially categorize the patient as a suitable candidate for PI3K inhibitor therapy. However, this conclusion contrasts with the analysis derived from biopsy samples obtained from lymph node metastases in the same patient (). Patient 11 also illustrates intertumor heterogeneity between the primary tumor and lymph node metastasis. An investigation of biopsy samples from the lymph node metastasis suggests that the patient could benefit from an immune checkpoint inhibitor due to the amplification in CD274. However, this inference diverges from the analysis conducted on biopsy samples of the primary tumor in the same patient, which lack amplification ().
Discussion
While intratumor heterogeneity has been acknowledged and characterized in various cancer types in past literature [Citation1,Citation15–17,Citation46,Citation47], its implications remain underestimated, especially given the growing preference for precision medicine in oncology. The heterogeneity within individual tumors presents a challenge that could hinder the development of personalized cancer treatment [Citation48], and the previous discussions on the consequences of intratumor genomic heterogeneity in patients with oral squamous cell carcinoma involved smaller patient cohorts and employed less sensitive methods than the microarray technology utilized in our study [Citation49–51]. This study has focused on the potential clinical consequence of intratumor heterogeneity on treatment decisions based on single tumor biopsies, as performed in normal clinical routines. The primary objective of this study was to assess the implications of implementing targeted treatments or patient stratification based on a single biopsy, a scenario commonly encountered in daily clinical practice. Out of the 33 whole tumor specimens, three tumor blocks were chosen from distinct locations (central, semi-peripheral, and peripheral) to simulate scenarios where alternative sites might have been selected for biopsy.
In routine clinical contexts, single biopsies are extracted from one location within tumors, serving as the basis for decision-making regarding subsequent treatments. Choosing a different biopsy location could yield varying findings and impact treatment decisions. The absence of a consensus regarding the formal estimation and reporting of tumor heterogeneity, both in general and clinical settings, continues to pose challenges in the field of precision medicine. The ESCAT system aims to standardize and unify reporting in personalized medicine but is still undergoing improvement [Citation52,Citation53]. Nonetheless, this study is an illustration of whether genetic-level heterogeneity can have potential therapeutic significance and whether there is heterogeneity in terms of the variants included in ESCAT. For example, there are drugs in development targeting FGFR1 (2019–004771-40) and PIK3CA (2020-005057-24), and since these genes exhibit heterogeneity in our study (), one should exercise caution when performing biopsies and consider genetic-level heterogeneity. This is because, with one biopsy, an individual may be a candidate for a study, while with another biopsy, they may not be.
The assessment of intratumor heterogeneity through SCNAs could potentially have clinical implications for specific targeted treatments in 36% of the patients included in this study. This information is relevant in a clinical setting where patients are stratified for treatments or trials based on biomarkers and genetic profiling.
Regarding the genomic variation between the primary tumor and lymph node metastasis, the results, for example, demonstrated that biopsy samples from primary tumor 20 could potentially classify the patient as a suitable candidate for PIK3 inhibitor therapy. However, this contrasts with the analysis derived from biopsy samples obtained from lymph node metastases in the same patient. Conversely, the lymph node metastasis may benefit from a GAKi due to copy number loss in FBXW7 (). Based on the genetic findings, one could therefore argue that a combination of drugs, rather than a single agent, might be a more optimal choice.
The intratumor heterogeneity assessed with SCNA was small. However, in many patients, a change in the type of aberration between the three biopsies was observed, suggesting a degree of genomic instability. This finding supports the hypothesis that HNSCC is characterized by genomic instability, which could lead to clonal diversity [Citation1]. It might be expected that a gradual shift from central to peripheral focus would also continuously reveal an increasing number of new mutations. Nevertheless, we found no pattern in aberrations concerning location. Aberrations were both lost and acquired in each direction, and based on our observations, clonal evolution cannot be confirmed. Even when considering the assay’s detection limits, the loss of aberrations between tumor sites in the tumor still indicates a proportional development in cellular composition that is not only spatially accumulative in terms of the genetic aberrations we observed.
There was a significant increase in the number of SCNAs between new primary and recurrent tumors (, right panel). Causality between the number of genomic variants and recurrence or vice versa remains unknown. However, even though it is statistically significant, it is essential to bear in mind that primary and recurrent tumors were not matched pairs, and the interpretation should consider the relatively limited numbers involved in this comparison.
Forty-five genes relevant to HNSCC were chosen and subjected to manual analysis in this study. A potential concern arises from the possibility that employing an alternative set of genes could lead to disparate outcomes, thereby underscoring a potential limitation of the research. Additionally, the study is constrained by the limited sample size of patients.
Tumor ecology provides a perspective on cancer biology, emphasizing the complex interplay between cancer cells and their surroundings. This approach has the potential to enhance our understanding of cancer development, progression, and treatment strategies [Citation54].
The current research emphasizes the complexity and diversity that exists within individual tumors on a genetic level. This fact has vast implications for diagnosis, prognosis, and therapeutic strategies in oncology. The genomic variability within tumors contributes significantly to the complexity of precision medicine in oncology. Considering the results reported here, it could be argued that a single biopsy might not capture the complete mutational landscape of the tumor, potentially affecting treatment decisions and inclusion in clinical trials.
Conclusion
In the current study, the identified discrepancies have the potential to influence treatment approaches or clinical decisions in 36% of the patients if only a single tumor biopsy was used. Within a clinical context, single biopsies extracted from a specific location serve as the foundation for making decisions about eventual treatment. Consequently, choosing a different biopsy location could impact the treatment decision. We observed a greater number of SCNA in recurrent tumors compared to primary tumors, yet we did not find any association between tumor size and heterogeneity. This underscores the significance of considering the potential impact of intratumor heterogeneity in both research and clinical application of targeted therapies.
Ethical approval
The study was approved by The Committees on Health Research Ethics in the Capital Region of Denmark, approval number H-16049387. The study was conducted in accordance with the Declaration of Helsinki. The protocol was published on clinicaltrials.gov (NCT03160495).
Informed consent
All patients provided informed consent to participate in the study.
Supplemental Material
Download MS Word (12.1 KB)Supplemental Material
Download PDF (83 KB)Supplemental Material
Download PDF (389.3 KB)Supplemental Material
Download MS Word (19.4 KB)Supplemental Material
Download MS Word (20.5 KB)Disclosure statement
No potential conflict of interest was reported by the author(s).
Data availability statement
The data set used and analyzed during the study is available from the corresponding author upon reasonable request.
Additional information
Funding
References
- Zhang XC, Xu C, Mitchell RM, et al. Tumor evolution and intratumor heterogeneity of an oropharyngeal squamous cell carcinoma revealed by whole-genome sequencing. Neoplasia. 2013;15(12):1371–1378. doi:10.1593/neo.131400.
- Canning M, Guo G, Yu M, et al. Heterogeneity of the head and neck squamous cell carcinoma immune landscape and its impact on immunotherapy. Front Cell Dev Biol. 2019;7(APR):52. doi:10.3389/fcell.2019.00052.
- Mroz EA, Tward AM, Hammon RJ, et al. Intra-tumor genetic heterogeneity and mortality in head and neck cancer: analysis of data from the cancer genome atlas. PLoS Med. 2015;12(2):e1001786. doi:10.1371/journal.pmed.1001786.
- Abécassis J, Hamy AS, Laurent C, et al. Assessing reliability of intra-tumor heterogeneity estimates from single sample whole exome sequencing data. PLoS One. 2019;14(11):e0224143. doi:10.1371/journal.pone.0224143.
- Rasmussen JH, Lelkaitis G, Håkansson K, et al. Intratumor heterogeneity of PD-L1 expression in head and neck squamous cell carcinoma. Br J Cancer. 2019;120(10):1003–1006. doi:10.1038/s41416-019-0449-y.
- Bedard PL, Hansen AR, Ratain MJ, et al. Tumour heterogeneity in the clinic. Nature. 2013;501(7467):355–364. doi:10.1038/nature12627.
- Yap TA, Gerlinger M, Futreal PA, et al. Intratumor heterogeneity: seeing the wood for the trees. Sci Transl Med. 2012;4(127):127ps10. Mar. doi:10.1126/scitranslmed.3003854.
- Pérez Sayáns M, Chamorro Petronacci CM, Lorenzo Pouso AI, et al. Comprehensive genomic review of TCGA Head and Neck Squamous Cell Carcinomas (HNSCC). J Clin Med. 2019;8(11):1896. doi:10.3390/jcm8111896.
- Lawrence MS, Sougnez C, Lichtenstein L, et al. Comprehensive genomic characterization of head and neck squamous cell carcinomas. Nature. 2015;517(7536):576–582.
- Mroz EA, Rocco JW. The challenges of tumor genetic diversity. Cancer. 2017;123(6):917–927. doi:10.1002/cncr.30430.
- Kürten CHL, Kulkarni A, Cillo AR, et al. Investigating immune and non-immune cell interactions in head and neck tumors by single-cell RNA sequencing. Nat Commun. 2021;12(1):7338. doi:10.1038/s41467-021-27619-4.
- Schinke H, Shi E, Lin Z, et al. A transcriptomic map of EGFR-induced epithelial-to-mesenchymal transition identifies prognostic and therapeutic targets for head and neck cancer. Mol Cancer. 2022;21(1):178. doi:10.1186/s12943-022-01646-1.
- Puram SV, Tirosh I, Parikh AS, et al. Single-cell transcriptomic analysis of primary and metastatic tumor ecosystems in head and neck cancer. Cell. 2017;171(7):1611–1624.e24. doi:10.1016/j.cell.2017.10.044.
- Gaździcka J, Gołąbek K, Strzelczyk JK, et al. Epigenetic modifications in head and neck cancer. Biochem Genet. 2020;58(2):213–244. doi:10.1007/s10528-019-09941-1.
- Christgen M, Bartels S, van Luttikhuizen JL, et al. Subclonal analysis in a lobular breast cancer with classical and solid growth pattern mimicking a solid-papillary carcinoma. J Pathol Clin Res. 2017;3(3):191–202. doi:10.1002/cjp2.76.
- Cao W, Wu W, Yan M, et al. Multiple region whole-exome sequencing reveals dramatically evolving intratumor genomic heterogeneity in esophageal squamous cell carcinoma. Oncogenesis. 2015;4(11):e175. doi:10.1038/oncsis.2015.34.
- Gerlinger M, Rowan AJ, Horswell S, et al. Intratumor heterogeneity and branched evolution revealed by multiregion sequencing. N Engl J Med. 2012;366(10):883–892. doi:10.1056/NEJMoa1113205.
- Østrup O, Ahlborn LB, Lassen U, et al. Detection of copy number alterations in cell-free tumor DNA from plasma. BBA Clin. 2017;7:120–126. doi:10.1016/j.bbacli.2017.03.006.
- Rasmussen JH, Olin AB, Lelkaitis G, et al. Intratumor heterogeneity is biomarker specific and challenges the association with heterogeneity in multimodal functional imaging in head and neck squamous cell carcinoma. Eur J Radiol. 2021;139:109668. doi:10.1016/j.ejrad.2021.109668.
- Esteves L, Caramelo F, Ribeiro IP, et al. Probability distribution of copy number alterations along the genome: an algorithm to distinguish different tumour profiles. Sci Rep. 2020;10(1):14868. doi:10.1038/s41598-020-71859-1.
- Leemans CR, Braakhuis BJM, Brakenhoff RH. The molecular biology of head and neck cancer. Nat Rev Cancer. 2011;11(1):9–22. doi:10.1038/nrc2982.
- Hoesli RC, Ludwig ML, Michmerhuizen NL, et al. Genomic sequencing and precision medicine in head and neck cancers. Eur J Surg Oncol. 2017;43(5):884–892. doi:10.1016/j.ejso.2016.12.002.
- Cramer JD, Burtness B, Le QT, et al. The changing therapeutic landscape of head and neck cancer. Nat Rev Clin Oncol. 2019;16(11):669–683. doi:10.1038/s41571-019-0227-z.
- Marret G, Bièche I, Dupain C, et al. Genomic alterations in head and neck squamous cell carcinoma: level of evidence according to ESMO scale for clinical actionability of molecular targets (ESCAT). J Clin Oncol Precis Oncol. 2021;5:215–226. doi:10.1200/PO.20.00280.
- Mateo J, Chakravarty D, Dienstmann R, et al. A framework to rank genomic alterations as targets for cancer precision medicine: the ESMO Scale for Clinical Actionability of molecular Targets (ESCAT). Ann Oncol. 2018;29(9):1895–1902. doi:10.1093/annonc/mdy263.
- Rasmussen JH, Olin A, Lelkaitis G, et al. Does multiparametric imaging with 18F-FDG-PET/MRI capture spatial variation in immunohistochemical cancer biomarkers in head and neck squamous cell carcinoma? Br J Cancer. 2020;123(1):46–53. doi:10.1038/s41416-020-0876-9.
- QIAGEN. GeneRead DNA FFPE Handbook. GeneRead DNA FFPE Handb. 2014;(February):1–18. https://www.qiagen.com/us/resources/download.aspx?id=e8894854-8dc7-4318-8b1f-fa094286e4c0&lang=en
- Ciriello G, Miller ML, Aksoy BA, et al. Emerging landscape of oncogenic signatures across human cancers. Nat Genet. 2013;45(10):1127–1133. doi:10.1038/ng.2762.
- Sulc Z, Cibulkova J, Rezankova H, et al. nomclust: hierarchical cluster analysis of nominal data. R package version 2.5.0. 2021. https://cran.r-project.org/package=nomclust
- Gleber-Netto FO, Rao X, Guo T, et al. Variations in HPV function are associated with survival in squamous cell carcinoma. JCI Insight. 2019;4(1):1–17. doi:10.1172/jci.insight.124762.
- Sidiropoulos N, Sohi SH, Pedersen TL, et al. SinaPlot: an enhanced chart for simple and truthful representation of single observations over multiple classes. J Comput Graph Stat. 2018;27(3):673–676. doi:10.1080/10618600.2017.1366914.
- Hernandez AL, Young CD, Wang JH, et al. Lessons learned from SMAD4 loss in squamous cell carcinomas. Mol Carcinog. 2019;58(9):1648–1655. doi:10.1002/mc.23049.
- Klinakis A, Rampias T. TP53 mutational landscape of metastatic head and neck cancer reveals patterns of mutation selection. EBioMedicine. 2020;58:102905. doi:10.1016/j.ebiom.2020.102905.
- Squarize CH, Castilho RM, Abrahao AC, et al. PTEN deficiency contributes to the development and progression of head and neck cancer. Neoplasia. 2013;15(5):461–471. doi:10.1593/neo.121024.
- Maiti GP, Mondal P, Mukherjee N, et al. Overexpression of EGFR in head and neck squamous cell carcinoma is associated with inactivation of SH3GL2 and CDC25A genes. PLoS One. 2013;8(5):e63440. doi:10.1371/journal.pone.0063440.
- Field JK, Spandidos DA, Stell PM, et al. Elevated expression of the c-myc oncoprotein correlates with poor prognosis in head and neck squamous cell carcinoma. Oncogene an Int Journal. 1989;4(12):1463–1468.
- Rodrigo JP, Lazo PS, Ramos S, et al. MYC amplification in squamous cell carcinomas of the head and neck. Arch Otolaryngol Head Neck Surg. 1996;122(5):504–507. doi:10.1001/archotol.1996.01890170038008.
- Suda T, Hama T, Kondo S, et al. Copy number amplification of the PIK3CA gene is associated with poor prognosis in non-lymph node metastatic head and neck squamous cell carcinoma. BMC Cancer. 2012;12(1):416. doi:10.1186/1471-2407-12-416.
- Shah PA, Huang C, Li Q, et al. NOTCH1 signaling in head and neck squamous cell carcinoma. Cells. 2020;9(12):2677. doi:10.3390/cells9122677.
- Dolly SO, Gurden MD, Drosopoulos K, et al. RNAi screen reveals synthetic lethality between cyclin G-associated kinase and FBXW7 by inducing aberrant mitoses. Br J Cancer. 2017;117(7):954–964. doi:10.1038/bjc.2017.277.
- Cohen EEW, Licitra LF, Burtness B, et al. Biomarkers predict enhanced clinical outcomes with afatinib versus methotrexate in patients with second-line recurrent and/or metastatic head and neck cancer. Ann Oncol. 2017;28(10):2526–2532. doi:10.1093/annonc/mdx344.
- Nogova L, Sequist LV, Garcia JMP, et al. Evaluation of BGJ398, a fibroblast growth factor receptor 1-3 kinase inhibitor, in patientswith advanced solid tumors harboring genetic alterations in fibroblast growth factor receptors: results of a global phase I, dose-escalation and dose-expansion stud. J Clin Oncol. 2017;35(2):157–165. doi:10.1200/JCO.2016.67.2048.
- Burtness B, Rischin D, Greil R, et al. Pembrolizumab alone or with chemotherapy for recurrent/metastatic head and neck squamous cell carcinoma in KEYNOTE-048: subgroup analysis by programmed death ligand-1 combined positive score. J Clin Oncol. 2022;40(21):2321–2332. doi:10.1200/JCO.21.02198.
- Zhao P, Su X, Ge T, et al. Pathway-specific genome editing of PI3K/mTOR tumor suppressor genes reveals that PTEN loss contributes to cetuximab resistance in head and neck cancer. Physiol Behav. 2016;176(1):139–148.
- Dumbrava EE, Johnson ML, Tolcher AW, et al. First-in-human study of PC14586, a small molecule structural corrector of Y220C mutant p53, in patients with advanced solid tumors harboring a TP53 Y220C mutation. J Clin Oncol. 2022;40(16_suppl):3003–3003. doi:10.1200/JCO.2022.40.16_suppl.3003.
- Gerlinger M, Wu B, Williams K, et al. Genomic architecture and evolution of clear cell renal cell carcinomas defined by multiregion sequencing. Am J Cancer Res. 2015;15(3):668–679. http://genomebiology.com/2014/15/8/448
- van Dijk E, van den Bosch T, Lenos KJ, et al. Chromosomal copy number heterogeneity predicts survival rates across cancers. Nat Commun. 2021;12(1):3188. doi:10.1038/s41467-021-23384-6.
- van de Haar J, Hoes LR, Roepman P, et al. Limited evolution of the actionable metastatic cancer genome under therapeutic pressure. Nat Med. 2021;27(9):1553–1563. doi:10.1038/s41591-021-01448-w.
- Wang L, Wang X, Jia Y, et al. Intratumoural heterogeneity and clone evolution of oral squamous cell carcinoma. Mol Carcinog. 2021;60(11):758–768. doi:10.1002/mc.23341.
- Zandberg DP, Tallon LJ, Nagaraj S, et al. Intratumor genetic heterogeneity in squamous cell carcinoma of the oral cavity. Head Neck. 2019;41(8):2514–2524. doi:10.1002/hed.25719.
- Gabrielaite M, Torp MH, Rasmussen MS, et al. A comparison of tools for copy-number variation detection in germline whole exome and whole genome sequencing data. Cancers (Basel). 2021;13(24):6283. doi:10.3390/cancers13246283.
- Silver AJ, Warner JL. ESCAT: a step in the right direction. Ann Oncol. 2018;29(11):2266–2267. doi:10.1093/annonc/mdy409.
- Gyawali B, Kesselheim AS. The promise of ESCAT: a new system for evaluating cancer drug–target pairs. Nat Rev Clin Oncol. 2019;16(3):147–148. doi:10.1038/s41571-018-0110-3.
- Luo W. Nasopharyngeal carcinoma ecology theory: cancer as multidimensional spatiotemporal “Unity of ecology and evolution” pathological ecosystem. Theranostics. 2023;13(5):1607–1631. doi:10.7150/thno.82690.