
Abstract
Objective: To assess health outcomes and the economic burden of hypoglycemia in older patients with type 2 diabetes initiating basal insulin (BI).
Research design and methods: Medicare Advantage claims data were extracted for patients with type 2 diabetes initiating BI and patients were stratified into two groups: those with medically attended hypoglycemia during the first year of BI treatment (HG group) and those without (non-HG group). Main outcome measures were hospitalization, mortality, healthcare utilization and costs 1 year before and 1 year after BI initiation.
Results: Of 31,035 patients included (mean age 72 years [SD 9.2]), 3066 (9.9%; HG group) experienced hypoglycemia during 1 year post-BI initiation. After adjustment for demographic, comorbidity and medication history, hypoglycemia was associated with risk of hospitalization (HR 1.59; 95% CI: 1.53–1.65) and death (HR 1.50; 95% CI: 1.40–1.60). Healthcare utilization was higher pre-index and showed greater increases post-BI initiation in the HG vs. the non-HG group. Per-patient healthcare costs were substantially higher for the HG group than the non-HG group, both pre-index ($54,057 vs. $30,249, respectively) and post-BI initiation ($75,398 vs. $27,753, respectively).
Conclusions: Based on available claims data, hypoglycemia during the first year of BI treatment is associated with risk of hospitalization or death in older people, increasing healthcare utilization and costs. Due to the observational nature of this study, causality cannot be attributed, and further prospective studies into the effect of hypoglycemia on health outcomes in this population are warranted.
Introduction
Intensive treatment regimens to lower blood glucose levels can reduce the long-term complications associated with diabetesCitation1–3. However, iatrogenic hypoglycemia is a critical barrier to achieving target glycemic control, causing considerable morbidity and sometimes fatal consequences, and further impairing patient defenses against future hypoglycemic episodesCitation4. Type 2 diabetes tends to be a progressive disease, with many patients ultimately requiring insulin to maintain blood glucose levelsCitation5. Insulin use is associated with an increased risk of hypoglycemia episodes, and physicians often adopt an overly cautious approach to prescribing insulin, specifically citing concerns about hypoglycemia as a contributory factorCitation6,Citation7. Many patients prefer to delay insulin initiation because of fear of hypoglycemia, and others may reduce their insulin dose following such an episode, irrespective of severityCitation8,Citation9.
Older patients with type 2 diabetes are at increased risk of experiencing severe hypoglycemic events compared with younger groups, a concern that is further augmented upon basal insulin (BI) initiationCitation10. Hypoglycemic episodes in older people frequently require medical assistance, with adults aged >75 years old almost three times as likely to present to an emergency department due to a hypoglycemic episode compared with the overall adult diabetic populationCitation10,Citation11. Each medically treated hypoglycemic episode is estimated to cost in excess of $1100Citation12. The over 65 years age group represents the fastest growing diabetes population in the USCitation13; in combination with an aging population, the resource and budget investment required to manage insulin-related hypoglycemia is expected to escalate.
It is therefore timely to evaluate the burden of hypoglycemia during insulin therapy in older patients with type 2 diabetes. Medicare Advantage (Medicare Part C) is a healthcare management scheme covering hospital (Part A), medical (Part B) and pharmacy (Part D) payments. This population is distinct because it is mostly limited to patients aged ≥65 years. Furthermore, the integrated nature of the Medicare Advantage healthcare policy permits a comprehensive analysis of healthcare utilization in a population with good access to healthcare. Here we present a retrospective analysis of a Medicare Advantage insurance claims database of older patients initiating BI treatment, assessing the influence of comorbidities and drug pattern use on hypoglycemic risk, the consequences of hypoglycemia in terms of hospitalization and mortality rates, and healthcare utilization and the economic impact of hypoglycemia.
Patients and methods
Data extraction
A Medicare Advantage claims database (Optum Clinformatics Data Mart) was retrospectively screened for patients with type 2 diabetes making a first pharmacy claim for a BI (index date) between 1 January 2007 and 31 December 2012. Type 2 diabetes was determined by a recorded diagnosis and use of either oral antihyperglycemic drugs (OADs) or glucagon-like peptide-1 (GLP-1) analogs.
Inclusion/exclusion criteria
Patients were included if they had previously used OADs/GLP-1 analogs, if they initiated insulin treatment on a BI-only regimen, and had at least 2 years of continuous Medicare Advantage coverage (1 year both pre- and post-index date). Patients were excluded if they had previously used insulin. Prandial insulin use during the follow-up period was permitted.
Measured outcomes
Subject characteristics during the pre-index period (age, gender, comorbidities) were ascertained from the claims database, and age was taken to be that at the index date. The Charlson comorbidity index score was used to assess the overall burden of comorbidity; this index assigns a weighted score of 1 to 6 to each comorbid condition related to the impact on risk of mortalityCitation14.
Diabetes-related medication was recorded pre-index and during follow-up. Non-insulin medications were analyzed based on their risk of inducing hypoglycemia; insulin secretagogues (sulfonylureas and meglitinides) were classified as antihyperglycemic drugs (ADs) with a high risk of inducing hypoglycemia (high-risk ADs), and biguanides (metformin), thiazolidinediones, GLP-1 analogs, and dipeptidyl peptidase-4 (DPP-4) inhibitors were classified as ADs with a low risk of inducing hypoglycemia (low-risk ADs).
Treatment costs and overall healthcare utilization were captured during the 12 month pre-index date and at least 12 months post-indexing. Hospitalization and mortality rates, including time to death, were recorded during the total follow-up period.
Medically attended hypoglycemia events were identified from the Medicare Advantage claims database by retrieving any healthcare encounter with an ICD-9 diagnosis code of 251.0, 251.1, 251.2 or 250.8. The use of medical claims data, by definition, means that the hypoglycemic events recorded are likely to be symptomatic and towards the severe end of the spectrum that require medical assistance; however, in some cases, hypoglycemia may be recorded secondary to medical attention necessitated by another health issue (e.g. following a fall). Subjects were categorized into those who had experienced one or more medically attended episodes of hypoglycemia during 1 year follow-up post-BI initiation (the HG group) and those who did not (the non-HG group).
Hypoglycemia burden, healthcare resource utilization and costs were compared between the HG group and the non-HG group. To evaluate the potentially confounding influence of prandial insulin initiation alongside BI, outcomes were also evaluated for BI-only users.
Statistical methods
Descriptive statistics of subject characteristics were reported, including mean and SD for continuous variables and percentage of subjects within each category for categorical variables. Univariate analyses, comparing the HG group with the non-HG group, were conducted with a two-sample t-test for continuous variables and chi-square test for categorical variables.
For risk of hospitalization and death, a Cox proportional hazard model was applied, with medically attended hypoglycemia as the time-varying covariate, adjusting for demographic, comorbidity and medication history factors that were retained from a stepwise model selection. A sensitivity analysis to assess outcomes in BI-only users was performed, excluding patients who commenced treatment with prandial insulin during the 1 year following BI initiation.
HRs with associated 95% CIs were calculated after mutual adjustment. Three sensitivity analyses were conducted for the mortality modeling: analyzing mortality risk amongst (a) the population with either myocardial infarction (MI), congestive heart failure (CHF), peripheral vascular disease (PVD) or stroke; (b) the population with MI, CHF, PVD, stroke, dementia or renal disease; and (c) the population without cancer.
To address the skewed distribution of healthcare expenditure, costs were analyzed assuming a gamma distribution with logarithm linkage and adjustment for baseline characteristics.
Results
Population characteristics
Between 1 January 2007 and 31 December 2012, 1.5 million patients with type 2 diabetes were identified in the claims database, of whom 259,000 (28.4%) initiated BI therapy. A total of 31,035 patients met the inclusion criteria and were included in the analysis population. The analyzed population was of older age (mean age 72 years), with high levels of comorbidity and poor overall glycemic control prior to initiating BI ().
Table 1. Pre-index characteristics of the HG and non-HG groups.
Of the 31,035 patients included in the study, 9.9% (n = 3066, HG group) experienced ≥1 episode of medically attended hypoglycemia during the first year post-index and the rest did not (n = 27,969, non-HG group). Patients in the HG group experienced a mean number of 4.5 (SD: 12.0) hypoglycemic events each. The total mean duration of patient follow-up after the initiation of BI was 2.78 years in the HG group and 2.94 years in the non-HG group.
The pre-index characteristics of the HG and non-HG groups are shown in . Patients who experienced hypoglycemia tended to be slightly older than those who did not experience hypoglycemia (73 vs. 72 years, respectively; p = 0.0015). Data on glycemic control, assessed by HbA1c and fasting blood glucose, were only available for a subset of patients but appeared to be comparable between the groups.
All patients were treated with either OADs or GLP-1 analogs during the pre-index period, as per the study requirements. A slightly higher proportion of patients in the HG group were using sulfonylureas during the pre-index period than the non-HG group (79.9% and 77.9%, respectively; p = 0.0109), whereas a lower proportion of patients in the HG group were using metformin, thiazolidinediones, DPP-4 inhibitors and/or GLP-1 analogs (p ≤ 0.001 for all) (). The HG group had a greater use of high-risk ADs compared with the non-HG group (80.9% vs. 78.9%, p = 0.0110; ). There was an even greater between-group difference in use of low-risk ADs: 81.9% in the HG group vs. 85.8% in the non-HG group (p < 0.0001) ().
Diabetes-related complications and comorbidities
The HG group were more likely than the non-HG group to have non-diabetes comorbid conditions during the pre-index period (Charlson comorbidity index excluding diabetes 2.64 vs. 1.72, respectively, p < 0.0001) (). With the exception of moderate or severe liver disease and acquired immune deficiency syndrome/human immunodeficiency virus (AIDS/HIV), all comorbidities were more prevalent in the HG group than the non-HG group during the pre-index period (Supplementary Table 1).
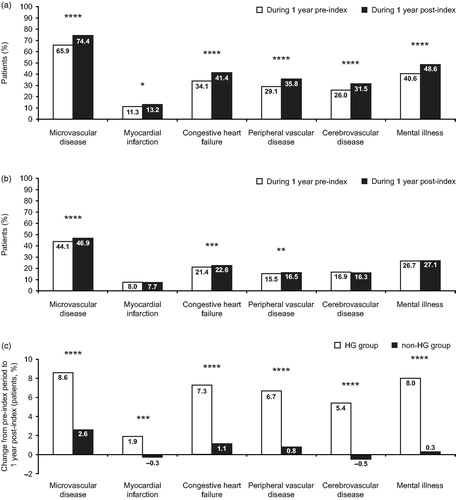
Not only were pre-index comorbidities more common in the HG group than among the non-HG group, but rates of macrovascular (MI, CHF, PVD and cerebrovascular disease) and microvascular (retinopathy, neuropathy and nephropathy) complications increased by 1.9–8.5% in the HG group during follow-up (). By comparison, post-index levels of these complications or comorbidities remained relatively stable in the non-HG group, showing modest increases in microvascular disease, CHF and PVD (change −0.6–2.8%) (). The change in comorbidity prevalence from the pre-index period to during 1 year of follow-up was significantly higher in the HG group than the non-HG group ().
Figure 1. Comorbidity prevalence during the pre- and post-index periods in (A) the HG group and (B) the non-HG group. White bars, during 1 year pre-index; dark grey bars, during 1 year post-index. (C) Change in comorbidity prevalence from the pre-index to the post-index period in both HG and non-HG groups. White bars, HG group; dark grey bars, non-HG group. *p < 0.05; **p < 0.01; ***p < 0.001; ****p < 0.0001. BI, basal insulin; HG, hypoglycemia. Only the comorbidities that are significant factors in the baseline models are shown. Microvascular disease comprises retinopathy, neuropathy and nephropathy. HG group defined as those experiencing a hypoglycemic event during 1 year following BI initiation (3066/31,035, 9.9%). Non-HG group defined as those who did not experience a hypoglycemic event during 1 year following BI initiation (27,969/31,035, 90.1%).
Pattern of drug use following BI initiation
OAD use was lower during the follow-up period than during the pre-index period, with 85.5% of the total patient cohort recording use of at least one OAD (compared with 99.6% pre-index). Similar to the pre-index pattern of AD use, the HG group continued to show greater use of high-risk ADs and reduced use of low-risk ADs compared with the non-HG group ().
Table 2. Antihyperglycemic medication during the follow-up period.
More patients in the HG group used prandial insulin than those in the non-HG group (49.1% vs. 33.4%, respectively, p < 0.0001).
Hospitalization and mortality
Hospitalization
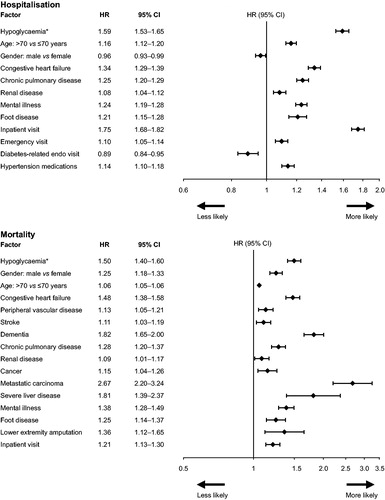
Overall, a total of 16,534 (53%) patients experienced hospitalization from any cause after a mean follow-up time of 2.9 years. During 1 year of follow-up post-BI initiation, a greater proportion of patients in the HG group required hospitalization than those in the non-HG group (62.7% vs. 30.2%, respectively, p < 0.0001), experiencing 1.47 and 0.53 hospitalization episodes/patient-year, respectively (p < 0.0001). After adjustment for demographic, comorbidity and medication history, medically attended hypoglycemia after initiating BI increased the subsequent likelihood of a patient to require hospitalization (HR 1.59; 95% CI: 1.53–1.65) during the total follow-up period. Additional factors that increased the risk of hospitalization were an inpatient visit (HR 1.75; 1.68–1.82) and CHF (HR 1.34; 1.29–1.39) ().
Figure 2. HR analysis for all-cause hospitalization and death. *Hypoglycemia: indicator of a medically attended hypoglycemic event occurring before hospitalization or death. Endo, endocrinologist.
Mortality
During a mean follow-up period of 2.9 years, 4414 (14%) patients died. Pre-index characteristics of patients by mortality status are shown in Supplementary .
Patients with hypoglycemia were more likely to die than those without hypoglycemia (21.1% vs. 13.4%, respectively). After adjustment for demographic, comorbidities and medication history, hypoglycemia was associated with an elevated risk of death (HR 1.50; 95% CI: 1.40–1.60) – the strongest association after metastatic carcinoma, severe liver disease, and dementia (). In all three sensitivity analyses, hypoglycemia remained a significant risk factor for death. The HR between experiencing a hypoglycemic event and death was 1.46 (95% CI: 1.34–1.58) for the population with MI, CHF, PVD and stroke (n = 13,341), 1.44 (95% CI: 1.34–1.56) for the same population plus those with dementia and renal disease (n = 15,915); and 1.48 (95% CI: 1.37–1.58) for the population without cancer (n = 27,942).
Patients in the HG group died earlier in the study than those in the non-HG group; time from index date to death was 901 days (SD: 503) in the HG group and 974 days (SD: 532) in the non-HG group (p = 0.0011) (note, patients in the HG group were slightly older at index). Owing to the design of this study, which required at least 1 year of post-index insurance coverage, few patients who died in the first year following BI initiation would have been eligible for inclusion; as a consequence, few deaths were recorded within the first year of follow-up (24/3066 [0.7%] patients in the HG group and 172/27,969 [0.6%] patients in the non-HG group, respectively; p = 0.2655). After the second year of follow-up, 306 (9.9%) patients in the HG group and 1480 (5.2%) patients in the non-HG group had died (p < 0.0001), and after 3 years of follow-up, mortality was 448 (14.6%) and 2411 (8.6%) in the HG and non-HG groups, respectively (p < 0.0001).
Burden of hypoglycemia on healthcare utilization and treatment costs
During the pre-index period, patients experiencing hypoglycemia post-BI initiation required more outpatient visits, emergency room visits and hospital admissions than those who did not experience hypoglycemia. Healthcare utilization substantially increased further in the HG group following BI initiation (change from pre-index, range 45–61%), in contrast to the non-HG group whose healthcare utilization either increased more modestly (office visits, change from pre-index +25%), showed no change (hospital admissions) or decreased (emergency room visits, change from pre-index −13%) (Supplementary Figure 1).
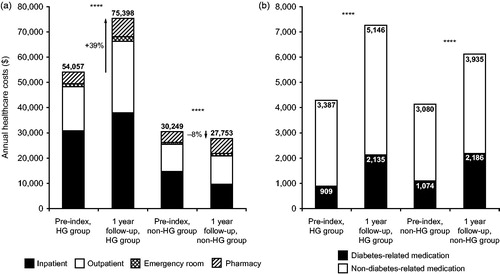
The HG group incurred higher total annual healthcare costs per patient than the non-HG group during the pre-index period ($54,057 vs. $30,249, respectively, p < 0.001) (). During the year following BI initiation, annual healthcare costs for the total cohort fell slightly, from $32,601 at baseline, to $32,460 per patient. In the HG group (representing 9.9% of the total population) annual healthcare costs increased by 39% to $75,398, mainly driven by inpatient ($37,930) and outpatient ($28,097) costs (). There was a modest (8%) decline in annual healthcare costs to $27,753 in the non-HG group, mainly due to a decline in hospitalization costs (). Both groups demonstrated an increase in pharmacy costs during follow-up from pre-index values; increases were comparable for both groups for diabetes-related therapy, but there was a greater increase in non-diabetes-related therapy in the HG group (). The HG group also incurred hypoglycemia-related costs of $5337.
Figure 3. Unadjusted annual treatment costs for the HG group and the non-HG group, during 1 year pre-index and during 1 year follow-up post-BI initiation. (A) Total costs by healthcare setting. Dark grey bars, inpatient; white bars, outpatient; cross-hatched, emergency room; hatched, pharmacy. (B) Pharmacy costs. Black bars, diabetes-related medication; white bars, non-diabetes-related medication. HG group defined as those experiencing a hypoglycemic event during 1 year following BI initiation (3066/31,035, 9.9%). Non-HG group defined as those who did not experience a hypoglycemic event during one year following BI initiation (27,969/31,035, 90.1%). ****p < 0.0001. BI, basal insulin; HG, hypoglycemia; ns, non-significant.
After adjusting for baseline characteristics, annual healthcare expenditure during the follow-up period remained substantially elevated in the HG group compared with the non-HG group, both for total costs ($53,375 vs $25,881, p < 0.0001) and diabetes-related costs ($19,938 vs $8539, respectively, p < 0.0001).
BI-only users
Patients who used BI only during follow-up, without the subsequent addition of prandial insulin, comprised 64% of the total population (n = 19,860). The percentage of BI-only users experiencing hypoglycemia was 7.7% (compared with 9.9% in the total population). A greater proportion of BI-only patients who experienced hypoglycemia were hospitalized compared with those who did not experience hypoglycemia (55.8% vs. 23.4%, p < 0.0001). Mortality was also higher in those BI-only patients who experienced hypoglycemia compared with the population of patients without hypoglycemia (16% vs. 10%, p < 0.0001). The total cost of treating BI-only patients who experienced hypoglycemia was $59,389 per patient, of which $4599 was attributed to hypoglycemia-related treatment, compared with $22,469 for patients without hypoglycemia.
Discussion
To our knowledge, this is the first study analyzing hypoglycemia burden and consequences specifically in a Medicare Advantage population of older patients with type 2 diabetes initiating BI. Experiencing a medically attended hypoglycemic event during the first year post-BI initiation was associated with an increased risk of hospitalization and death during the overall follow-up period. Hypoglycemia was also associated with a substantial burden in terms of healthcare resource utilization and financial costs.
Hypoglycemia is an unpleasant side effect of diabetes therapy that is exacerbated in older ageCitation10. In our study, patients who experienced hypoglycemia were slightly but statistically significantly older than those who did not experience hypoglycemia (by 1 year). The ability to detect age differences between groups in our study was limited by the inclusion of an age-restricted population; however, an analysis by Johnston et al. of an age-unrestricted population yielded a difference of 4 years between patients who experienced hypoglycemia and those who did not, supporting the significance of our observed trendCitation15.
Patients who experienced hypoglycemia during our study were not only more likely than patients without hypoglycemia to have comorbidities pre-index, but also showed a substantial increase in microvascular and macrovascular complications following BI initiation, compared with stable levels of comorbidity in those patients not experiencing hypoglycemia. There are several possible reasons why patients with comorbidities may be predisposed to hypoglycemia: the inherent complexity of managing multiple conditions; masking of hypoglycemia warning signs by medications for comorbidities; and/or physiological fragility in itself, such that patients are less able to withstand changes in blood glucose levels. There is also increasing evidence supporting an association between hypoglycemia and development of cognitive impairment seen in dementia, creating a vicious cause and effect cycleCitation16.
It has been speculated that hypoglycemia may be a marker of increased cardiovascular risk and mortality rather than a risk factor itself. However, hypoglycemia remained associated with risk of death in our study after adjustment for patient characteristics, comorbidities, and medication history, and in a sensitivity analysis restricted to those patients with comorbid conditions that have a high known effect on mortality (MI, CHF, PVD or stroke). Our results in an elderly population concur with findings from previous studies. In a UK retrospective cohort study that included all patients with diabetes aged ≥30 years, a hypoglycemic episode significantly increased the risk of experiencing a cardiovascular event or mortality for patients with type 2 diabetes, both in the absence or presence of cardiovascular diseaseCitation17. In a US claims database analysis of patients aged 65 and over, those who experienced a hypoglycemic episode had 78% higher odds of experiencing an acute cardiovascular eventCitation15. The ADVANCE (Action in Diabetes and Vascular disease: preterAx and diamicroN multicenter randomized Controlled Evaluation, NCT00145925) randomized controlled trial of older people (mean age 66 years) with type 2 diabetes found an associated risk between severe hypoglycemia and increased cardiovascular and non-cardiovascular events, and mortalityCitation18. Due to the limited cause of death information available in the claims database, it was beyond the scope of this study to analyze the number of deaths directly attributable to hypoglycemia.
Overall, healthcare costs decreased modestly after BI initiation. However, there was a sharp rise in costs for those patients experiencing hypoglycemia compared to those who did not, driven by an increase in healthcare utilization across all settings. These costs include those related to hypoglycemia but are also likely to reflect the increase in comorbid conditions observed in the HG group during follow-up compared with levels observed pre-index. For those patients not experiencing hypoglycemia, healthcare costs declined following BI initiation, mainly due to a decline in inpatient costs. Our results underline the high cost of treatment for patients experiencing hypoglycemia following BI initiation, either directly arising from a hypoglycemic event or with respect to the increased fragility and comorbidities found in this population.
Prandial insulin in combination with BI has demonstrated a higher incidence of hypoglycemic events compared with alternative options involving BI and antihyperglycemic agents such as GLP-1 analogsCitation19–21. Indeed, our sensitivity analysis of BI-only users that excluded patients who started prandial insulin therapy during follow-up found that hypoglycemia rates were lower for these patients compared with the overall population (7.7% vs. 9.9%). However, healthcare resource utilization and costs for patients experiencing hypoglycemia remained higher in this subgroup compared with those BI-only users who did not experience hypoglycemia.
In addition, certain OAD treatments, such as sulfonylureas and meglitinides, are associated with increased hypoglycemic events and poorer outcomes compared with agents such as GLP-1, DPP-4 inhibitors and metforminCitation5,Citation22,Citation23. A greater proportion of patients in the HG group recorded use of ADs associated with a high risk of hypoglycemia than those in the non-HG group, both pre-index and post-index, while the opposite pattern of drug use was noted for low-risk ADs. Specifically, during the follow-up period, patients in the HG group showed a greater use of glinides (meglitinide) during follow-up vs. those who did not experience hypoglycemia, and patients in the non-HG group more commonly used metformin than those in the HG group. These differences in OAD treatment patterns during follow-up may have contributed to the increased risk of hypoglycemia in the HG group.
New BIs are in development to address some of the issues associated with insulin initiation and deliveryCitation24. One approach is to develop BIs that provide a more stable and prolonged delivery of drug, avoiding the peaks and troughs of activity that are likely to lead to episodes of hypoglycemiaCitation25. Choice of agents in combination therapy should also be carefully considered for older patients where hypoglycemic events are likely to lead to adverse outcomes. Better BIs plus low-risk ADs, such as GLP-1 analogs, may represent a more suitable treatment option than prandial insulin or high-risk OADs in patients susceptible to hypoglycemiaCitation21,Citation26.
As well as new treatment options and therapy combinations, strategies to reduce hypoglycemia should also include regular reviews of patient medication and blood glucose targets that take into account the holistic patient profile. Educational programs on how to recognize the warning signs of low blood glucose may also help older patients to better manage their diabetes. Physicians also need to be vigilant for hypoglycemia unawareness status in patients who have experienced repeated hypoglycemic episodes and promptly advise on approaches to restore the adrenergic response to falling blood glucose levels, so that future severe hypoglycemic events may be better avoidedCitation27.
This study is limited by its observational nature: associations can be described but causality cannot be attributed, and it was not possible to analyze parameters not captured in the database, including BMI, diabetes duration, reasons for treatment initiation, daily insulin dose or cause of death. HbA1c values were available for only a subset of patients. Use of a prescription reimbursement database inevitably limited the evaluation to hypoglycemic episodes that required medical attention, and yet asymptomatic hypoglycemic episodes have also been shown to play a role in comorbidity development and exacerbationCitation28,Citation29. AD use was recorded as the number of patients claiming for at least one prescription of a given medication; treatment discontinuation, treatment switching and adherence were not included in this analysis. This study was conducted specifically in older patients with type 2 diabetes initiating BI; further studies are warranted to quantify the treatment burden and consequences of hypoglycemia in patients with type 1 diabetes and across a wider range of age and insulin treatment duration.
The strengths of this study are the large number of patients included in the analysis, representing a wide cross-section of the older patient population with type 2 diabetes. Results were adjusted by numerous factors, including key confounding factors known to influence risk of hypoglycemia and mortality outcomes, and the results were further tested for robustness through sensitivity analyses.
Conclusions
Collectively, these results highlight the burden of hypoglycemia for patients with type 2 diabetes initiating BI, both in terms of health outcomes and in resource utilization and direct costs. Furthermore, in this older population, those with high levels of comorbidity are particularly vulnerable to hypoglycemia. Strategies to reduce hypoglycemic risk in this fragile older population, and the impact on health outcomes, need to be investigated in further studies.
Transparency
Declaration of funding
This study and editorial assistance in the preparation of this paper were funded by Sanofi. J.E. interpreted the data and critically reviewed the manuscript. L.L. critically reviewed the manuscript, C.P. researched the data and performed the data analysis. H.W. designed the study and critically reviewed the manuscript. M.B. contributed to the discussion and critically reviewed the manuscript. Professor Javier Escalada is the guarantor of this work and takes responsibility for the integrity of the data and the accuracy of the data analysis.
Declaration of financial/other relationships
J.E. has disclosed that he has served on advisory panels for MSD and Sanofi, and has participated in speaker’s bureaus for Astra-Zeneca, Boehringer/Lilly, MSD and Sanofi. H.W. and M.B. have disclosed that they are employees of Sanofi. C.P. has disclosed that she has acted as a consultant to Sanofi. L.L. has disclosed that she was an employee of Sanofi at the time of the study.
CMRO peer reviewers on this manuscript have no relevant financial relationships to disclose.
Previous presentation
Aspects of this study have been presented as a poster presentation at the American Diabetes Association 75th Scientific Sessions, 5–9 June 2015, Boston, United States; and at the 51st European Association for the Study of Diabetes Annual Meeting, 14–18 September 2015, Stockholm, Sweden.
Supplementary figures
Download EPS Image (1.7 MB)Supplementary tables
Download MS Word (149 KB)Acknowledgments
Editorial assistance was provided by Julianna Solomons of Fishawack Communications Ltd., funded by Sanofi.
Related Research Data
References
- Gaede P, Vedel P, Larsen N, et al. Multifactorial intervention and cardiovascular disease in patients with type 2 diabetes. N Engl J Med 2003;348:383-93
- Holman RR, Paul SK, Bethel MA, et al. 10-year follow-up of intensive glucose control in type 2 diabetes. N Engl J Med 2008;359:1577-89
- UK Prospective Diabetes Study (UKPDS) Group. Intensive blood-glucose control with sulphonylureas or insulin compared with conventional treatment and risk of complications in patients with type 2 diabetes (UKPDS 33). Lancet 1998;352:837-53
- Cryer PE. The barrier of hypoglycemia in diabetes. Diabetes 2008;57:3169-76
- Inzucchi SE, Bergenstal RM, Buse JB, et al. Management of hyperglycemia in type 2 diabetes: a patient-centered approach: position statement of the American Diabetes Association (ADA) and the European Association for the Study of Diabetes (EASD). Diabetes Care 2012;35:1364-79
- Peyrot M, Barnett AH, Meneghini LF, Schumm-Draeger PM. Insulin adherence behaviours and barriers in the multinational Global Attitudes of Patients and Physicians in Insulin Therapy study. Diabet Med 2012;29:682-9
- Tschope D, Bramlage P, Binz C, et al. Incidence and predictors of hypoglycaemia in type 2 diabetes – an analysis of the prospective DiaRegis registry. BMC Endocr Disord 2012;12:23
- Polonsky WH, Fisher L, Guzman S, et al. Psychological insulin resistance in patients with type 2 diabetes: the scope of the problem. Diabetes Care 2005;28:2543-5
- Leiter LA, Yale J-F, Chiasson J-L, et al. Assessment of the impact of fear of hypoglycemic episodes on glycemic control. Can J Diabetes 2005;29:186-92
- Miller ME, Williamson JD, Gerstein HC, et al. Effects of randomization to intensive glucose control on adverse events, cardiovascular disease, and mortality in older versus younger adults in the ACCORD Trial. Diabetes Care 2014;37:634-43
- Centers for Disease Control and Prevention (CDC). 2009. Emergency department visit rates for hypoglycemia as first-listed diagnosis per 1,000 diabetic adults aged 18 years or older, by age, United States, 2006–2009. Available at: http://www.cdc.gov/diabetes/statistics/hypoglycemia/fig5.htm [Last accessed November 2015]
- Foos V, Varol N, Curtis BH, et al. Economic impact of severe and non-severe hypoglycemia in patients with type 1 and type 2 diabetes in the United States. J Med Econ 2015;18:420-32
- Cheng YJ, Imperatore G, Geiss LS, et al. Secular changes in the age-specific prevalence of diabetes among U.S. adults: 1988–2010. Diabetes Care 2013;36:2690-6
- Quan H, Sundararajan V, Halfon P, et al. Coding algorithms for defining comorbidities in ICD-9-CM and ICD-10 administrative data. Med Care 2005;43:1130-9
- Johnston SS, Conner C, Aagren M, et al. Evidence linking hypoglycemic events to an increased risk of acute cardiovascular events in patients with type 2 diabetes. Diabetes Care 2011;34:1164-70
- Barbagallo M, Dominguez LJ. Type 2 diabetes mellitus and Alzheimer’s disease. World J Diabetes 2014;5:889-93
- Khunti K, Davies M, Majeed A, et al. Hypoglycemia and risk of cardiovascular disease and all-cause mortality in insulin-treated people with type 1 and type 2 diabetes: a cohort study. Diabetes Care 2015;38:316-22
- Zoungas S, Patel A, Chalmers J, et al. Severe hypoglycemia and risks of vascular events and death. N Engl J Med 2010;363:1410-18
- Diamant M, Nauck MA, Shaginian R, et al. Glucagon-like peptide 1 receptor agonist or bolus insulin with optimized basal insulin in type 2 diabetes. Diabetes Care 2014;37:2763-73
- Digenio A, Karve S, Candrilli SD, Dalal M. Prandial insulin versus glucagon-like peptide-1 added to basal insulin: comparative effectiveness in the community practice setting. Postgrad Med 2014;126:49-59
- Rosenstock J, Fonseca VA, Gross JL, et al. Advancing basal insulin replacement in type 2 diabetes inadequately controlled with insulin glargine plus oral agents: a comparison of adding albiglutide, a weekly GLP-1 receptor agonist, versus thrice-daily prandial insulin lispro. Diabetes Care 2014;37:2317-25
- Mogensen UM, Andersson C, Fosbol EL, et al. Sulfonylurea in combination with insulin is associated with increased mortality compared with a combination of insulin and metformin in a retrospective Danish nationwide study. Diabetologia 2015;58:50-8
- Shankar RR, Xu L, Golm GT, et al. A comparison of glycaemic effects of sitagliptin and sulfonylureas in elderly patients with type 2 diabetes mellitus. Int J Clin Pract 2015;69:626-31
- Sorli C. New developments in insulin therapy for type 2 diabetes. Am J Med 2014;127:S39-S48
- Becker RH, Dahmen R, Bergmann K, et al. New insulin glargine 300 units.mL−1 provides a more even activity profile and prolonged glycemic control at steady state compared with insulin glargine 100 units.mL−1. Diabetes Care 2014;38:637-43
- Raccah D, Lin J, Wang E, et al. Once-daily prandial lixisenatide versus once-daily rapid-acting insulin in patients with type 2 diabetes mellitus insufficiently controlled with basal insulin: analysis of data from five randomized, controlled trials. J Diabetes Complications 2014;28:40-4
- Seaquist ER, Anderson J, Childs B, et al. Hypoglycemia and diabetes: a report of a workgroup of the American Diabetes Association and the Endocrine Society. Diabetes Care 2013;36:1384-95
- Chow E, Bernjak A, Williams S, et al. Risk of cardiac arrhythmias during hypoglycemia in patients with type 2 diabetes and cardiovascular risk. Diabetes 2014;63:1738-47
- Sanon VP, Sanon S, Kanakia R, et al. Hypoglycemia from a cardiologist’s perspective. Clin Cardiol 2014;37:499-504