
Abstract
Objectives: To compare retinal thickness before and after treatment with the fluocinolone acetonide (FAc) 190 µg intravitreal implant in people with diabetic macular edema (DME) using data from the Iluvien Clinical Evidence study in the UK (ICE-UK).
Methods: For this retrospective cohort study, data on people attending any one of 13 participating ophthalmology departments and treated with FAc intravitreal implant between April 1, 2013 and April 15, 2015 were collected for 12 months prior to and at least 12 months after implantation. Cross-sectional and longitudinal patterns of central foveal thickness (CFT) were compared before and after FAc implant.
Results: There were 208 people who contributed data from 233 individual eyes treated with the FAc implant. Mean age was 68.1 years and 62% were male. Median (interquartile range) CFT decreased from 462 µm (354–603 µm) at time of implant to 309 µm (222–433 µm) at 12 months post-implant (p < .001). Over the same period, a reduction of ≥10%, ≥25%, and ≥50% in CFT was observed in 113 (65%), 87 (50%), and 37 (21%) treated eyes, respectively. Eyes with a CFT of ≥400 µm at the time of implant were significantly more likely to achieve a reduction in CFT of ≥10%, ≥25%, and ≥50% at 12 months (all p < .001) compared with eyes with a CFT of <400 µm at implant. Both retinal thickness and changes in retinal thickness were loosely correlated with visual acuity.
Conclusion: A marked reduction in retinal thickness was observed in people following FAc intravitreal implant for DME. The response was related to the degree of retinal thickness prior to treatment.
Introduction
The typical thickness of the retina in people with healthy eyes is ∼200 μm, which can vary slightly according to the part of the retina measured and type of ocular coherence tomography (OCT) used, with separate studies having reported either no change or a small decrease in thickness with increasing ageCitation1,Citation2. Damage to the eye caused by conditions such as macular edema or trauma can lead to abnormal fluid accumulation, resulting in thickening of the retina. Along with other microvascular changes, thickening of the retina follows sustained periods of hyperglycemia in people with diabetes. Although macular edema does not always result in a deterioration in vision, disruption of the fovea can cause severe visual impairmentCitation1.
The fluocinolone acetonide (FAc) 190 µg intravitreal implant was evaluated in the Fluocinolone Acetonide in Diabetic Macular Edema (FAME) study programCitation3,Citation4. Continuous daily release of low levels of FAc from the implant has been found to result in a reduction in foveal thickness and edema for up to 3 yearsCitation4.
Historically, laser photocoagulation was considered to be the treatment of choice for DME, due to favorable results from the Early Treatment Diabetic Retinopathy Study (ETDRS)Citation5. The FAME study, therefore, evaluated FAc intravitreal implant in people with an inadequate response to retinal laser therapy. However, since the FAME study was conducted, several landmark trials have demonstrated that anti-vascular endothelial growth factor (anti-VEGF) therapy can lead to a significant improvement in vision in people with DMECitation6–9, and anti-VEGF therapy is now generally considered to be the first-line therapy for this condition. Therefore, in Europe, FAc intravitreal implant is presently indicated for the management of chronic DME only where an insufficient response has been achieved with first-line anti-VEGF therapy. The aim of the ILUVIEN Clinical Evidence Study in the UK (ICE-UK) was to assess the effectiveness of FAc intravitreal implant for DME in real world clinical practice. The purpose of this study was specifically to evaluate retinal thickness 12 months before and after treatment with the FAc 190 µg intravitreal implant.
Methods
Data source
The dataset and study methodology have been described in detail elsewhereCitation10. Briefly, for this retrospective, multi-center, hospital-based study, data were extracted from medical records for a representative cohort of people treated at 13 participating hospitals in the UK and combined into a single dataset for the purpose of analysis. Data were generated from retrospective case reviews, pseudonymized, and entered into an online data entry tool. The following data were collected at several time points within a pre-specified period: patient demographics, medical history, implant data, and data from multi-disciplinary and medication reviews.
Ethical approval
The lead clinician and Caldicott Guardian at each center gave written approval for extraction of anonymized data. The study protocol was approved by the head of research governance at the lead clinical center. This study was conducted in accordance with the Declaration of Helsinki and the UK Data Protection Act.
Subjects
Subjects were people with type 1 or type 2 diabetes treated with FAc 190 µg intravitreal implant for DME in at least one eye at a participating site as part of their routine care between April 1, 2013 and April 15, 2015. A requirement was a minimum of 12 months’ history prior to implant. Those with a history of taking part in any other interventional study for DME or who were lost to follow-up were excluded. The index date was defined as the date of first recorded FAc intravitreal implant into the study eye. The follow-up period was defined as 12 months post-implant and subjects who received FAc intravitreal implant in both eyes were allowed to contribute both eyes to the study.
Outcomes
The following clinical outcomes were investigated at 3, 6, and 12 months post-index date: changes in central foveal thickness (CFT) and central subfield thickness (CST) and the proportion of treated eyes that demonstrated a 10%, 25%, and 50% improvement in CFT or CST. The distribution of CFT and CST from 12 months prior to and 12 months post-implant was also investigated. Due to the observational nature of this study, there was no restriction on the OCT machine type used to measure retinal thickness.
Subgroups
Results are presented overall and for two subgroups, based on higher and lower CFT at implant (≥400 µm and <400 µm, respectively). Eyes with no recorded CFT measurement at baseline were excluded from the subgroup analyses.
Statistical analysis
Changes in retinal thickness were compared between implant and the 3-, 6-, and 12-month time points using the non-parametric Wilcoxon signed ranks test. The proportion of people achieving a reduction in retinal thickness between implant at these time points was compared between subgroups using Fisher’s exact test. The proportion of people achieving a target retinal thickness was compared between implant and the 3-, 6-, and 12-month time points using McNemar’s test. Last observation carried forward was implemented to impute missing values in two stages: on or before index date and after index dateCitation11.
Mean and median CFT and CST were calculated on a daily basis for the 12 months before and after FAc implant. In order to smooth the data, missing values for each day of this 24-month period were imputed using linear interpolationCitation11. As linear interpolation could not be used before the first recorded value or after the last recorded value, nearest observation carried forward and backwards was used to impute the remaining missing values. In order to investigate whether CFTs <200 µm have a detrimental effect on vision, visual acuity (ETDRS letter score) in the 12 months prior to and post FAc implant was investigated for study eyes with a CFT of <200 µm at baseline using the same methodology.
The strength and direction of the association between pairs of visual acuity and CFT measurements recorded at FAc implant, 12 months post-FAc implant and at any time in the 12 months prior to and post-FAc implantation were measured using the Pearson’s correlation coefficient. Statistical analyses were carried out using IBM SPSS Statistics version 20.
Results
Data were collected on 311 people, of whom 208 people contributing data from 233 eyes treated with FAc intravitreal implant (study eyes) were eligible for inclusion in the study cohort. An attrition flow diagram has been previously presentedCitation10. Of the 233 study eyes, 208 were first eyes treated with the implant, and 25 were a second treatment in the subject’s other eye.
Patient demographics
Of the 208 people treated with FAc intravitreal implant in any eye, 128 (62%) were male. The mean age was 68.1 years; 176 (85%) had type 2 diabetes (). Median (interquartile range, IQR) duration of diabetes was 18 (11–27) years. Sixty-three eyes (27%) had a CFT of <400 µm at the time of implant, and 128 (55%) eyes had a CFT of ≥400 µm at the time of implant. Forty-two study eyes had no recorded CFT measurement within the 12-month period prior to implant, and were, therefore, excluded from the subgroup analysis.
Table 1. Baseline characteristics overall and by baseline central foveal thickness.
Two hundred and seven treated eyes (89%) had a pseudophakic lens at the time of implant. Median (IQR) visual acuity at implant was 0.66 (0.48–1.00) LogMAR units (equivalent to median = 52, IQR = 35–61, ETDRS letters). Mean (SD) CFT at implant was 482 μm (186 μm). Median (IQR) CST at the time of implant was 447 (352–587) µm. Median (IQR) numbers of macular laser treatments, steroid treatments, and anti-VEGF injections prior to index date were 1.0 (0.0–3.0), 0.0 (0.0–1.0), and 5.0 (2.0–7.0), respectively.
Central foveal thickness
Not all subjects had relevant observations at all time points. Following multiple imputation of missing values and reporting only paired observations, the median (IQR) CFT decreased following implant at each time point: 472 µm (365–616 µm) at implant to 355 µm (254–474 µm) at 3 months (p < .001), 464 µm (362–605 µm) at implant to 331 µm (239–462 µm) at 6 months (p < .001), and 462 µm (354–603 µm) at implant to 309 µm (222–433 µm) at 12 months (p < .001; ).
Table 2. Change in central foveal thickness.
A reduction of ≥10% in CFT from implant was observed in 76 (51%), 96 (57%), and 113 (65%) treated eyes at 3 months, 6 months, and 12 months post-implant, respectively. A reduction of ≥25% and ≥50% in CFT from implant was observed in 61 (41%) and 21 (14%) treated eyes at 3 months, 75 (44%) and 30 (18%) at 6 months, and 87 (50%) and 37 (21%) at 12 months, respectively. When compared with eyes with a CFT of <400 µm at the time of implant, eyes with a CFT of ≥400 µm at implant were significantly more likely to achieve a reduction in CFT of ≥25% and ≥50% at 3 months (p < .001, p < 0.001, and p = .004, respectively), 6 months (all p < .001), and 12 months (all p < .001).
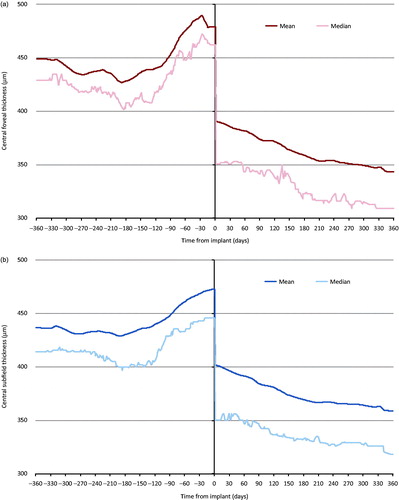
Mean CFT was higher in the 12 months prior to implant compared with the 12 months after implant, and tended to increase in the 3 months immediately prior to implant (). CFT continued to gradually decrease throughout the 12 months following implant.
Figure 1. Change in (a) central foveal thickness and (b) central subfield thickness 12 months before and after fluocinolone intravitreal implant. Linear interpolation was used to impute missing values between CFT and CST scores. Nearest observation carried forward and backwards was then used to impute missing values prior to the first and after the last recorded measurement. Imputation was carried out in two parts, day –365 to day 0 and day 1 to 365. Individuals with no measurement prior to and post-implant were excluded (n = 60 for (a) and n = 52 for (b)).
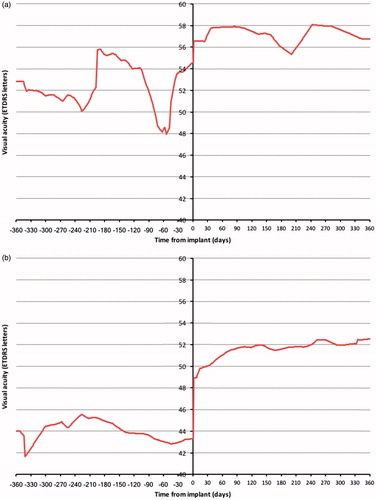
When compared with baseline, a steeper cumulative frequency curve was observed at 12 months follow-up, with more study eyes achieving lower CFTs at 12 months following FAc implant (). However, the proportion of study eyes with a CFT of ≤150 µm was the same prior to and 12 months post-FAc implant (2%). The distribution of study eyes by CFT category of <200 µm, ≥200 and <300 µm, ≥300 and <400 µm, and ≥400 µm at FAc implant and 12 months post-FAc implant is described in . Most study eyes had a CFT of ≥400 µm at the time of FAc implantation (66%). At 12 months post-FAc implant, 51% of study eyes moved to a lower CFT category, 7% moved to a higher CFT category, and 42% remained in the same category. CFT was <300 µm in 16% of eyes at implant and 47% of eyes at 12 months post-implant (p < .001, ). For eyes with a CFT <400 µm at the time of implant, CFT was <300 µm in 47% of eyes at the time of FAc implant and 66% of eyes at 12 months (p = .382). In those eyes with a CFT of ≥400 µm at the time of FAc implant, 38% achieved a CFT of <300 µm at 12 months post-implant. Following FAc implant, 6% of eyes had a CFT of <200 µm at the time of FAc implant and 19% of eyes had a CFT of <200 µm at 12 months (p < .001). Changes in visual acuity in the 12 months prior to and post-FAc implant are detailed in for these study eyes. For study eyes with a CFT of <200 µm at FAc implant, visual acuity was slightly higher in the 12 months post-FAc implant than in the 12 months prior to FAc implant. Comparing the 12 months prior to and post-FAc implant, a larger improvement in visual acuity was observed in study eyes with a CFT of >200 µm at FAc implant and a CFT of <200 µm at 12 months post-FAc implant.
Figure 2. Cumulative frequency for central foveal thickness recorded at baseline and 12 months post-FAc implant.
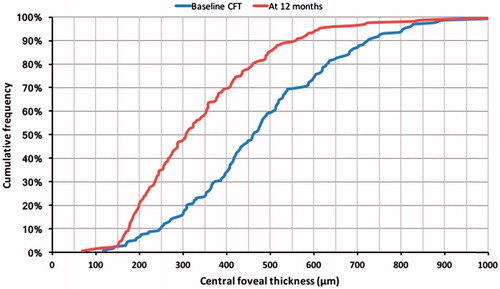
Figure 3. Central foveal thickness (CFT) at baseline and 12 months post-implant. (a) Distribution of FAc treated eyes by CFT category at FAc implant and after 12 months follow-up. (b) Distribution of FAc treated eyes achieving a CFT of ≤200 µm, > 200 and ≤300 µm, > 300 µm and ≤400 µm, and >400 µm at 12 months post-implant by CFT at time of FAc implant. (c) CFT at FAc implant and after 12 months follow-up by CFT category at implant. (d) Change in CFT between FAc implant and 12 months follow-up by CFT category at implant.
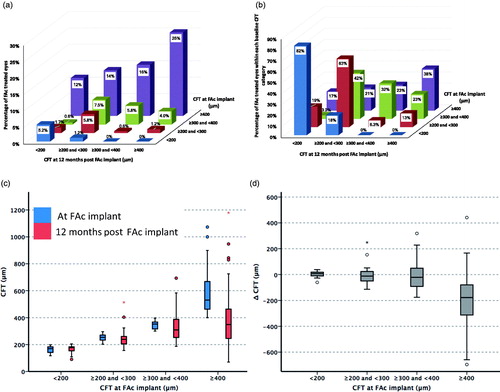
Figure 4. Visual acuity 12 months prior to and post-FAc implant in study eyes (a) with a central foveal thickness (CFT) < 200 µm at FAc implant (n = 12), and (b) CFT ≥200 µm at FAc implant and <200 µm at 12 months post-FAc implant (n = 24).
At FAc implantation, a Heidelberg SPECTRALIS OCT machine was used to measure retinal thickness in 61% of eyes with a recorded CFT; Topcon 3D OCT-2000 was used in 38% of eyes; and Topcon 3D OCT-1000 was used in 1% of eyes. The corresponding values were 56%, 41%, and 3%, respectively, at 3 months; 58%, 38%, and 3%, respectively, at 6 months; and 59%, 38%, and 3%, respectively, at 12 months. Retinal thickness was measured using different OCT machine types at baseline and at 3, 6, and 12 months post-FAc implant in 5%, 7%, and 7% of eyes, respectively. In study eyes whose CFT was measured using a Heidelberg SPECTRALIS machine both prior to FAc implant and 12 months following implant, median CFT decreased from 492 µm (IQR = 388–647 µm) to 302 µm (210–421 µm, n = 99). In study eyes where a Topcon 3D OCT-2000 was used both at baseline and 12 months follow-up, median CFT decreased from 413 µm (IQR = 323–514 µm) to 317 µm (293–436 µm, n = 62).
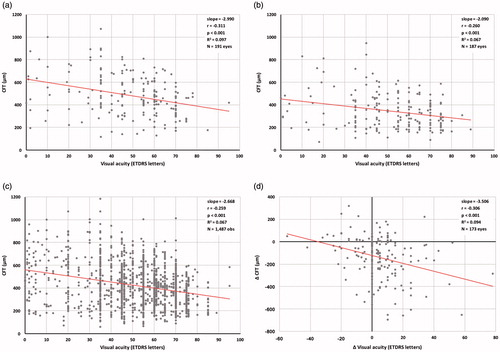
Correlation between central foveal thickness and visual acuity
There was a statistically significant negative correlation between visual acuity (ETDRS letter score) and CFT at FAc implantation (Pearson’s correlation coefficient r = –0.311, p < .001) and at 12 months post-FAc implant (r = –0.250, p < .001, ). A statistically significant negative correlation between visual acuity and CFT was also observed when all pairs of CFT measurements and visual acuity measurements recorded between 12 months prior to FAc implant and 12 months post-FAc implant were analyzed (r = –0.259, p < .001, ). However, the variance in visual acuity accounted for by CFT was small (coefficient of determination, R2 = 0.097 at FAc implant, R2 = 0.067 at 12 months post-FAc implant and R2 = 0.067 for all measurements in the 12 months prior to and post-FAc implant). Change in CFT and change in visual acuity between FAc implant and 12 months post-FAc implant were also significantly related (r = –0.285, p < .001, R2 = 0.094, ).
Figure 5. Correlates between central foveal thickness (CFT) and visual acuity. (a) Visual acuity and CFT at FAc implantation. (b) Visual acuity and CFT at 12 months post-FAc implant. (c) All pairs of visual acuity and CFT measurements between 12 months prior to and 12 months post-FAc implant. (d) Change in visual acuity and change in CFT between FAc implant and 12-month follow-up. r, Pearson’s correlation coefficient, R2, coefficient of determination. Only visual acuity and CFT measurements recorded on the same date were included.
Central subfield thickness
Median (IQR) CST decreased from baseline at each time point: 448 µm (354–587) at baseline to 356 µm (276–453 µm) at 3 months (p < .001), 448 µm (359–581 µm) at baseline to 337 µm (268–445 µm) at 6 months (p < .001), and 446 µm (359–569 µm) at baseline to 318 µm (262–419 µm) at 12 months (p < .001, ).
Table 3. Change in central subfield thickness.
A reduction of ≥10% in CST was observed in 83 (54%), 103 (58%), and 118 (65%) treated eyes at 3 months, 6 months, and 12 months post-implant. A reduction of ≥25% and ≥50% in CFT from implant was observed in 47 (30%) and 13 (8%) treated eyes at 3 months, 62 (35%) and 23 (13%) at 6 months, and 76 (42%) and 25 (14%) at 12 months, respectively.
Following linear interpolation of missing values (with nearest observation carried forward and backwards to impute missing values before the first recorded measurement and after the last recorded measurement), mean CST was higher in the 12 months prior to implant than in the 12 months post-implant (). An increase in mean CST was observed in the 4 months prior to implant. CST continued to decrease gradually throughout the 12-month period following implant.
Discussion
In the 12 months prior to the insertion of the FAc intravitreal implant, central retinal thickness continued to increase. Following implant, there was a marked reduction in the central retinal thickness. The onset of the beneficial changes in the morphology of the retina appeared to be both rapid and sustained for the period of this study. Response was based on CFT prior to treatment with the FAc intravitreal implant, being greater in those with a higher CFT (≥400 µm) at baseline and less in those eyes with a lower CFT (<400 µm) at baseline.
Several types of OCT machine types were used to measure retinal thicknesses across the 13 participating ophthalmology centers. Retinal thickness measurements have been shown to vary depending on machine type, which is thought to be due to variation in the retinal segmentation algorithmsCitation12. The same OCT machine in each unit was used to measure retinal thickness at baseline, and the three follow-up time points in most study eyes.
Whilst bearing in mind that retinal thinning due to cell loss can also be harmfulCitation13, in the longer term, it has been reported that eyes that improve most in visual acuity have the greatest decrease in retinal thicknessCitation14. Nevertheless, the association between visual acuity and retinal thickness is still poorly understoodCitation15,Citation16. In this study, a significant negative association between visual acuity (ETDRS letter score) and CFT was observed. However, the variation in visual acuity explained by CFT was low. The Diabetic Retinopathy Clinical Research Network has previously investigated the relationship between retinal thickness and visual acuity before and after laser treatment in patients with DME, and a moderate correlation between visual acuity and center point thickness was observed (correlation coefficient of 0.52 at baseline and 0.49, 0.36, and 0.38 at 3.5, 8, and 12 months post-laser photocoagulation). Furthermore, a correlation between change in visual acuity and change in center point thickness was also reported (correlation coefficient of 0.44, 0.30, and 0.43 at 3.5, 8, and 12 months post-laser photocoagulation)Citation17. However, the researchers also observed considerable variation in visual acuity for a particular level of retinal edemaCitation17.
What is not a matter of conjecture is that any increase in retinal thickness from the norm represents physiological morbidity. Cataract surgery increases retinal thicknessCitation18, and recovery in retinal thickness varies by the region of the retinaCitation19. However, central point thickness has been shown to recover relatively quickly following cataract surgery in people pre-treated with the FAc intravitreal implantCitation20. Panretinal photocoagulation is reported to increase local inflammation, resulting in effects such as localized cytokine releaseCitation21. In the later stages of diabetic eye diseases, multiple treatments are typically used together in complex patterns of treatment to salvage sight. Retinal thickness is thought to be an important and objective measure of clinical outcomeCitation14.
Anti-VEGF therapy is now considered to be the first-line treatment for DME, and this class of drugs has been shown to be effective in reducing retinal thicknessCitation6,Citation22–27. The two licensed anti-VEGF products for DME available in the UK—ranibizumab and aflibercept—have been recommended by NICE for the treatment of DME in eyes with a central retinal thickness ≥400 µm, since both products have been determined to be cost-effective only in those eyes with this central retinal thicknessCitation28,Citation29. However, the NICE recommendation for FAc intravitreal implant does not include any restrictions based on central retinal thicknessCitation30. Laser therapy or intravitreal steroids (in eyes with a pseudophakic lens) are the only recommended treatment options in eyes with a central macular thickness of <400 µm. In this study, we examined changes in CST and CFT in subgroups based on baseline CFT of <400 µm and ≥400 µm. The change in CFT between implant and the end of the 12-month observation period was statistically significantly greater in those with a CFT of ≥400 µm at the time of implant, but not in those eyes with a CFT of <400 µm. Eyes with a smaller CFT at the time of FAc implant have less potential to improve. Sample size was relatively small in the CFT subgroups.
A reduction in retinal thickness post-FAc implant has also been observed in other studies. In the FAME study, baseline mean foveal thickness was 451 µm and 461 µm in the sham and low dose (0.2 µg/day) groups, respectivelyCitation4. At 6 months, the mean foveal thickness was 396 µm in the sham group and 318 µm in the 0.2 µg/day groupCitation4. At 36 months, mean foveal thickness was 309 µm and 280 µm, respectivelyCitation4. Similar results were observed in this study, where median CFT in study eyes had decreased from 464 µm at implant to 331 µm at 6 months. By 12 months, median CFT was 309 µm. In the largest published observational study to date, El-Ghrably et al.Citation31 reported a mean reduction in central macular thickness of 126 μm at 12 months following FAc implant. In line with the findings from this study, central macular thickness decreased rapidly after implant, and this was sustained for the 12-month follow-up periodCitation31. Several other smaller observational studies have investigated the change in central retinal thickness following FAc intravitreal implant for DME. In a retrospective study conducted by Elaraoud et al.Citation32, central retinal thickness was found to have decreased by a mean of 149 µm at 3 months post-FAc implant. In this study, 7% of study eyes moved into a higher CFT category between baseline and 12 months post-FAc implant. Elaraoud et al.Citation32 also reported a worsening in CFT in four out of the 22 eyes included in their retrospective study at 3 months post-implant. In a prospective, non-randomized, phase 4, pilot study, Figueira et al.Citation33 observed a statistically significant decrease in CST 12 months after FAc implant, and a rapid decrease in CST in the first week after implant. Rapid and sustained reductions in CST following FAc implant were also observed in a prospective study conducted by Massin et al.Citation34.
Strengths and limitations
The strengths and limitations of the study have been described previouslyCitation10. As this is an observational study, several limitations are likely to apply, including the misclassification of outcomes, effectiveness, and safety. Outcomes were not measured at set times post-index, and were not consistently available across all participating centers for all the time points. Recall of participants to attend measurement may have led to differential misclassification and missing values. There were inconsistencies in the information recorded on cataract operations and lens status. Duration of DME was not recorded. Analysis was restricted to 12 months follow-up post-implant, because available follow-up after this date varied from person to person.
First and second treated eyes from the same person were analyzed as independent observations. However, second eyes may be more likely to be treated with FAc intravitreal implant if the patient had a positive response to treatment in the first eye. In addition, treatment of the second eye may be more likely to occur at certain treatment centers. Whilst minimizing the elimination of individuals from the analysis, methods used to impute missing values have inherent limitations. The last observation carried forward can produce a biased estimate of treatment effect. However, as retinal thickness continued to improve over the duration of the period of follow-up, we believe that last observation carried forward will provide a conservative estimate for the effect of FAc on retinal thickness.
Conclusions
In our cohort of people with DME, where 96% had a prior history of receiving anti-VEGF injections, laser therapy, and/or other intravitreal steroids, central retinal thickness increased in the 12 months prior to the insertion of the FAc intravitreal implant. Following treatment with the FAc intravitreal implant, a marked and sustained reduction in central foveal thickness was observed in the 12 months following implant. A statistically significant negative correlation between central foveal thickness and visual acuity (ETDRS letters score) was also observed. However, the variance in visual acuity accounted for by central foveal thickness was low.
Transparency
Declaration of funding
This study was supported by Alimera Sciences, the manufacturer of Iluvien 190 µg intravitreal implant, who designed the study and commented on the manuscript.
Declaration of financial/other relationships
SH and EB are employed by, and CJC is a director of Pharmatelligence, a research consultancy receiving funding from Alimera Sciences for the submitted work and from other healthcare-related organizations. DRO has received sponsorship from Sanofi to attend the American Diabetes Association Meeting, San Diego, June 2017. Peer reviewers on this manuscript have received an honorarium from CMRO for their review work, but have no other relevant financial relationships to disclose.
Previous presentations
These results have been presented at The Association for Research in Vision and Ophthalmology (ARVO) 2017 meeting and the Royal College of Ophthalmology (RCOphth) Congress 2017.
Acknowledgments
The authors thank Annette Beiderbeck of Alimera Sciences for designing the study and commenting on the manuscript. We acknowledge the contributions of the staff at the following ICE-UK study centres: New Cross Hospital, Wolverhampton; Maidstone Hospital, Maidstone; Bristol Eye Hospital, Bristol; Royal Victoria Hospital, Belfast; The James Cook University Hospital, Middlesborough; University Hospital, Norfolk; Sunderland Eye Infirmary, Sunderland; Royal Hallamshire Hospital, Sheffield; Royal Surrey County Hospital, Guildford; Queen Elizabeth Hospital, Birmingham; Moorfields Eye Hospital, London; Sandwell General Hospital, West Bromwich; and Royal Free Hospital, London. Particularly, the authors thank Professor Yit Yang, who was instrumental in project development, selection of clinically relevant endpoints, development of the protocol, and study design. We also thank Professor Yit Yang for his comments on the draft manuscript. The authors thank SVMPharma for collating the data, Dafydd Williams for initial data preparation and analysis, and Sara Jenkins-Jones for her editorial work.
Related Research Data
References
- Chan A, Duker JS, Ko TH, et al. Normal macular thickness measurements in healthy eyes using stratus optical coherence tomography. Arch Ophthalmol 2006;124:193-8
- Alamouti B, Funk J. Retinal thickness decreases with age: an OCT study. Br J Ophthalmol 2003;87:899-901
- Campochiaro PA, Brown DM, Pearson A, et al. Long-term benefit of sustained-delivery fluocinolone acetonide vitreous inserts for diabetic macular edema. Ophthalmology 2011;118:626-35
- Campochiaro PA, Brown DM, Pearson A, et al. Sustained delivery fluocinolone acetonide vitreous inserts provide benefit for at least 3 years in patients with diabetic macular edema. Ophthalmology 2012;119:2125-32
- Early Treatment Diabetic Retinopathy Study research group. Photocoagulation for diabetic macular edema. Early Treatment Diabetic Retinopathy Study report number 1. Arch Ophthalmol 1985;103:1796-806
- Wells JA, Glassman AR, Ayala AR, et al. Aflibercept, bevacizumab, or ranibizumab for diabetic macular edema. Two-year results from a comparative effectiveness randomized clinical trial. Ophthalmology 2016;123:1351-9
- Brown DM, Nguyen QD, Marcus DM, et al. Long-term outcomes of ranibizumab therapy for diabetic macular edema: the 36-month results from two phase III trials: RISE and RIDE. Ophthalmology 2013;120:2013-22
- Elman MJ, Ayala A, Bressler NM, et al. Intravitreal ranibizumab for diabetic macular edema with prompt vs. deferred laser treatment: 5-year randomized trial results. Ophthalmology 2015;122:375-81
- The Diabetic Retinopathy Clinical Research Network. Aflibercept, bevacizumab, or ranibizumab for diabetic macular edema. N Engl J Med 2015;372:1193-203
- Holden SE, Currie CJ, Owens DR. Evaluation of the clinical effectiveness in routine practice of fluocinolone acetonide 190 µg intravitreal implant in people with diabetic macular edema. Curr Med Res Opin 2017;33(Suppl):5--17
- Haukoos JS, Newgard CD. Advanced statistics: missing data in clinical research—part 1: an introduction and conceptual Framework. Acad Emerg Med 2007;14:662-8
- Wolf-Schnurrbusch UEK, Ceklic L, Brinkmann CK, et al. Macular thickness measurements in healthy eyes using six different optical coherence tomography instruments. Invest Ophthalmol Vis Sci 2009;50:3432-7
- Sandberg MA, Brockhurst RJ, Gaudio AR, et al. The association between visual acuity and central retinal thickness in retinitis pigmentosa. Invest Ophthalmol Vis Sci 2005;46:3349-54
- Danis RP, Sadda S, Jiao J, et al. Relationship between retinal thickness and visual acuity in eyes with retinal vein occlusion treated with dexamethasone implant. Retina 2016;36:1170-6
- Ristau T, Keane PA, Walsh AC, et al. Relationship between optical coherence tomography retinal parameters and visual acuity in neovascular age-related macular degeneration. Ophthalmologica 2014;231:37-44
- Hannouche RZ, De Avila MP. Retinal thickness measurement and evaluation of natural history of the diabetic macular edema through optical coherence tomography. Arq Bras Oftalmol 2009;72:433-8
- Diabetic Retinopathy Clinical Research Network. The relationship between OCT-measured central retinal thickness and visual acuity in diabetic macular edema. Ophthalmology 2007;114:525-36
- Noda Y, Ogawa A, Toyama T, et al. Long-term increase in subfoveal choroidal thickness after surgery for senile cataracts. Am J Ophthalmol 2014;158:455-9
- Treumer F, Wacker N, Junge O, et al. Foveal structure and thickness of retinal layers long-term after surgical peeling of idiopathic epiretinal membrane. Invest Ophthalmol Vis Sci 2011;52:744-50
- Yang Y, Bailey C, Holz FG, et al. Long-term outcomes of phakic patients with diabetic macular oedema treated with intravitreal fluocinolone acetonide (FAc) implants. Eye 2015;29:1173-80
- Takahashi A, Nagaoka T, Sato E, et al. Effect of panretinal photocoagulation on choroidal circulation in the foveal region in patients with severe diabetic retinopathy. Br J Ophthalmol 2008;92:1369-73
- Nguyen QD, Brown DM, Marcus DM, et al. Ranibizumab for diabetic macular edema: results from 2 phase III randomized trials: RISE and RIDE. Ophthalmology 2012;119:789-801
- Michaelides M, Kaines A, Hamilton RD, et al. A prospective randomized trial of intravitreal bevacizumab or laser therapy in the management of diabetic macular edema (BOLT study). 12-month data: report 2. Ophthalmology 2010;117:1078-86
- Nguyen QD, Shah SM, Heier JS, et al. Primary end point (six months) results of the Ranibizumab for Edema of the mAcula in Diabetes (READ-2) study. Ophthalmology 2009;116:2175-81
- Mitchell P, Bandello F, Schmidt-Erfurth U, et al. The RESTORE study: ranibizumab monotherapy or combined with laser versus laser monotherapy for diabetic macular edema. Ophthalmology 2011;118:615-25
- The Diabetic Retinopathy Clinical Research Network, Elman MJ, Aiello LP, et al. Randomized trial evaluating ranibizumab plus prompt or deferred laser or triamcinolone plus prompt laser for diabetic macular edema. Ophthalmology 2010;117:1064-77
- Massin P, Bandello F, Garweg J, et al. Safety and efficacy of ranibizumab in diabetic macular edema (RESOLVE study*). A 12-month randomized, controlled, double-masked, multicenter phase II study. Diabetes Care 2010;33:2399-405
- National Institute for Health and Care Excellence. Ranibizumab for treating diabetic macular oedema. Technology appraisal guidance [TA274]; 2013. Available at: https://www.nice.org.uk/guidance/ta274. [Last accessed February 27, 2013]
- National Institute for Health and Care Excellence. Aflibercept for treating diabetic macular oedema. Technology appraisal guidance [TA346]; 2015. Available at: https://www.nice.org.uk/guidance/ta346. [Last accessed May 8, 2016]
- National Institute for Health and Care Excellence. Fluocinolone acetonide intravitreal implant for treating chronic diabetic macular oedema after an inadequate response to prior therapy; 2013. Available at: www.nice.org.uk/guidance/ta301. [Last accessed October 24, 2014]
- El-Ghrably I, Steel DHW, Habib M, et al. Diabetic macular edema outcomes in eyes treated with fluocinolone acetonide 0.2 µg/d intravitreal implant: real-world UK experience. Eur J Ophthalmol 2017;27:357-62
- Elaraoud I, Andreatta W, Kidess A, et al. Use of flucinolone acetonide for patients with diabetic macular oedema: patient selection criteria and early outcomes in real world setting. BMC Ophthalmol 2016;16:3
- Figueira J, Henriques J, Amaro M, et al. A nonrandomized, open-label, multicenter, phase 4 pilot study on the effect and safety of ILUVIEN® in chronic diabetic macular edema patients considered insufficiently responsive to available therapies (RESPOND). Ophthalmic Res 2017;57:166-72
- Massin P, Erginay A, Dupas B, et al. Efficacy and safety of sustained-delivery fluocinolone acetonide intravitreal implant in patients with chronic diabetic macular edema insufficiently responsive to available therapies: a real-life study. Clin Ophthalmol 2016;10:1257-64