
Abstract
Objective: To compare the multi-biomarker disease activity (MBDA) score with the DAS28-CRP and CRP for predicting risk of radiographic progression in patients with rheumatoid arthritis.
Methods: Published studies of the MBDA score and radiographic progression with ≥100 patients per cohort were evaluated. Rates of radiographic progression over 1 year were determined across the low/moderate/high categories for MBDA score (low/moderate/high: <30, 30–44, >44), DAS28-CRP (low/moderate/high: ≤2.67, >2.67–4.09, >4.09) and CRP (low/moderate/high: ≤10, >10–30, >30 mg/L), with positive and negative predictive value (PPV, NPV) and relative risk (RR) determined for high vs. not-high (i.e. low and moderate combined) categories. Patient-level data from studies having all three measures was pooled to: (1) determine a combined RR for radiographic progression in the high vs. not-high categories for each measure; and (2) compare the predictive ability of MBDA score vs. DAS28-CRP by comparing the rates of radiographic progression observed in subgroups created by cross-classifying the high and not-high categories of each measure.
Results: Five cohorts were identified for inclusion (total N=929). In each, radiographic progression was more frequent with increasing MBDA scores. Among the three cohorts with requisite data, PPVs were generally similar using categories of MBDA score, DAS28-CRP or CRP but NPVs were greater for MBDA score (93–97%) than DAS28-CRP or CRP (77–87%). RRs for radiographic progression were greater when based on categories of MBDA score than DAS28-CRP or CRP and the combined RR was greater for MBDA score (4.6, p < .0001) than DAS28-CRP (1.7, p = .02) or CRP (1.7, p = .002). For patients cross-classified by MBDA score and DAS28-CRP, high vs. not-high MBDA score significantly predicted radiographic progression independently of DAS28-CRP.
Conclusions: High and not-high MBDA scores were associated with increased and low risk, respectively, for radiographic progression over one year. MBDA score was a better predictor of radiographic progression than DAS28-CRP or CRP.
Introduction
The primary goals of treatment for rheumatoid arthritis (RA) are to control inflammation, prevent joint damage and minimize disability. Guidelines recommend that RA disease activity be assessed regularly, with treatment adjusted as needed to achieve remission or the lowest possible level of disease activityCitation1,Citation2. The conventional measures for assessing RA disease activity involve various combinations of joint counts and physician and patient global assessment, which are partially subjective and variable between physicians, and blood testing for C-reactive protein (CRP) or erythrocyte sedimentation rate, which can be normal in patients with active diseaseCitation3.
The multi-biomarker disease activity (MBDA) blood test measures 12 protein biomarkers in the serum of RA patients and uses a validated algorithm to produce a score on a scale of 1–100 that objectively represents the current level of RA disease activityCitation4,Citation5. The MBDA score correlates with the Disease Activity Score with 28 joints using CRP (DAS28-CRP) and other clinical measures of disease activity, and change in MBDA score correlates with change in DAS28-CRP and other measuresCitation4,Citation6,Citation7. The MBDA score was validated in seropositive and seronegative patients with RA and in patients receiving conventional synthetic disease modifying anti-rheumatic drugs (DMARDs) and TNF inhibitors (TNFi)Citation4. Spearman’s rank correlations for MBDA score vs. DAS28-CRP, Simplified Disease Activity Index (SDAI) and Clinical Disease Activity Index (CDAI) were 0.66, 0.67 and 0.56, respectively (all p < .0001)Citation7. In seropositive patients, Pearson’s correlation coefficient for MBDA score vs. Routine Assessment of Patient Index Data was 0.47 (p < .001)Citation4.
That the MBDA score detects not only clinically meaningful disease activity but also severity has been supported by studies demonstrating its association with radiographic progression, as assessed with the van der Heijde modified Sharp score (SHS)Citation8. In several studies, rate of radiographic progression over one year was greatest among patients with baseline MBDA scores in the high category (>44) and lowest among patients with baseline MBDA scores in the low category (<30)Citation9–14. Patients with moderate MBDA scores (30–44) tended to have progression rates almost as low as those with low MBDA scores. Cross-classification analyses showed that the MBDA score predicted risk for radiographic progression even when it was discordant with DAS28-CRP or CRP, such as when the MBDA score was high and conventional measures indicated low disease activityCitation14. Multivariate analyses showed that the MBDA score was the strongest independent predictor of radiographic progression, compared with DAS28-CRP, CRP and other risk factors for radiographic progressionCitation9,Citation10,Citation13,Citation14.
The ability of MBDA score to predict radiographic progression suggests that it has potential to help physicians assess risk for radiographic progression in their patients. It also supports the clinical validation of the MBDA score with radiographic evidence that the MBDA score detects disease activity that is not always captured by clinical measures but has the ability to induce joint damage. Studies that examined the relationship between MBDA score and radiographic progression are diverse and have never been evaluated collectively. The purpose of the present study was to systematically analyze prior studies to evaluate the ability of the MBDA score to predict radiographic progression and, in combined analyses, to compare this ability with those of DAS28-CRP and CRP.
Methods
Review of the literature
Studies that analyzed the association between MBDA score and risk for radiographic progression were identified for the present study by a review of the literature, based on a PubMed search of the terms “multi-biomarker rheumatoid” and “multibiomarker rheumatoid”, last updated 8 October 2018. All studies that analyzed the association between MBDA score and risk for radiographic progression were initially selected. Studies of same cohorts that did not add new data to the analyses of radiographic progression specified here were excluded, as were studies in which the primary purpose was to evaluate treatment withdrawal and studies that analyzed MBDA score as a predictor of radiographic progression only for groups of <100 patients.
Clinical measures
DAS28-CRP was selected for analysis because it was available from more of the selected studies than other clinical composite disease activity measures (e.g. CDAI or SDAI). The DAS28-CRP categories employed here, remission/low ≤2.67 (termed “low”, hereafter), moderate >2.67–4.09 and high >4.09, have been established previouslyCitation15. DAS28-CRP categorical data were obtained from publications that used these categoriesCitation10,Citation12 or new analyses of patient-level data, if availableCitation9. If neither option was possible, the categories used previously for DAS28-CRP in that study, such as the conventional DAS28-ESR categories of remission/low <3.2, moderate 3.2–5.1 and high >5.1, were used hereCitation16,Citation17. The CRP categories employed here were low ≤10 mg/L, moderate >10–30 mg/L and high >30 mg/L, to be consistent with prior publications on the MBDA scoreCitation10,Citation14 and with the ACR/EULAR definition of Boolean remission (CRP < 10 mg/L)Citation18. CRP data was obtained from published resultsCitation10 or from patient-level dataCitation9,Citation12, if available.
Radiographic measures
Studies to be included here were required to have obtained radiographs of hands and feet at baseline and Year 1, to have scored them with the total Sharp score (TSS) or SHS and to have used the data to evaluate the association between MBDA score and risk for radiographic progression. For the present analyses, patients were characterized as progressors or non-progressors according to change (Δ) in TSS or SHS from baseline to Year 1, based on thresholds for radiographic progression published previously for each respective study.
Multi-Biomarker Disease Activity score measurement
For each cohort included here, MBDA testing had been performed previously on serum samples that had been shipped frozen to the laboratories of Crescendo Bioscience Inc., in South San Francisco, CA, USA, for testingCitation9,Citation10,Citation12,Citation16,Citation17. Serum concentrations were determined by electrochemiluminescence-based multiplexed sandwich immunoassays (Meso Scale Discovery, Rockville, MD, USA) for the following 12 biomarkers: vascular cell adhesion molecule 1, epidermal growth factor, vascular endothelial growth factor, interleukin 6, TNF receptor type I, matrix metalloproteinase (MMP) 1, MMP-3, bone glycoprotein 39 (YKL-40), leptin, resistin, serum amyloid A and CRPCitation5. The MBDA score was calculated on a scale of 1–100 using a previously validated algorithmCitation4,Citation5. MBDA disease activity categories were low <30, moderate 30–44 and high >44, as established previouslyCitation4. Samples from all cohorts were tested with the same types of reagents and instrument, and MBDA scores were determined with the same algorithm as are used for the Vectra test, which has been commercially available in the United States since 2010.
Statistical analyses
Data availability
The methodology of this study was adapted to be aligned with the availability of patient-level data from the selected studies, after they were identified, and to fill gaps in published analyses, where needed. Among the studies identified for the present analyses (Leiden University Early Arthritis Clinic (Leiden)Citation12,Citation14, the Optimized Treatment Algorithm for Patients with Early Rheumatoid Arthritis trial (OPERA)Citation9, the Swedish Farmacotherapy trial (SWEFOT)Citation10 and the Abatacept versus Adalimumab Comparison in Biologic-Naive RA Subjects with Background Methotrexate trial (AMPLE)Citation16,Citation17, patient-level data were available for cohorts from Leiden, OPERA and SWEFOT. Patient-level data were not available from the AMPLE study. Analyses of AMPLE were thus restricted to group-level data that could be analyzed based on published results.
Distribution of disease activity
The distributions of patients in the low, moderate and high disease activity categories of MBDA score, DAS28-CRP and CRP, as defined above, were determined from published data, preferentially, or patient-level data, at the same timepoint used in previous studies of the relationship between disease activity and radiographic progression (i.e. baseline for Leiden, OPERA and SWEFOT, and Year 1 for AMPLE).
Association between radiographic progression and disease activity
The association between radiographic progression from baseline to Year 1 and disease activity was evaluated by determining the percentages of patients with radiographic progression within low, moderate and high disease activity categories for MBDA score, DAS28-CRP and CRP. Based on data availability, these analyses used published data, preferentially, or patient-level data. Radiographic progression in the Leiden registry cohort was analyzed for each disease activity measure with patient-level data and included only baseline visits (N = 163), rather than all 271 visits as in previous reportsCitation12,Citation14. Radiographic progression in OPERA had not been previously reported by CRP categoryCitation9, which was analyzed here using patient-level data. The other analyses of radiographic progression by disease activity category for OPERA and all those for SWEFOT used published results, with patient-level data used for confirmationCitation9,Citation10. Radiographic progression in AMPLE, for which patient-level data were unavailable, had not been previously reported by category of DAS28-CRP or CRPCitation16,Citation17. Thus, it was analyzed here only by category of MBDA score. Disease activity was categorized at the same timepoint used in previously published analyses of the MBDA score as a predictor of risk for radiographic progression (baseline for Leiden, OPERA and SWEFOT, Year 1 for AMPLE). Progressors were defined here using the previously published ΔSHS threshold for each cohort. The Cochran–Armitage trend test was used to determine whether the rates of radiographic progression exhibited a trend, from the low to moderate to high disease activity categories, with p values <.05 considered significant.
Sensitivity, specificity, positive predictive value, negative predictive value and relative risk
Data used to evaluate the association between radiographic progression and disease activity category were also used to determine the corresponding values for sensitivity, specificity, positive predictive value (PPV), negative predictive value (NPV) and relative risk (RR), with disease activity categorized as high or not-high (i.e. low and moderate categories together) and radiographic progression defined for each study using the previously published threshold for ΔSHS. The moderate and low groups were analyzed together because radiographic progression rates in the moderate groups were more similar to those in the low group than the high groupCitation9,Citation10,Citation12,Citation14, and because prior analyses demonstrated an upward inflection in the progression rate as MBDA scores entered the high categoryCitation14. PPV for MBDA score, DAS28-CRP or CRP was calculated as the percentage of patients in the high disease activity category who had radiographic progression from baseline to Year 1. NPV was calculated as the percentage of patients in the combined low and moderate (i.e. not-high) disease activity categories who did not have radiographic progression at Year 1. Relative risk (RR) of radiographic progression, with 95% confidence interval (CI), was calculated for patients with high vs. not-high MBDA score (>44 vs. ≤44), DAS28-CRP (>4.09 vs. ≤4.09) or CRP (>30 vs. ≤30 mg/L), respectively, as PPV/(100 - NPV). Statistical significance for the RR of each disease activity measure was determined by Fisher’s exact test; p values <.05 were considered significant.
Combined analysis of relative risk for radiographic progression
Data on the numbers of progressors by category of disease activity for individual cohorts were pooled to determine the overall RR for radiographic progression (with 95% CI) for the high vs. not-high categories of baseline MBDA score, DAS28-CRP and CRP. Data were pooled only for cohorts for which RR could be determined for all three measures (i.e. Leiden, OPERA and SWEFOT). The methodology was the same as for determining RR in the individual cohorts, described above.
Comparison of Multi-Biomarker Disease Activity score and DAS28-CRP as predictors of radiographic progression by cross-classification
Patient-level data on progressor status, and category of MBDA score and DAS28-CRP were pooled to cross-classify patients into four subgroups, based on high or not-high baseline MBDA score and DAS28-CRP. The percentage of patients with radiographic progression from baseline to one year was determined for each subgroup, with radiographic progression defined using the published cohort-specific thresholds. Only cohorts for which RR could be determined for MBDA score and DAS28-CRP were included (i.e. Leiden, OPERA and SWEFOT); p values for comparisons between subgroups were determined by Fisher’s exact test.
Results
Patient cohorts
A review of the literature identified four studies and, from them, five cohorts of at least 100 patients each (total N = 929), that were suitable for inclusion in this analysis (). These cohorts were from the Leiden University Early Arthritis Clinic (N = 163)Citation12,Citation14, the OPERA trial (N = 164)Citation9, the SWEFOT trial (N = 235)Citation10 and the AMPLE trial (two cohorts: abatacept arm, N = 181 and adalimumab arm, N = 186)Citation16,Citation17.
Figure 1. Literature review study design and results.
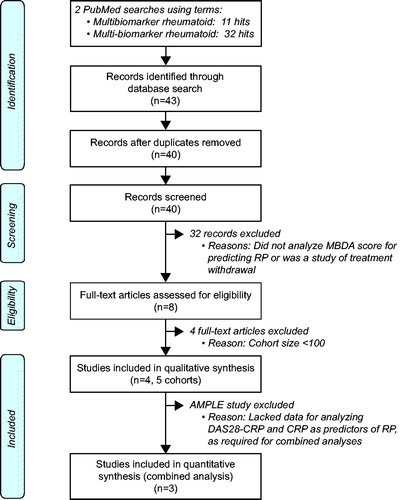
The Leiden cohort comprised a representative, cross-sectional sampling of patients from that registry who were receiving non-biologic DMARDs, of whom <5% were receiving a TNFi by one year from the baseline MBDA sampleCitation12,Citation14. The OPERA, SWEFOT and AMPLE cohorts were from the first year of randomized trials that initiated new treatments at baseline, and were selected on the basis of sample availability for MBDA testingCitation9,Citation10,Citation17; OPERA and SWEFOT each employed tight-control strategies for patients with recent onset RA; OPERA randomized patients to two arms, where methotrexate was given either as monotherapy or in combination with adalimumab, with each arm following a tight-control strategy that included intra-articular corticosteroid injections; SWEFOT treated all patients with methotrexate monotherapy from baseline and, at three months, randomized patients with DAS28 > 3.2 to add either hydroxychloroquine and sulfasalazine or infliximab, with all other patients (DAS28 ≤ 3.2) continuing methotrexate monotherapy. AMPLE initiated continuous treatment with abatacept or adalimumab at baseline for patients with established RA and inadequate response to methotrexateCitation19. The present analyses used the same cohorts as those described in previous reports of the MBDA score as a predictor of radiographic progressionCitation9,Citation10,Citation12,Citation14,Citation16,Citation17. For OPERA and SWEFOT, respectively, all patients were analyzed as a single group. For AMPLE, the abatacept and adalimumab arms were analyzed separately. The characteristics of these cohorts have been previously described in detail and are summarized in .
Table 1. Study designs and baseline data for cohorts used to analyze the relationship between radiographic progression and MBDA score.
Distributions of disease activity
For each cohort, the distributions of patients across disease activity categories were assessed at the timepoint used to analyze the relationship between disease activity and radiographic progression. At baseline, MBDA score and DAS28-CRP were high for most patients in the OPERA and SWEFOT cohorts, whereas MBDA score and DAS28-CRP were low or moderate for the majority of patients from Leiden at baseline and AMPLE at Year 1 (Supplemental Figure 1). Year 1 was the only timepoint at which categorical MBDA data were available in analyses of radiographic progression from baseline to Year 1 for AMPLECitation16,Citation17. Patients tended to be in higher disease activity categories by the MBDA score compared with CRP in the Leiden, OPERA and SWEFOT cohorts and compared with DAS28-CRP in the Leiden and AMPLE cohorts (Supplemental Figure 1). Data were not available from AMPLE for categorizing patients by CRP category.
Association between radiographic progression and disease activity
When patients were grouped by MBDA category, the percentage of patients with radiographic progression was greatest among patients with high MBDA scores and least among those with low MBDA scores (). This trend was statistically significant in all five cohorts. The magnitude of trend, from low to high MBDA category, was similar for the five cohorts, even though the overall rates of progression were greater for the Leiden, OPERA and SWEFOT cohorts (17–26%), in which not all patients received a biologic agent, than the AMPLE cohorts (10%, 11%), where all patients were randomized to receive abatacept or adalimumab for the entire year of radiographic assessment ().
Figure 2. Percentages of patients with radiographic progression within categories of MBDA score, DAS28-CRP or CRP measured at baseline (Leiden, OPERA and SWEFOT) or Year 1 (AMPLE). Cohorts are from previously published analyses of MBDA score and radiographic progression (see ). No patients were in the low DAS28-CRP category for OPERA or SWEFOT at baseline. Radiographic data by category of DAS28-CRP or CRP was not available for AMPLE. Radiographic progression thresholds were as previously defined for each study (in footnotes and ); p values are by Cochran–Armitage trend test.
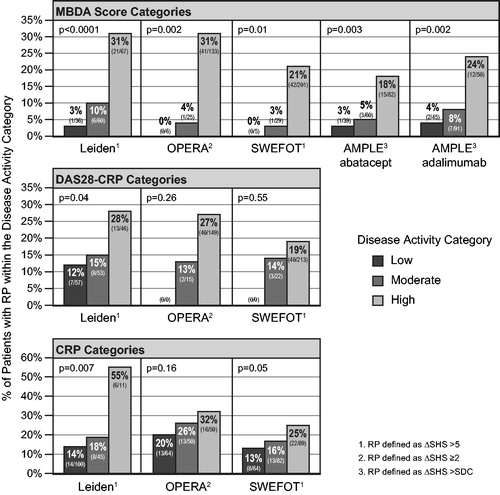
Table 2. Prediction of radiographic progression by the MBDA score, DAS28-CRP or CRP by grouping patients in the high and not-high (i.e. low/moderate) categories for each measure.
Trends were also observed in the rates of radiographic progression across categories of DAS28-CRP and CRP for the cohorts from Leiden, OPERA and SWEFOT (studies for which those data were available), but they were not statistically significant or were less significant than across MBDA categories (). Radiographic progression was observed in greater percentages of patients in the low or moderate disease activity categories of DAS28-CRP or CRP (12–26%) than in the low (0–4%) or moderate (3–10%) categories of MBDA score (). For each measure, rates of progression in the moderate categories were numerically closer to those observed in the low categories than the high categories (noting that the progression rate in the low CRP category of OPERA is 20.3%).
Sensitivity, specificity, positive predictive value, negative predictive value and relative risk for radiographic progression
In the Leiden, OPERA and SWEFOT cohorts, sensitivity for radiographic progression, using high and not-high disease activity categories, was numerically greatest when based on MBDA categories (); specificity was greatest with CRP categories. Results in the AMPLE cohorts, for which only MBDA results were available, were most similar to those from Leiden.
PPVs for radiographic progression, based on the high MBDA category, were 18–31% among the five cohorts (, ). PPVs based on the high DAS28-CRP or CRP categories were similar to the MBDA-score-based PPVs in the Leiden, OPERA and SWEFOT cohorts, although the Leiden high-CRP category, with only 11 patients, had a PPV of 55%. NPVs for radiographic progression based on MBDA categories were 93–97% among the five cohorts (). For the Leiden, OPERA and SWEFOT cohorts, these NPVs were all numerically greater than those obtained with DAS28-CRP or CRP categories (77–87%). The relative risks for radiographic progression, based on high vs. not-high categories in the Leiden, OPERA and SWEFOT cohorts, were greater when based on MBDA categories (4.3–9.6) than DAS28-CRP (1.4–2.1) or CRP (1.4–3.6) categories (). In the OPERA and SWEFOT cohorts, the RRs were statistically significant only with MBDA categories.
Combined analysis of relative risk for radiographic progression
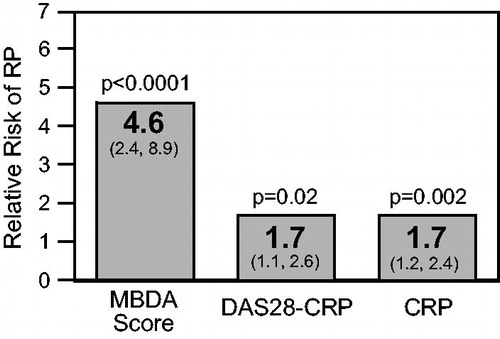
Data from cohorts in which radiographic progression could be assessed by category of MBDA score, DAS28-CRP and CRP – the Leiden, OPERA and SWEFOT cohorts – were pooled to determine the overall relative risks for progression for each measure. The combined RR of radiographic progression, comparing individuals with a high MBDA score (>44) to all others (≤44), was 4.6 (p = .0001, 95% CI: 2.4–8.9), which was approximately three times as large as the corresponding RRs based on categories of DAS28-CRP (1.7, p = .02, 95% CI: 1.1–2.6) or CRP (1.7, p = .002, 95% CI: 1.2–2.4) ().
Figure 3. Combined analyses of relative risk (RR) for radiographic progression when disease activity is high for patients from the Leiden, OPERA and SWEFOT cohorts, using three disease activity measures at baseline. N = 562 for MBDA score (high: >44); N = 555 for DAS28-CRP (high: >4.09) and CRP (high: >30 mg/L). Radiographic progression thresholds were as previously defined for each study (). RRs are in bold; 95% confidence intervals are in parentheses; p values are by Fisher’s exact test.
Comparison of Multi-Biomarker Disease Activity score and DAS28-CRP by cross-classification
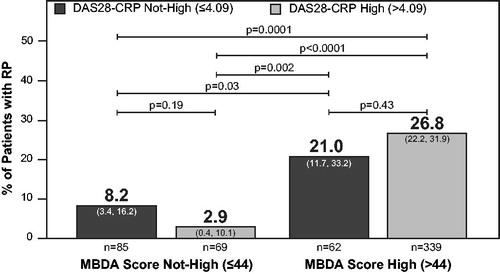
To further compare the abilities of MBDA score and DAS28-CRP to predict radiographic progression in the combined Leiden, OPERA and SWEFOT cohorts, patients were cross-classified into four subgroups based on high and not-high categories of MBDA score and DAS28-CRP. The percentages of patients with radiographic progression were highest when the baseline MBDA score was high and lowest when it was not high (). This result was observed both when MBDA score and DAS28-CRP were concordant (p = .0001), which occurred in 76% of patients, and when they were discordant (i.e. one high, the other not high; p = .002), which occurred in 24% of patients. In particular, among the 147 patients whose DAS28-CRP was not high, 62 (42%) had a high MBDA score; among them, the percentage of patients with radiographic progression (21%) was significantly greater than when DAS28-CRP and MBDA score were both not high (8.2%, p = .03) (). By contrast, the DAS28-CRP did not significantly discriminate risk of radiographic progression among patients grouped by MBDA category (p = .43 for DAS28-CRP when MBDA scores were high; p = .19 for DAS28-CRP when MBDA scores were not high).
Figure 4. Radiographic progression in subgroups created by cross-classifying patients into high or not-high (i.e. low or moderate) categories of MBDA score and DAS28-CRP at baseline. Analysis was restricted to patients with baseline MBDA score and DAS28-CRP data from the Leiden, OPERA and SWEFOT cohorts (N = 555). The percentage of progressors in a subgroup and the 95% confidence interval are for the total number of patients in that subgroup (n). Radiographic progression thresholds were as previously defined for each study ().
Discussion
These analyses of five cohorts of RA patients with different disease activity and treatment histories show that a high MBDA score was consistently a significant predictor of increased risk for radiographic progression, and a low or moderate MBDA score was consistently a strong predictor of low risk for radiographic progression. When RRs were determined for multiple cohorts combined, the relative risk of radiographic progression was approximately three times as large when based on categories of MBDA score versus categories of DAS28-CRP or CRP. Based on these results, the MBDA score had a stronger association with joint-damaging inflammation over the following year than did the conventional clinical (DAS28-CRP) or biochemical (CRP) measures of RA disease activity that were assessed here.
The most notable finding in the analyses of individual studies was that rates of radiographic progression in the low and moderate categories of MBDA score approached zero and, thus, the corresponding NPVs approached 100% (93–97% in the five cohorts). By contrast, radiographic progression rates were higher (12–25%) and NPVs were lower (77–87%) for low or moderate categories based on DAS28-CRP or CRP. This difference is clinically relevant because it implies that a not-high MBDA score provides greater confidence that a patient will not progress than do not-high values of DAS28-CRP or CRP. This finding may have value for patients who have not attained a target of clinical low disease activity but have nevertheless achieved a low or moderate MBDA score.
We found that for all three measures, MBDA score, DAS28-CRP and CRP, the high disease activity category was associated with the highest rate of radiographic progression, with PPVs of 18–32% (in the groups with more than 11 patients). The range of PPVs observed here is consistent with the relatively low overall rates of radiographic progression in these studies and with evidence that radiographic progression can be disconnected from clinical stateCitation20. High MBDA scores may be informative when conventional measures detect low disease activity. Previous analyses of the Leiden and SWEFOT cohorts found that high MBDA scores identified patients at increased risk for progression among those who were in DAS28-CRP remissionCitation12, had low CRP (<1.0 mg/dL)Citation10,Citation14 or had no swollen jointsCitation14. Those findings, reinforced by the present analyses, suggest that the MBDA score detects subclinical disease. They are also consistent with evidence that, in RA patients who are in sustained clinical remission, MRI frequently detects synovitis and osteitis, which are associated with structural progressionCitation21,Citation22, and with a study of >9000 patients with clinically active RA, among whom the majority had a CRP concentration in the normal rangeCitation3.
Combined analysis of data from three studies found the MBDA score was approximately three times as effective as DAS28-CRP or CRP for predicting radiographic progression (). Previously, cross-classification analyses and multivariate analyses showed the MBDA score was an independent predictor of risk for radiographic progression, compared with conventional risk factorsCitation9,Citation10,Citation13,Citation14. In our cross-classification analysis of three cohorts combined, these findings were confirmed because radiographic progression was most frequent when MBDA score was high, both when DAS28-CRP was high and when it was not high (). These radiographic findings imply that the MBDA score has potential to detect subclinical inflammation that is not apparent on joint examination and, conversely, to identify patients with non-inflammatory pain, as when the DAS28-CRP is elevated and the MBDA score is not. Matrix analyses have shown complementarity among conventional predictors of risk for radiographic progressionCitation23–27. Similarly, the MBDA score is complementary to DAS28-CRP and CRPCitation10,Citation12–14. For patients with discordant MBDA score and DAS28-CRP, physicians need to evaluate all available information to treat symptoms optimally and to limit radiographic progression.
Two of the cohorts in the combined analyses, OPERA and SWEFOT, were skewed toward patients with high disease activity because those studies enrolled only patients with clinically active, untreated disease (Supplemental Figure 1)Citation9,Citation10. By contrast, typical clinical practice populations may have larger proportions of patients with not-high (i.e. low or moderate) DAS28-CRP and, as a result, proportionally more discordance between DAS28-CRP and MBDA score, either as not-high DAS28-CRP/high MBDA score or high DAS28-CRP/not-high MBDA score. This effect was observed in the cohort from the Leiden registry, where these types of discordance were observed in 35% of patient visitsCitation14, compared with 24% of patients in the OPERA, SWEFOT and Leiden cohorts combined () and with 19% of patients from SWEFOT aloneCitation10.
The two AMPLE cohorts were derived from a clinical trial that enrolled previously treated patients with clinically active disease (DAS28-CRP >3.2)Citation19. These cohorts were the only ones where every patient was randomized to receive a biologic treatment for the entire time analyzed, making their results complementary to those of the other cohorts. A prior reportCitation16,Citation17 analyzed the relationship between radiographic progression and MBDA scores in AMPLE differently from the present study, where we re-analyzed published data from AMPLECitation16,Citation17 in terms of the percentage of progressors within each disease activity categoryCitation28. The associations we found between MBDA score and radiographic progression in AMPLE resembled those obtained in the Leiden, OPERA and SWEFOT cohorts, even though in AMPLE the overall rates of progression were lower than in the other three cohorts and the risk for radiographic progression in AMPLE was analyzed using MBDA scores from the end of Year 1, rather than baseline – an approach that, although not ideal, has been used previouslyCitation29 and was predicated here on the unavailability of patient-level data from AMPLE. The findings obtained here for AMPLE are also consistent with studies which found that, while treatment with a biologic plus MTX reduced the rate of radiographic progression at all levels of clinical response, the rate of progression was greatest among patients with poor clinical responsesCitation29,Citation30.
A limitation of this study is that it analyzed only five cohorts, as it was restricted to published studies with data available for at least 100 patients per cohort. Analyses of the relationship between radiographic progression and MBDA score have also been reported for cohorts from four other studies of newly initiated treatments: for patients with recent onset RA from CAMERACitation6 and BeStCitation13, which are studies of tight-control treatment strategies, and for two studies of patients with long-standing RA treated with TNF inhibitorsCitation31,Citation32. These four studies were not included here because of small sample size. For patients from the CAMERA study, a multivariate logistic regression analysis found that baseline MBDA score was borderline significant (p = .09) as an independent predictor of radiographic progression, whereas DAS28 was not a significant predictor (p = .60)Citation6. Analyses of patients from BeSt found a significant association between baseline MBDA score and radiographic progression, with MBDA score predicting progression independently of DAS and other predictors in a multivariate analysisCitation13. In a study of patients receiving adalimumab, etanercept or infliximab, baseline MBDA score was significantly associated with radiographic progression and, among patients with low baseline DAS28, radiographic progression was greater among patients with moderate or high baseline MBDA scores than those with low MBDA scoresCitation31. In the HURRAH study, after six months of treatment with adalimumab plus MTX, MBDA score, MRI and ultrasound were generally concordant in showing signs of inflammation in patients with DAS28-CRP < 2.6, and MBDA scores were elevated in all patients with damage progressionCitation32. The results of these studies are consistent with those analyzed here.
We recognize that the studies we analyzed differed in the thresholds for ΔSHS they used to define radiographic progression over one year ( and ). OPERA and AMPLE used the SDC, which is unique for each study, and Leiden and SWEFOT used 5 Sharp units per year, typically considered a definition of rapid radiographic progressionCitation23. For each study, the patient population and treatment regimen had a unique relationship to risk for radiographic progression and radiographs were read independently, with readers aligned within but not between studies. Thus, to preserve those relationships, we classified patients in a binary way as progressors or non-progressors in each study using their respective thresholds for radiographic progression.
Conclusions
In conclusion, we performed a review of the literature to evaluate prior analyses of the MBDA score as a predictor of risk for radiographic progression. Five cohorts that included patients receiving diverse non-biologic and biologic treatments in early or established RA fulfilled inclusion criteria. In all studies, a high MBDA score was associated with greater risk for radiographic progression over one year than low or moderate MBDA scores, and a low MBDA score was associated with very low absolute risk for radiographic progression. MBDA score had a greater NPV for radiographic progression than DAS28-CRP or CRP, suggesting that it was the best performing instrument of the three for identifying which patients are at little or no risk for radiographic progression. A combined analysis comparing patients with high vs. not-high disease activity demonstrated that MBDA score was approximately three times better for predicting radiographic progression than DAS28-CRP or CRP. These findings suggest that the MBDA score is a more accurate measure than DAS28-CRP or CRP for assessing pathologically meaningful disease activity that damages joints.
Transparency
Declaration of funding
This work was supported by Crescendo Bioscience Inc.
Author contributions
J.R.C. and E.H.S. contributed to the conception and design of the review. E.H.S. performed the literature search and selected papers. C.H.B., M.Ø., M.L.H., K.H., S.S. and T.W.H. designed and/or conducted the clinical trials included in analyses, from which they contributed primary data. Extraction of published data, and the design and performance of analyses of published and primary data, were by J.R.C., X.W., D.D.F. and E.H.S. J.R.C. and E.H.S. drafted the paper, with revisions for important intellectual content made by J.R.C., C.H.B., M.Ø., M.L.H., K.H., S.S., E.H.S. and T.W.H. All authors gave final approval of the submitted manuscript.
Declaration of financial/other relationships
J.R.C. has disclosed that he has received grant/research support from Crescendo Bioscience Inc. and is a consultant for Crescendo Bioscience Inc. C.H.B. has received grant/research support from Crescendo Bioscience Inc. M.Ø. has disclosed that he has received grant/research support from AbbVie, BMS, Boehringer-Ingelheim, Crescendo Bioscience Inc., Eli Lilly, Janssen, Merck, Pfizer, Roche, UCB, Celgene, Sanofi, Regeneron and Novartis. M.L.H. has disclosed that she has received grant/research support from AbbVie, Biogen, BMS, MSD, Pfizer, Crescendo Bioscience Inc., UCB, Eli Lilly, Novartis and Roche; and has been a member of a speakers bureau for Orion. S.S. has disclosed that she is a part time employee of deCODE Genetics (unrelated to this work). X.W. has disclosed that he is a shareholder of Myriad Genetics Inc. and was an employee of Crescendo Bioscience Inc. D.D.F. has disclosed that he is a shareholder and employee of Myriad Genetics Inc. E.H.S. has disclosed that he is a shareholder of Myriad Genetics Inc. and an employee of Crescendo Bioscience Inc. T.W.H. has disclosed that she/he is a consultant for Merck, UCB, Bristol Myers Squibb, Biotest AG, Pfizer, GSK, Novartis, Roche, Sanofi-Aventis, Abbott, Crescendo Bioscience Inc., Nycomed, Boeringher, Takeda, Zydus, Epirus and Eli Lilly. No potential conflict of interest was reported by the other author (K.H.).
CMRO peer reviewers on this manuscript have received an honorarium from CMRO for their review work but have no relevant financial or other relationships to disclose.
Supplemental Material
Download MS Word (200.2 KB)Acknowledgements
The authors thank Krystal Brown PhD, Brooke Hullinger JD and Stephanie Meek PhD for their assistance editing the manuscript and preparing the tables and graphs.
Related Research Data
References
- Singh JA, Furst DE, Bharat A, et al. 2012 update of the 2008 American College of Rheumatology recommendations for the use of disease-modifying antirheumatic drugs and biologic agents in the treatment of rheumatoid arthritis. Arthritis Care Res. 2012;64:625–639.
- Smolen JS, Landewe R, Breedveld FC, et al. EULAR recommendations for the management of rheumatoid arthritis with synthetic and biological disease-modifying antirheumatic drugs: 2013 update. Ann Rheum Dis. 2014;73:492–509.
- Kay J, Morgacheva O, Messing SP, et al. Clinical disease activity and acute phase reactant levels are discordant among patients with active rheumatoid arthritis: acute phase reactant levels contribute separately to predicting outcome at one year. Arthritis Res Ther. 2014;16:R40.
- Curtis JR, van der Helm-van Mil AH, Knevel R, et al. Validation of a novel multibiomarker test to assess rheumatoid arthritis disease activity. Arthritis Care Res. 2012;64:1794–1803.
- Centola M, Cavet G, Shen Y, et al. Development of a multi-biomarker disease activity test for rheumatoid arthritis. PloS One. 2013;8:e60635.
- Bakker MF, Cavet G, Jacobs JW, et al. Performance of a multi-biomarker score measuring rheumatoid arthritis disease activity in the CAMERA tight control study. Ann Rheum Dis. 2012;71:1692–1697.
- Hirata S, Dirven L, Shen Y, et al. A multi-biomarker score measures rheumatoid arthritis disease activity in the BeSt study. Rheumatology (Oxford, England). 2013;52:1202–1207.
- van der Heijde D. How to read radiographs according to the Sharp/van der Heijde method. J Rheumatol. 2000;27:261–263.
- Brahe CH, Østergaard M, Johansen J, et al. Predictive value of a multi-biomarker disease activity (MBDA) score for clinical remission and radiographic progression in patients with early rheumatoid arthritis (RA) – a posthoc study of the OPERA trial. Scand J Rheumatol. 2018;46:353–358.
- Hambardzumyan K, Bolce R, Saevarsdottir S, et al. Pretreatment multi-biomarker disease activity score and radiographic progression in early RA: results from the SWEFOT trial. Ann Rheum Dis. 2015;74:1102–1109.
- Hambardzumyan K, Bolce RJ, Saevarsdottir S, et al. Association of a multibiomarker disease activity score at multiple time-points with radiographic progression in rheumatoid arthritis: results from the SWEFOT trial. RMD Open. 2016;2:e000197.
- van der Helm-van Mil AH, Knevel R, Cavet G, et al. An evaluation of molecular and clinical remission in rheumatoid arthritis by assessing radiographic progression. Rheumatology (Oxford, England). 2013;52:839–846.
- Markusse IM, Dirven L, van den Broek M, et al. A multibiomarker disease activity score for rheumatoid arthritis predicts radiographic joint damage in the BeSt study. J Rheumatol. 2014;41:2114–2119.
- Li W, Sasso EH, van der Helm-van Mil AH, et al. Relationship of multi-biomarker disease activity score and other risk factors with radiographic progression in an observational study of patients with rheumatoid arthritis. Rheumatology (Oxford, England). 2016;55:357–366.
- Inoue E, Yamanaka H, Hara M, et al. Comparison of Disease Activity Score (DAS)28–erythrocyte sedimentation rate and DAS28–C-reactive protein threshold values. Ann Rheum Dis. 2007;66:407–409.
- Fleischmann R, Connolly SE, Maldonado MA, et al. Brief report: estimating disease activity using multi-biomarker disease activity scores in rheumatoid arthritis patients treated with abatacept or adalimumab. Arthritis Rheumatol. 2016;68:2083–2089.
- Fleischmann R, Connolly SE, Maldonado MA, et al. Reply. Arthritis Rheum (Hoboken, NJ). 2016;69:867–868.
- Felson DT, Smolen JS, Wells G, et al. American College of Rheumatology/European League Against Rheumatism provisional definition of remission in rheumatoid arthritis for clinical trials. Arthritis Rheum. 2011;63:573–586.
- Weinblatt ME, Schiff M, Valente R, et al. Head-to-head comparison of subcutaneous abatacept versus adalimumab for rheumatoid arthritis: findings of a phase IIIb, multinational, prospective, randomized study. Arthritis Rheum. 2013;65:28–38.
- Landewé R, van der Heijde D, Klareskog L, et al. Disconnect between inflammation and joint destruction after treatment with etanercept plus methotrexate: results from the trial of etanercept and methotrexate with radiographic and patient outcomes. Arthritis Rheum. 2006;54:3119–3125.
- Brown AK, Conaghan PG, Karim Z, et al. An explanation for the apparent dissociation between clinical remission and continued structural deterioration in rheumatoid arthritis. Arthritis Rheum. 2008;58:2958–2967.
- Gandjbakhch F, Haavardsholm EA, Conaghan PG, et al. Determining a magnetic resonance imaging inflammatory activity acceptable state without subsequent radiographic progression in rheumatoid arthritis: results from a followup MRI study of 254 patients in clinical remission or low disease activity. J Rheumatol. 2014;41:398–406.
- Vastesaeger N, Xu S, Aletaha D, et al. A pilot risk model for the prediction of rapid radiographic progression in rheumatoid arthritis. Rheumatology. 2009;48:1114–1121.
- Fautrel B, Granger B, Combe B, et al. Matrix to predict rapid radiographic progression of early rheumatoid arthritis patients from the community treated with methotrexate or leflunomide: results from the ESPOIR cohort. Arthritis Res Ther. 2012;14:R249.
- Lillegraven S, Paynter N, Prince FHM, et al. Performance of matrix-based risk models for rapid radiographic progression in a cohort of patients with established rheumatoid arthritis. Arthritis Care Res. 2013;65:526–533.
- Visser K, Goekoop-Ruiterman YPM, de Vries-Bouwstra JK, et al. A matrix risk model for the prediction of rapid radiographic progression in patients with rheumatoid arthritis receiving different dynamic treatment strategies: post hoc analyses from the BeSt study. Ann Rheum Dis. 2010;69:1333–1337.
- Saevarsdottir S, Rezaei H, Geborek P, et al. Current smoking status is a strong predictor of radiographic progression in early rheumatoid arthritis: results from the SWEFOT trial. Ann Rheum Dis. 2015;74:1509–1514.
- Curtis JR, Wright GC, Strand V, et al. Reanalysis of the multi-biomarker disease activity score for assessing disease activity in the abatacept versus adalimumab comparison in biologic-naive rheumatoid arthritis subjects with background methotrexate study: comment on the article by fleischmann et al. Arthritis Rheum (Hoboken, NJ). 2017;69:863–865.
- Emery P, Genovese MC, van Vollenhoven R, et al. Less radiographic progression with adalimumab plus methotrexate versus methotrexate monotherapy across the spectrum of clinical response in early rheumatoid arthritis. J Rheumatol. 2009;36:1429–1441.
- Smolen JS, Han C, Bala M, et al. Evidence of radiographic benefit of treatment with infliximab plus methotrexate in rheumatoid arthritis patients who had no clinical improvement: a detailed subanalysis of data from the anti-tumor necrosis factor trial in rheumatoid arthritis with concomitant therapy study. Arthritis Rheum. 2005;52:1020–1030.
- Hirata S, Li W, Kubo S, et al. Association of the multi-biomarker disease activity score with joint destruction in patients with rheumatoid arthritis receiving tumor necrosis factor-alpha inhibitor treatment in clinical practice. Modern Rheumatol. 2016;26:850–856.
- Krabbe S, Bolce R, Brahe CH, et al. Investigation of a multi-biomarker disease activity score in rheumatoid arthritis by comparison with magnetic resonance imaging, computed tomography, ultrasonography, and radiography parameters of inflammation and damage. Scand J Rheumatol. 2017;46:353–358.