
Abstract
Objective
To characterize burden of migraine in prevention-eligible patients compared with prevention non-eligible patients in the United States (US). Receipt of preventive therapy was also examined among prevention-eligible patients.
Methods
This retrospective study utilized data from the 2017 US National Health and Wellness Survey linked with medical and pharmacy claims. Patients aged ≥18 years who self-reported experiencing migraine and had confirmed evidence of migraine (≥1 medical or pharmacy claim) were included. Prevention eligibility was based on number of headache days in the past 30 days (prevention-eligible: ≥4 and prevention non-eligible: <4). Descriptive statistics summarized study variables; bivariate and multivariable analyses were conducted to examine the association of prevention-eligibility status with outcomes.
Results
Analyses included 450 patients, 291 (65%) prevention-eligible, and of these 56 (19%) received preventive therapy. Overall, patients were 42.98 ± 14.51 years old; 84% were female. Prevention-eligible patients reported significantly more migraine headache days in the past 6 months (29.27 ± 37.96 vs. 8.61 ± 7.88), had lower mental component summary scores (35.80 ± 2.73 vs. 37.90 ± 2.96), and more presenteeism (47.30 ± 2.98% vs. 37.90 ± 2.60%), overall work impairment (46.30 ± 2.87% vs. 37.90 ± 2.55%) and activity days missed due to migraine (8.16 ± 3.05 vs. 3.82 ± 1.58) than prevention non-eligible patients (all p<.001). Prevention-eligible patients receiving preventive therapy reported more migraine headache days during the past month (9.21 ± 7.99 vs. 6.06 ± 7.10; p=.002) and activity days lost due to migraine (18.39 ± 28.08 vs. 10.69 ± 21.43, p=.015) than those not receiving preventive therapy.
Conclusions
Prevention-eligible patients experience greater burden due to migraine, including more headache days, worse health-related quality-of-life, and greater work and activity impairment than prevention non-eligible patients.
Introduction
Migraine is a prevalent neurological disorder characterized by pulsating, unilateral headaches that are exacerbated by routine physical activityCitation1. Those afflicted may experience painful and often debilitating headaches, as well as visual disturbances, nausea, dizziness, numbness in facial extremities, and extreme sensitivity to sound, light, touch, or smellCitation2,Citation3.
As per the estimates of the Global Burden of Disease Study 2016, migraine affects approximately 1.04 billion individuals globallyCitation4. In the United States (US), 39 million people including adults and children experience migraine, accounting for around 12% of the populationCitation3. Migraine is approximately three times more prevalent in women than in men, affecting 17.3% of women and 5.7% of men in the USCitation5. Migraine imposes a substantial burden on the affected individual and impacts family lifeCitation6, reduces health-related quality of life (HRQoL)Citation7–9, leads to activity impairment and work productivity loss due to absenteeism and presenteeismCitation9,Citation10, and increases healthcare resource utilization (HRU)Citation7,Citation9,Citation11. The total healthcare expenditure associated with migraine in the US is approximated to be $36 billion annuallyCitation3.
Management of migraine includes the use of acute and preventive treatmentsCitation12. Acute treatment is taken as-needed to provide immediate (within 2 h) and sustained pain freedom with the absence of other migraine symptoms (over 48 h)Citation13,Citation14, restore the ability to functionCitation15, and abort migraine attacksCitation14. Preventive treatments are taken regularly to reduce the frequency, severity, and duration of future migraine attacksCitation12,Citation16. Preventive treatments are also used to improve response to acute treatments during a migraine attack, improve overall functioning, and reduce disability and the development of chronic daily headachesCitation12,Citation16. Further, they also reduce overall HRU and associated costsCitation17.
Initiating preventive migraine therapy is recommended in patients with: recurring migraine attacks that significantly interfere with patients’ daily life despite acute treatment, frequent attacks (≥6 monthly headache days regardless of impairment, ≥4 monthly headache days with some impairment, or ≥3 monthly headache days with severe impairment where impairment is measured on the migraine disability assessment score [MIDAS])Citation12,Citation18,Citation19, contraindication to or overuse of acute treatments, adverse events with acute treatments, or patient preferenceCitation12,Citation19–21. A real-world study in the US reported that although approximately 39% of patients with migraine may benefit from preventive treatment, only 13% of patients use preventive medicationsCitation19. A recent US population-based survey (ObserVational survey of the Epidemiology, tReatment and Care Of MigrainE [OVERCOME]) found that only 24.6 and 22.8% of prevention-eligible patients reported receiving a preventive medication prescription ever and currently, respectivelyCitation22. Further, the Second International Burden of Migraine Study reported that the discontinuation of preventive medications is attributable to the lack of efficacy and side effects of therapiesCitation23, including weight gain, fatigue, depression, and gastrointestinal symptomsCitation24.
Limited data exist on the characteristics and burden of migraine in patients with <4 monthly headache days compared to those with ≥4 monthly headache days, who would be considered eligible for preventionCitation25–27, but some research has shown that 24.9% of patients with <4 monthly headache days report at least moderate disabilityCitation27. It is essential to understand how these patients differ from each other and the impact of the difference in migraine frequency on health-related and economic outcomes. Further, as the proportion of patients using preventive medications is low in those likely to benefit from preventive therapyCitation19, an accurate characterization of patients who are not using preventive therapy but would benefit from it is needed. Additionally, research establishing the association between use (or lack of use) of preventive migraine medications and health outcomes (e.g. work impairment, HRQoL, and HRU) may serve to further underscore the unmet needs of patients with migraine.
In the few studies that do examine the characteristics and burden of migraine using a cutoff of ≥4 monthly headache days, all outcomes are self-reportedCitation28–30. To our knowledge, no research has combined survey data with closed medical claims and closed pharmacy claims to examine the characteristics and health-related and economic burden of migraine patients. Therefore, this study utilized three data-rich real-world data sources, self-reported patient data, medical claims, and pharmacy claims with the primary objective of characterizing demographics, clinical characteristics, treatment, and patient burden of migraine. This study specifically examined US adults eligible for preventive therapy for migraine (≥4 monthly headache days) compared to patients not eligible for preventive therapy for migraine (<4 monthly headache days). Additionally, receipt of preventive therapy was examined among those eligible for preventive therapy for migraine.
Methods
Study design and data sources
This study was a retrospective cohort study using linked self-reported patient data from the 2017 US National Health and Wellness Survey (NHWS) and health insurance claims, including medical claims (2012–2018) and pharmacy claims (2012–2018). The self-reported data allowed for obtaining monthly headache days, and the linking to claims allowed the use of medical and pharmacy information to confirm patient diagnosis and provided data on HRU and costs. The NHWS is a self-administered, internet-based survey study of adults (aged ≥18 years) in the US (N = 75,004). All panelists complete an in-depth demographic registration profile. The panel recruits its members through opt-in emails, co-registration with panel partners, e-newsletter campaigns, banner placements, and affiliate networks. A stratified random sampling with strata by sex, age, and ethnicity ensures that the demographic composition of the NHWS is representative of the US adult population. This study was reviewed by Pearl Institutional Review Board (Indianapolis, IN) and was granted exemption status (2017 NHWS: study number 17-KANT-146; survey linked to medical and pharmacy claims: study number 19-KANT-198). Participants completing the NHWS provide informed consent electronically. NHWS provided information on sociodemographic, health and disease characteristics, and outcomes (HRQoL, HRU, and productivity loss).
The patient-reported data from the NHWS were linked to medical and pharmacy insurance claims from Komodo Health. Komodo Health data includes de-identified claims (>65 billion clinical, pharmacy and lab encounters) for more than 320 million patients in the United States (US between 2012–2020). Medical claims data and pharmacy claims data were identified through “payor-complete” datasets, which come directly from the payor and provide the complete patient journey, such as full medical and/or prescription benefit information including insurance eligibility and insurer-reported costs. Kantar worked in partnership with a third-party vendor to link patient-reported data from the NHWS with medical and pharmacy claims data using a HIPAA-certified de-identified linking software. The software used a proprietary probabilistic matching algorithm on Protected Health Information (PHI) from the claims databases and Personally Identifiable Information (PII) from the NHWS to find the matches and a bloom filter hash on each variable. Data are linked on first name, initial of first name, last name, date of birth, and sex. The third party has validated their linking engine and found a 1–2% false positive rate and a 3–5% false negative rate. The medical claims data utilized health plan payor data (i.e. closed claims) collected directly from payors, and provided information on diagnoses, while pharmacy claims data utilized “closed pharmacy claims” from Pharmacy Benefits Managers and provided information on migraine treatment and direct costs.
Study population
Patients aged ≥18 years who responded to the 2017 US NHWS, self-reported experiencing migraine in the past 12 months (in 2017 US NHWS) and had a confirmed evidence of migraine (≥1 medical claim with a migraine diagnosis or ≥1 pharmacy claim for a triptan or ergot within a one-year window around the survey date) were included. Patients groups were categorized based on responses in the 2017 US NHWS: (1) Prevention eligibility as prevention-eligible (≥4 self-reported headache days in past 30 days) and prevention non-eligible (<4 self-reported headache days in past 30 days) and, (2) Preventive therapy use (among the prevention-eligible group) as those self-reporting receiving preventive therapy (e.g. amitriptyline, botulinum toxin type A, valproic acid and its derivatives, propranolol hydrochloride, and topiramate) and those not receiving preventive therapy. The cutoff of 4 headache days to define prevention-eligibility was selected based on the recommendation that all patients with 4 or more monthly migraine headache days should be “considered” or “offered” preventive migraine therapy regardless of impairmentCitation12,Citation19.
Measures
Sociodemographic characteristics were identified using the NHWS data. Measures included age (years), gender (male/female), race/ethnicity (non-Hispanic Black/Hispanic White/non-Hispanic White/other/decline to answer), marital status (married or living with partner/divorced or separated or widowed/single or never married), education (<4-year college degree/4-year college degree or higher/decline to answer), employment status (currently employed full-time/currently employed part-time/currently self-employed/currently not employed/retired), household income (less than $25 K/$25K to <$50 K/$50K to <$75 K/$75K to <$100 K/$100K or more/decline to answer), and insurance status (commercial/Medicare/Medicaid/other/not insured).
Health characteristics were identified using the NHWS data. Measures included Charlson Comorbidity Index (CCI) scoreCitation31, comorbidities (self-reported physician’s diagnosis; e.g. allergies, anxiety, chronic pain, cluster headache, epilepsy, headaches of any type), smoking status (current/former/never smoker), alcohol use (consume/abstain), exercise in the past month (yes/no), and body mass index (BMI; underweight/normal/overweight/obese/decline to answer).
Disease characteristics were identified using the NHWS data. Measures included diagnosis (length of migraine diagnosis and healthcare provider [HCP] that diagnosed migraine [e.g. primary care physician/nurse practitioner/neurologist]), migraine attacks and headaches (migraine headache days [in the past 30 days/6 months]/severity when using and not using medication/related to menstrual cycle [yes/no/not applicable], headache days in the past 30 days), impact of headache on functional health and well-being (as measured by the Headache Impact Test-6 [HIT-6]; range 36–78; higher scores reflect greater impactCitation32), symptoms (e.g. aura; moderate-to-severe pain; nausea and/or vomiting; pulsating, throbbing, or pounding pain; lasts for 4–72 h) and treatments (current prescription medications only; over-the-counter medications were not captured).
HRQoL and health status were identified using NHWS data. HRQoL was measured by the Medical Outcomes Study 36-item Short-Form Health Survey version 2 (SF-36v2), the six-dimension health state Short-Form (SF-6D), and the EuroQol 5-Dimensions 5-level version (EQ-5D-5L). SF-36v2 is a multipurpose, generic health status instrument comprising 36 questionsCitation33. Two summary scores were calculated: physical component summary (PCS) and mental component summary (MCS), using a norm-based scoring to a mean score of 50 and a standard deviation (SD) of 10Citation34, with higher scores indicating better HRQoL. The SF-6D health state utilities score was generated from SF-36Citation35. The SF-6D yields scores ranging from 0–1 (0 being equal, in terms of preference, to death and 1 being equal to full health), with higher scores indicating better HRQoL. The EQ-5D-5L index score is a preference-based measure of health on a continuum scale of 0–1 (0 being equal, in terms of preference, to death and 1 being equal to full health)Citation36.
HRU from medical claims was defined by visits to various HCPs within 1-year of the survey date. Measures included all-cause HCP visits, all-cause emergency room (ER) visits, migraine-related ER visits, all-cause hospitalizations, and migraine-related hospitalizations. HRU from NHWS was defined by visits to various HCPs in the past 6 months; measures included all cause-HCP visits, all-cause specialist visits, all-cause ER visits, and all-cause hospitalizations.
General productivity loss was assessed using the Work Productivity and Activity Impairment (WPAI) – General Health Questionnaire Version 2.0Citation37,Citation38 collected in the NHWS, a 6-item validated instrument. The outcomes are expressed as impairment percentages, with higher numbers indicating greater impairment and less productivity. The measures included absenteeism (percent of work time missed due to one's health in the past 7 days), presenteeism (percent impairment at work due to one's health in the past 7 days), overall work impairment (overall percent estimate combining absenteeism and presenteeism in the past 7 days), and activity impairment (percent impairment in non-work activities due to one’s health in the past 7 days). Migraine-related productivity loss, including the number of work days missed due to migraine in the past 6 months and the number of activity days missed due to migraine in the past 6 months, was also assessed. Only respondents who reported being full-time or part-time employed provided data for measures of absenteeism, presenteeism, overall work impairment, and the number of work days missed due to migraine. All respondents provided data for activity impairment and the number of activity days missed due to migraine.
Migraine-related direct costs (annual cost of migraine-related ER visits and hospitalizations) and all-cause direct costs were identified using medical claims, and cost of migraine-related prescription treatments were identified using pharmacy claims. Migraine-related direct costs were derived from claims visits identified as potential migraine complications. All-cause direct costs were derived from claims visits for any diagnosis and which could be identified by CMS place of service including physician visits, outpatient visits, ER visits, home health events, and hospitalizations. While the closed claims for this study provided context of the full patient journey, a significant percentage of cost from these claims were not fully adjudicated when obtained from the claims database. As such, costs were derived by using unit costs from The Medical Expenditure Panel Survey (MEPS) by type of visit and multiplying by the number of visits from claims to estimate the total migraine-related direct cost and the total all-cause direct cost. Cost of migraine related prescription treatments was calculated using a preidentified list of medications used to treat migraine and their use during the study year. The unit price per drug from the National Average Drug Acquisition Cost (NADAC) database from Centers for Medicare & Medicaid Services (CMS) was used in conjunction with quantity dispensed to estimate the prescription costs.
Total indirect costs were calculated for each respondent using the human capital method based on hourly wages from the Bureau of Labor Statistics. For each patient, an hourly rate was estimated by dividing the median weekly income by the average hours worked per week. This hourly rate was multiplied by the number of hours impaired due to absenteeism and presenteeism to estimate total lost wages; total lost wages were then multiplied by the average number of work weeks in a year to obtain annual estimates of indirect cost.
Statistical methods
Descriptive statistics were used for all study variables including means and standard deviations (SDs) for continuous variables and frequencies and percentages for binary or categorical variables. Bivariate analyses were used to examine statistical differences between the groups (prevention-eligible versus prevention non-eligible, receiving versus not receiving preventive therapy). Fisher’s exact or Chi-square tests were used for categorical variables, and Wilcoxon rank-sum tests were used for continuous variables as normality assumptions evaluated with QQplots and Kolmogorov-Smirnov tests were violated. Test statistics, standard deviations, and two-tailed p-values were reported for bivariate analyses.
Multivariable analyses were conducted with prevention-eligibility status as the main effect for each outcome (HRQoL, productivity loss, and HRU), adjusted for covariates. Covariates included all variables significantly different between groups as identified in the bivariate analyses or those identified a priori: age, gender, race/ethnicity, CCI score, allergies, anxiety, chronic pain, cluster headaches, constipation, depression, fibromyalgia, use of anticonvulsants, use of antidepressants, use of fixed-dose combination drugs, use of NSAIDs, and consumption of alcohol. HRQoL was regressed using generalized linear models (GLMs) specifying a normal distribution and identity link function, and productivity loss and HRU were regressed using GLMs with a negative binomial distribution and log link function. Results are not reported for the absenteeism measure, as the model did not converge (with either a negative binomial or Poisson distribution). The sample from patients with HRU obtained from claims data was limited, resulting in insufficient power for multivariable analyses, and thus, the models failed to convert. Thus, all-cause HRU from NHWS was used in the multivariable analyses. Adjusted (marginal) means, 95% confidence intervals, and p-values for all outcomes have also been reported by cohort. Two-tailed p-values <.05 were considered statistically significant, unless otherwise noted. There was no adjustment for multiplicity.
Agreement between self-reported migraine diagnoses in NHWS and clinical migraine information (i.e. presence of a migraine diagnosis or treatment pattern) was evaluated to assess the potential for bias due to misreporting a diagnosis (or lack of diagnosis) of migraine in the NHWS. The agreement between the self-reported NHWS data and the claims data were examined descriptively using frequencies and percentages.
Missing data were reported and with no attempt to impute values. Missing data were not included in statistical tests. All statistical analyses were performed using R version 3.6.1.
Results
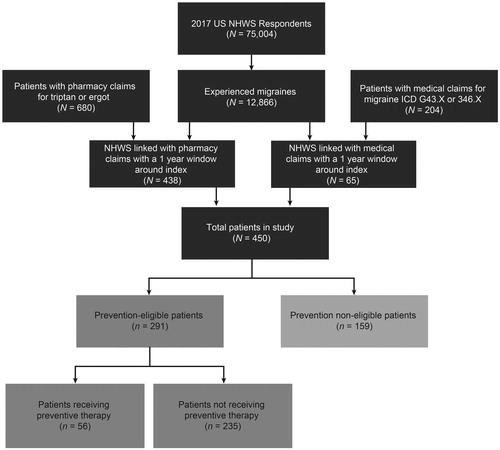
Evaluation of agreement between self-reported migraine and clinical migraine information showed that among the cohort patients who self-reported migraine diagnosis in NHWS and were linked to claims (n = 193), self-reported diagnosis was confirmed with claims data (i.e. had evidence of medical diagnosis and/or migraine treatment patterns in claims), supporting the validity of self-reported diagnosis of migraine in NHWS data. Overall, 450 patients were included in the study, of which 291 (65%) were considered prevention-eligible and 159 (35%) were prevention non-eligible patients. Of the prevention-eligible patients, only 56 (19%) were receiving preventive therapy ().
Figure 1. Patient disposition flow chart. Abbreviation. ICD, International Classification of Diseases; NHWS, National Health and Wellness Survey. NHWS linked with pharmacy and NHWS linked with medical are not mutually exclusive groups. Linked patients may have had both medical and pharmacy claims resulting in a lower number of total patients in the study than the sum of NHWS linked pharmacy and NHWS linked medical patients.
On average, patients were 42.98 years old (SD = 14.51). The majority of patients were female (84%), non-Hispanic white (75%), and married/living with partner (59%). Employment status and annual income varied among patients, with 37% working a full-time job and 30% having an annual household income between USD $25,000 and $50,000. The majority of patients had commercial health insurance (58%), had exercised for at least 20 min one or more times in the past month (62%), and reported that they consume alcohol (63%). Approximately half had never smoked (52%) and the average patient was overweight (mean BMI = 29.35, SD = 8.14). With regard to comorbidities, 52% of the total sample reported having allergies, 51% reported anxiety, and 51% reported depression ().
Table 1. Demographic, health characteristics, and comorbidities of prevention-eligible and prevention non-eligible patients with migraine.
Prevention-eligible versus prevention non-eligible patients
Bivariate analysis
Demographic and health characteristics
Prevention-eligible patients and prevention non-eligible patients had similar sociodemographic characteristics except for marital status and alcohol consumption (). Prevention-eligible patients were less likely to be married or living with a partner ([54 vs. 68%; p = .003Footnotei]; overall distributional differences at p=.012) and more likely to abstain from alcohol (41 vs. 30%; p=.023) compared to non-prevention eligible patients, respectively. Prevention-eligible patients reported higher rates of several comorbidities including allergies (56 vs. 44%; p=.016), anxiety (55 vs. 45%; p=.046), chronic pain (52 vs. 36%; p=.002), cluster headache (29 vs. 13%, p<.001), constipation (13 vs. 4%, p=.008), depression (57 vs. 38%, p<.001), fibromyalgia (14 vs. 6%; p=.025), and headaches of any type (57 vs. 35%, p<.001) compared with prevention non-eligible patients, respectively. The average comorbidity scores did not differ significantly between the patients (CCI: 0.48 ± 1.12 vs. 0.38 ± 0.85; p=.173).
Migraine characteristics and medication class
Prevention-eligible patients reported significantly more migraine headache days across past 30 days (6.67 ± 7.37 vs. 2.10 ± 1.41; p<.001) and 6 months (29.27 ± 37.96 vs. 8.61 ± 7.88; p<.001) as well as significantly more headache days in the past 30 days (12.56 ± 8.28 vs. 1.98 ± 0.92; p<.001) than prevention non-eligible patients (). No differences were reported between groups for diagnosing HCP. Differences in migraine severity were indicated between prevention-eligible and prevention non-eligible patients when using medication among those with non-severe migraine (mild: 52 vs. 67%; p=.034Footnoteii and moderate: 38 vs. 23%; p=.023Footnoteiii), however no differences were observed for those with severe migraine: 10 vs. 10% migraine (p=.935Footnoteiv); overall distributional differences at p=.067. No distributional difference in migraine severity was reported when not using medication (mild: 9 vs. 11%, moderate: 20 vs. 19%, severe: 69 vs. 70%, respectively; p=.649).
Table 2. Migraine and treatment characteristics of prevention-eligible and prevention non-eligible patients with migraine.
The impact of headaches on functional health and well-being was significantly different between the two groups, for example, a higher proportion of prevention-eligible patients reported very severe impact (HIT-6 score of 60+) than prevention non-eligible patients (83 vs. 67%; p<.001Footnotev); overall distributional differences at p<.001. Migraine symptoms differed between prevention-eligible compared to non-prevention eligible patients for those experiencing moderate to severe pain (88 vs. 75%; p=.001), nausea and/or vomiting (66 vs. 55%; p=.034) and sensitivity to sound (74 vs 56%; p<.001).
A significantly higher proportion of prevention-eligible patients reported using anticonvulsants (15 vs. 8%; p=.030), fixed-dose combination (FDCs)Footnotevi (16 vs. 8%; p=.003), and nonsteroidal anti-inflammatory drugs (NSAIDs) (17 vs 6%, p=.015) than prevention non-eligible patients.
Cost analysis (unadjusted)
Migraine-related healthcare direct costs did not statistically differ between prevention-eligible and prevention non-eligible cohorts ($20,656.41 ± $40,880.61 vs. $25,004.59 ± $58,627.85; p=.705) (Supplemental Table 1). Migraine prescription treatment direct costs ($543.47 ± $4,416.85 vs. $178.77 ± $505.83; p=.926), and total direct costs ($42,507.64 ± $80,640.77 vs. $40,493.73 ± $101,149.20; p=.158) were higher in prevention-eligible patients than prevention non-eligible patients, although neither reached statistical significance. Indirect costs were significantly higher in prevention eligible patients than prevention non-eligible patients ($15,019.01 ± $15,645.29 vs. $10,513.07 ± $15,638.82; p=.003).
Multivariable analysis
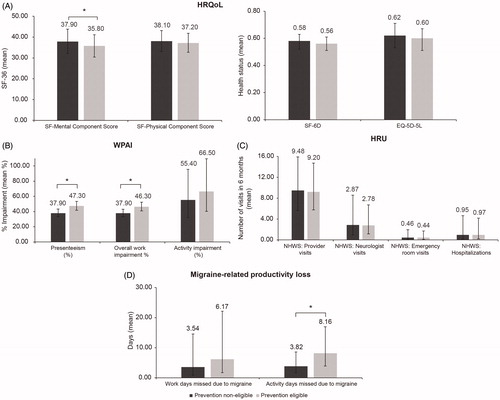
After adjusting for covariates, prevention-eligible patients had significantly poorer MCS scores (35.80 ± 2.73 vs. 37.90 ± 2.96; p<.001) compared to prevention non-eligible patients (). Significant differences in WPAI measures were observed between the two groups, with prevention-eligible patients reporting higher proportions of presenteeism (47.30% ± 2.98 vs. 37.90% ± 2.60; p<.001) and overall work impairment (46.30% ± 2.87 vs. 37.90% ± 2.55; p<.001). Prevention-eligible patients had worse migraine-related productivity loss outcomes compared to prevention non-eligible patients, with more activity days (8.16 ± 3.05 vs. 3.82 ± 1.58; p<.001) missed due to migraine. There were no significant differences observed in HRU between the two groups after adjusting for covariates.
Figure 2. Multivariable analysis: Adjusted estimates of HRQoL, WPAI, HRU, and migraine-related productivity loss outcomes in prevention-eligible and prevention non-eligible patients with migraine. Error bars represent the 95% confidence interval. HRQoL was regressed using linear models, and WPAI, HRU, and migraine impairment were regressed using GLMs with a negative binomial distribution. Covariates included all variables significantly different between groups as identified in the bivariate analyses or those identified a priori: age, gender, race/ethnicity, CCI score, allergies, anxiety, chronic pain, cluster headaches, constipation, depression, fibromyalgia, use of anticonvulsants, use of antidepressants, use of fixed-dose combination drugs, use of NSAIDs, and consumption of alcohol. Abbreviations. HRQoL, health-related quality of life; HRU, healthcare resource utilization; NHWS, National Health and Wellness Survey; WPAI, work productivity and activity impairment. *p<.001.
Prevention-eligible patients receiving preventive therapy versus prevention-eligible patients not receiving preventive therapy
Bivariate analyses
Demographic and health characteristics
A significantly lower proportion of patients receiving preventive therapy reported alcohol consumption than those not receiving preventive therapy (45 vs. 63%; p=.022) (). Annual income significantly differed between the groups (p=.016). There were no other significant differences identified in sociodemographic characteristics between the two groups.
Table 3. Demographic, health characteristics, and comorbidities of prevention-eligible patients receiving preventive therapy and prevention-eligible patients not receiving preventive therapy.
Migraine characteristics and medication class
Patients receiving preventive therapy had more migraine headache days during the past 30 days (9.21 ± 7.99 vs. 6.06 ± 7.10) and 6 months (46.32 ± 44.39 vs. 25.21 ± 35.17), as well as more headache days in the past 30 days (15.54 ± 8.59 vs. 11.84 ± 8.07) (all p-values <.005) (). Migraine was diagnosed less by primary care physician (PCP)/general practitioner (GP)/internist/general internist for patients receiving preventive therapy than patients not receiving preventive therapy (56 vs. 71%, respectively; p=.041Footnotevii); overall distributional differences at p=.012. Migraine severity, when using a medication and when not using a medication, did not differ between groups.
Table 4. Migraine and treatment characteristics of prevention-eligible patients receiving preventive therapy and prevention-eligible patients not receiving preventive therapy.
Patients eligible for and who received preventive therapy also reported a significantly higher proportion of triptan use (46 vs. 23%; p<.001) compared to prevention eligible patients not receiving preventive therapy.
Outcomes
Patients receiving preventive therapy reported a higher number of activity days lost due to migraine (18.39 ± 28.08 vs. 10.69 ± 21.43; p=.015) (). There were no other significant differences observed in HRQoL, HRU, annualized costs or productivity loss measures between the two groups.
Table 5. Health outcomes of prevention-eligible patients receiving preventive therapy and prevention-eligible patients not receiving preventive therapy: unadjusted analysis.
Discussion
Preventive treatments improve HRQoL by reducing the frequency, severity, and duration of future migraine attacksCitation16. The American Academy of Neurology and the American Headache Society recommend initiating preventive migraine therapy in all patients with frequent migraine attacks (≥4 monthly headache days with MIDAS score of ≥6)Citation12,Citation16,Citation18–21. Though the prevalence of ≥4 monthly headache days is lower compared to those suffering from <4 monthly headache days, the burden of migraine is higher in these patientsCitation25. Thus, it is of interest to compare the characteristics of these two groups of patients with migraine.
The current study characterized the demographics and clinical characteristics of prevention-eligible and prevention non-eligible patients with migraine and examined their associated health and economic outcomes using 2017 NHWS self-reported patient data linked to 2012–2018 medical and pharmacy claims. Additionally, prevention-eligible patients were further characterized by those receiving versus not receiving preventive therapy.
Prevention-eligible patients were similar to prevention non-eligible patients with regard to a majority of the sociodemographic characteristics. However, prevention-eligible patients had a higher comorbidity burden as indicated by the CCI compared with prevention non-eligible patients, similar to the results of another study that used 2016 US NHWS survey dataCitation25. In the current study, rates of comorbidities such as allergies, anxiety, chronic pain, cluster headache, depression, fibromyalgia, and headaches of any type were significantly higher in prevention-eligible patients. The higher incidence of comorbidities in prevention-eligible patients may compound the burden of migraine; for example, in a recently published study, migraine patients with comorbid depression reported greater productivity loss than migraine patients without comorbid depressionCitation39. Further, the proportion of patients using anticonvulsants and NSAIDs was significantly higher in prevention-eligible patients than prevention non-eligible patients in this study, similar to the findings of the above-mentioned NHWS study that showed increased use of anti-seizure and anti-inflammatory drugsCitation25.
As expected, prevention-eligible patients showed a greater migraine burden than non-prevention eligible patients as indicated by reporting three times more migraine headache days in the past month or in the past 6 months and six times more headache days in the past month compared with prevention non-eligible patients. The proportion of patients with substantial impact (HIT-6 score 56–59) and very severe impact (HIT-6 score ≥60) of headaches on life was higher in the prevention-eligible patients than in prevention non-eligible patients. This trend is similar to data from the Adelphi Migraine United States Disease Specific Programme which reported severe disability (based on Migraine Disability Assessment Scale completed by patients) in a higher proportion of patients with ≥4 monthly headache days (15–61%) compared to patients with ≤3 monthly headache days (4.3%)Citation26. Likewise, the OVERCOME study showed the proportion of people with migraine reporting severe disability increased as the number of monthly headache days increasedCitation27.
Prevention-eligible patients had significantly poorer HRQoL with regard to MCS scores compared with prevention non-eligible patients, likely due to the impact of increased monthly headache days. Previous studies have demonstrated poorer HRQoL in patients with ≥4 monthly headache days compared to patients with <4 monthly headache daysCitation26 or patients without migraineCitation9. Productivity loss was significantly higher in prevention-eligible patients than prevention non-eligible patients in terms of presenteeism, overall work impairment, and activity days missed due to migraine. These results are in line with research by Ford et al. that reported higher presenteeism and overall work impairment in patients with ≥4 monthly headache days versus those with ≤3 monthly headache daysCitation26.
Bivariate analyses demonstrated that HRU (migraine-related ER visits and migraine-related hospitalizations) was similar between prevention-eligible and prevention non-eligible patients in this study. These findings are partly similar to those from the 2016 US NHWS study that reported significantly higher migraine-related ER visits in patients with ≥4 monthly headache days compared to those with <4 monthly headache days, but a similar number of migraine-related hospitalizations between the groupsCitation25. Prevention-eligible patients had similar annual total direct costs but significantly higher annual total indirect costs compared with prevention non-eligible patients in bivariate analyses, in line with the prior study that reported similar annual total direct costs in patients with ≥4 monthly headache days versus those with <4 monthly headache daysCitation25.
Prevention-eligible patients receiving preventive therapy versus those not receiving preventive therapy
A considerable proportion of prevention-eligible patients with migraine rely solely on acute therapies to manage migraine despite current recommendations for use of preventive therapyCitation40. Results from the Second International Burden of Migraine Study demonstrated that less than half of the patients with episodic and chronic migraine use preventive treatments, with discontinuation of preventive therapies attributable to the lack of efficacy and side effectsCitation23. Further, a discrete-choice experiment suggested that patients prefer preventive migraine medications with improved efficacy and side-effect profile, but are willing to trade off efficacy for a better side-effect profileCitation41. It is essential to understand how the characteristics of patients receiving preventive therapies differ from those of patients not receiving preventive therapies.
In this study, sociodemographic characteristics were similar between patients receiving preventive therapy and those not receiving preventive therapy. A lower proportion of patients receiving preventive therapy was diagnosed by PCPs/GP/internists, whereas a higher proportion was diagnosed by neurologists versus those not receiving preventive therapy. It is likely that those diagnosed by the former see patients earlier in the diagnosis and more likely to refer to a specialist for more comprehensive evaluationCitation42. Indeed, in an US based claims database study, visiting a neurologist 1 year-prior was associated with a greater likelihood of starting a preventive therapy; this neurologist visit occurred relatively late in the timeline from migraine diagnosis to initiation of a preventive therapy, with which averaged 113.3 ± 119.8 daysCitation43 Additionally, patients receiving preventive therapy had a significantly higher number of migraine headache days in the past 30 days, which is in line with patient-reported survey data indicating that patients with ≥10 headache days in the past month were more likely to have been on a preventive therapy in the past 12 monthsCitation25.
Although not significant, a higher proportion of prevention-eligible patients receiving preventive therapy versus those not receiving preventive therapy reported severe migraine when not using medication (either acute or preventive, or both, as reported by survey respondents). Prevention eligible patients receiving preventive therapy reported a significantly higher number of migraine headache days during the past month and past 6 months and headache days in the past month compared to those not receiving preventive therapy. These results indicate that patients experiencing frequent and severe migraine attacks are more likely to receive prescriptions for and take preventive medications. This is in line with a US population-based survey study that demonstrated the frequency of monthly headache days and disability significantly predicted ever using a preventive therapyCitation44. Patients receiving preventive therapy reported using anticonvulsants, antidepressants, beta-blockers, botulinum toxin type A, and triptans. These medications have established efficacy based on AAN guidelines for the preventive treatment of episodic migraine classification and level of evidence. Of note, onabotulinumtoxin A is indicated for preventive treatment of chronic migraine and frovatriptan is indicated for preventive treatment of menstrual migraineCitation12,Citation45. The use of triptans suggests that patients receiving preventive therapy were also using acute treatment for migraine. This demonstrates an additional burden of migraine as patients with frequent and/or severe migraine headaches require both types of treatment and a clear understanding of how acute and preventive therapy fit into their migraine treatment planCitation20. Further, eligible patients receiving preventive therapy were more likely to use triptans than those not receiving preventive therapy. Triptan use, in the form of consistent acute medication refills with <90-day gap, has been shown to significantly predict initiation of preventive therapyCitation43. The higher use of triptans and higher quantity of migraine headache days also suggests that the acute treatment plans for patients on preventive therapy may not be fully optimized, which could lead to greater migraine-related disability and HRQoLCitation46,Citation47.
No significant differences in HRQoL and HRU were observed between the groups; however, patients receiving preventive therapy reported almost two-fold higher activity days missed due to migraine compared to those not receiving preventive therapy. This could be likely due to greater burden of migraine in those receiving preventive therapy as these patients experienced higher frequency of migraine headache days with more severity.
This study has several strengths. The study utilized both patient self-reported survey data and medical/pharmacy claims data that complement each other. NHWS provides an opportunity to analyze real-world data outside the highly controlled setting of clinical trials for information on clinical characteristics (including number of headache days), treatment patterns, and patient reported outcomes that might not otherwise be available in administrative data such as insurance claims. The linkage of patient-reported demographics, behaviors, and outcomes in the NHWS to medical and pharmacy claims data provided greater detail on HRU, migraine-related and all-cause direct economic costs, migraine prescription utilization, and allowed for information across patients’ claims history to be utilized.
The limitations of the study need to be acknowledged. While studies relying on patient self-report are cost-effective, they are subject to recall bias and inaccuracy. In contrast, claims-based data are more accurate but are subject to coding errors and do not cover out-of-plan useCitation48. Furthermore, as claims were used to build the migraine cohorts for this study, results are biased towards those with health insurance and thus may not be generalizable to the entire US population. It is also unknown whether the results of this study are generalizable outside of the US due to differences in, for example, healthcare systems and migraine management. However, studies outside the US have shown that burden varies according to various factors including treatment and comorbiditiesCitation47,Citation49,Citation50. NHWS is a cross-sectional study; therefore, although multivariable analyses adjust for confounding factors, causality cannot be determined. Further study of the bidirectional effects would require a longitudinal study. In addition, not all potential confounders were measured in this study. NHWS is broadly representative of the corresponding national adult population; however, similar to other patient-reported surveys, it likely under-represents people without access to or comfort with online administration, as well as less healthy elderly people, institutionalized patients, and those with severe comorbidities and disabilities. The self-reported nature of the NHWS is also associated with potential corresponding biases such as inaccurate recall and false reporting (intentional or unintentional; e.g. diagnoses are not confirmed by a physician). However, the percent agreement between self-reported diagnoses and claims diagnoses and treatment patterns demonstrated that patients self-reporting migraine diagnosis in NHWS were consistent with their medical diagnosis and migraine prescription pattern in claims. This finding is in line with another study that reported moderate-to-substantial concordance between self-reports and claims-based administrative data for various chronic conditionsCitation48. Another limitation is related to the percentage of NHWS respondents with migraine that were linked with claims data; claims data was available for only 10.6% of the prevention-eligible and non-prevention eligible cohorts, which restricted the use of claims data to confirming diagnosis of patients. Furthermore, as some outcomes (HRU, migraine-related productivity loss, and costs) were based on the past 6 months to 1 year, and prevention-eligibility was based on the number of headache days in past 30 days, results may be biased if patient’s eligibility changed over time. Moreover, recommendations for preventive use define eligibility by number of headache days and impairmentCitation12,Citation19, whereas eligibility in this study was based only on number of headache days, using a cutoff of 4 per month. However, the results of this study showed that the prevention-eligible group did, in fact, have greater impairment. Directions for future research could include examining migraine characteristics and health outcomes by number of monthly headache days incrementally to identify the optimum cutoff selection for defining prevention-eligibility, or could use both impairment and frequency of headache days to define prevention-eligibility and examine whether patient and clinical characteristics differ among these groups. Moreover, due to the lack of statistical power, analyses in the prevention-eligible cohort were limited to unadjusted bivariate analyses when comparing those receiving preventive therapy to those not receiving preventive therapy. Finally, this analysis was conducted prior to the introduction of calcitonin gene-related peptide (CGRP) monoclonal antibodies (mAb) antagonists; a class of medications specifically designed to target the pathophysiology of migraine and prevent migraine attacksCitation51,Citation52. Future research including this novel class of drugs’ impact on migraine treatment outcomes and the migraine treatment landscape is warranted.
Conclusions
This study demonstrated that patients with migraine who are eligible for preventive therapy experience greater burden due to migraine, reporting more migraine headache days in the past 6 months, more migraine symptoms, a greater impact of migraine on functional health and well-being, more comorbidities, lowered mental HRQoL, higher rates of presenteeism and overall work impairment, and more work and activity days missed due to migraine than patients with migraine who are not eligible for receiving preventive therapy. Furthermore, prevention-eligible patients receiving preventive therapy reported more headache days and more missed activity days due to migraine and were more likely to use triptans than those who are not on a preventive medication, suggesting that even among those on a preventive therapy, treatment is not optimized. The results offer a characterization of patients with migraine in the US along with migraine-related outcomes. Further research is warranted to determine patient characteristics that are associated with preventive therapy use and subsequent outcomes related to it, particularly with new treatments, as they are incorporated into the migraine treatment landscape. This data also lays the groundwork for examining potential risk factors and points of intervention for further study.
Transparency
Declaration of funding
This study was funded by Eli Lilly and Company. Kantar received funding from Eli Lilly and Company for data linking, analysis, reporting, and medical writing.
Declaration of financial/other relationships
S.A.F., K.S., O.M., and W.Y. are employees and stockholders of Eli Lilly and Company. B.L.B., M.J.C.M., J.C.R., and D.H.J. are employees of Kantar which received funding from Eli Lilly & Company to conduct the analysis.
Author contributions
S.A.F. contributed to the conception of the study. S.A.F., B.L.B., M.J.C.M., K.S., W.Y, O.M. and D.H.J. contributed to the design of the study. B.L.B, J.C.R., and D.H.J. analyzed data. M.J.C.M. drafted the manuscript. All authors contributed to the data interpretation and the critical review of the manuscript. All authors provided the final approval of the manuscript and agreed to be accountable for all aspects of the work.
Supplemental Material
Download MS Word (19.3 KB)Acknowledgements
Medical writing support was provided by Sudha Korwar, PhD, Swati Krishnan, PhD, and Ramu Periyasamy, PhD, of Indegene Pvt. Ltd., India
Notes
i p-value for married/living with partner by prevention-eligibility status not included in .
ii p-value for mild migraine when using medication by prevention-eligibility status not included in .
iii p-value for moderate migraine when using medication by prevention-eligibility status not included in .
iv p-value for severe migraine when using medication by prevention-eligibility status not included in .
v p-value for very severe impact (HIT-6 score ≥60) by prevention-eligibility status not included in .
vi FDCs included: butalbital/acetaminophen/caffeine, aspirin/butalbital/caffeine, isometheptene/acetaminoph/caffeine, acetaminophen/isometheptene/dichloralphenazone, and isometheptene/acetaminoph/caffeine
vii p-value for primary care physician (PCP)/ general practitioner (GP)/internist/general internist by preventive therapy status not included in .
References
- Headache Classification Committee of the International Headache Society (IHS). The international classification of headache disorders. Cephalalgia. 2018;38:1–211.
- American Migraine Foundation. Identifying and treating migraine. Available from: https://americanmigrainefoundation.org/understanding-migraine/identifying-treating-migraine/.
- Migraine Research Foundation. Migraine Facts. Available from: https://migraineresearchfoundation.org/about-migraine/migraine-facts/.
- Stovner LJ, Nichols E, Steiner TJ, et al. Global, regional, and national burden of migraine and tension-type headache, 1990–2016: a systematic analysis for the Global Burden of Disease Study 2016. Lancet Neurol. 2018;17(11):954–976.
- Buse DC, Loder EW, Gorman JA, et al. Sex differences in the prevalence, symptoms, and associated features of migraine, probable migraine and other severe headache: results of the American Migraine Prevalence and Prevention (AMPP) Study. Headache J Head Face Pain. 2013;53(8):1278–1299.
- Buse DC, Scher AI, Dodick DW, et al. Impact of migraine on the family: perspectives of people with migraine and their spouse/domestic partner in the CaMEO Study. Mayo Clin Proc. 2016;91(5):596–611.
- Blumenfeld A, Varon S, Wilcox T, et al. Disability, HRQoL and resource use among chronic and episodic migraineurs: results from the International Burden of Migraine Study (IBMS). Cephalalgia. 2011;31(3):301–315.
- Lipton RB, Liberman JN, Kolodner KB, et al. Migraine headache disability and health-related quality-of-life: a population-based case-control study from England. Cephalalgia. 2003;23(6):441–450.
- Vo P, Fang J, Bilitou A, et al. Patients’ perspective on the burden of migraine in Europe: a cross-sectional analysis of survey data in France, Germany, Italy, Spain, and the United Kingdom. J Headache Pain. 2018;19:82.
- Serrano D, Manack AN, Reed ML, et al. Cost and predictors of lost productive time in chronic migraine and episodic migraine: results from the American Migraine Prevalence and Prevention (AMPP) Study. Value Health. 2013;16(1):31–38.
- Bonafede M, Sapra S, Shah N, et al. Direct and indirect healthcare resource utilization and costs among migraine patients in the United States. Headache. 2018;58(5):700–714.
- American Headache Society. The American Headache Society position statement on integrating new migraine treatments into clinical practice. Headache. 2019;59:1–18.
- Tfelt-Hansen P, Pascual J, Ramadan N, International Headache Society Clinical Trials Subcommittee members, et al. Guidelines for controlled trials of drugs in migraine: third edition. A guide for investigators. Cephalalgia. 2012;32(1):6–38.
- Marmura MJ, Silberstein SD, Schwedt TJ. The acute treatment of migraine in adults: the American headache society evidence assessment of migraine pharmacotherapies. Headache. 2015;55(1):3–20.
- Orr SL, Friedman BW, Christie S, et al. Management of adults with acute migraine in the emergency department: The American Headache Society evidence assessment of parenteral pharmacotherapies. Headache. 2016;56(6):911–940.
- Dodick DW, Silberstein SD. Migraine prevention. Pract Neurol. 2007;7(6):383–393.
- Silberstein SD, Winner PK, Chmiel JJ. Migraine preventive medication reduces resource utilization. Headache. 2003;43(3):171–178.
- Stewart WF, Lipton RB, Dowson AJ, et al. Development and testing of the Migraine Disability Assessment (MIDAS) Questionnaire to assess headache-related disability. Neurology. 2001;56(6 Suppl 1):S20–S8.
- Lipton RB, Bigal ME, Diamond M, AMPP Advisory Group, et al. Migraine prevalence, disease burden, and the need for preventive therapy. Neurology. 2007;68(5):343–349.
- Silberstein SD. Preventive migraine treatment. Continuum. 2015;21(4):973–989.
- Silberstein SD. Practice parameter: evidence-based guidelines for migraine headache (an evidence-based review): report of the Quality Standards Subcommittee of the American Academy of Neurology. Neurology. 2000;55(6):754–762.
- Lipton RB, Araujo AB, Nicholson RA, et al. Patterns of diagnosis, consultation, and treatment of migraine in the US: results of the OVERCOME Study. Abstract FHM1. 61st Annual Scientific Meeting of the American Headache Society (AHS), 2019. Headache. 2019;59:1–208.
- Blumenfeld AM, Bloudek LM, Becker WJ, et al. Patterns of use and reasons for discontinuation of prophylactic medications for episodic migraine and chronic migraine: results from the second international burden of migraine study (IBMS-II). Headache. 2013;53(4):644–655.
- Reuter U. A review of monoclonal antibody therapies and other preventative treatments in migraine. Headache. 2018;58:48–59.
- Silberstein SD, Lee L, Gandhi K, et al. Health care resource utilization and migraine disability along the migraine continuum among patients treated for migraine. Headache. 2018;58(10):1579–1592.
- Ford JH, Jackson J, Milligan G, et al. A real-world analysis of migraine: a cross-sectional study of disease burden and treatment patterns. Headache. 2017;57(10):1532–1544.
- Reed M, Araujo A, Nicholson R, et al. Symptom patterns, disability, and physician visits among a US sample of people with migraine: results of the OVERCOME Study. Abstract P56. 61st Annual Scientific Meeting of the American Headache Society (AHS), 2019. Headache. 2019;59:1–208.
- Buse D, Yugrakh M, Lee L, et al. Burden of illness among people with migraine and ≥4 monthly headache days while using acute and/or preventive prescription medications for migraine. JMCP. 2020;26(10):1334–1310.
- Lipton R, Lee L, Saikali N, et al. Effect of headache-free days on disability, productivity, quality of life, and costs among individuals with migraine. JMCP. 2020;26(10):1344–1310.
- Doane MJ, Gupta S, Vo P, et al. Associations between headache-free days and patient-reported outcomes among migraine patients: a cross-sectional analysis of survey data in Europe. Pain Ther. 2019;8(2):203–216.
- Quan H, Li B, Couris C, et al. Updating and validating the Charlson Comorbidity Index and score for risk adjustment in hospital discharge abstracts using data from 6 countries. Am J Epidemiol. 2011;173(6):676–682.
- Yang M, Rendas-Baum R, Varon SF, et al. Validation of the Headache Impact Test (HIT-6TM) across episodic and chronic migraine. Cephalalgia. 2011;31(3):357–367.
- Maruish ME., editor. User’s manual for the SF-36v2 health survey. 3rd ed. Lincoln, RI: QualityMetric Incorporated; 2011.
- Maglinte GA, Hays RD, Kaplan RM. US general population norms for telephone administration of the SF-36v2. J Clin Epidemiol. 2012;65(5):497–502.
- Brazier J, Roberts J, Deverill M. The estimation of a preference-based measure of health from the SF-36. J Health Econ. 2002;21(2):271–292.
- Herdman M, Gudex C, Lloyd A, et al. Development and preliminary testing of the new five-level version of EQ-5D (EQ-5D-5L). Qual Life Res. 2011;20(10):1727–1736.
- Reilly Associates. WPAI scoring [cited 2020 March 2]. Available from: http://www.reillyassociates.net/WPAI_Scoring.html.
- Reilly MC, Zbrozek AS, Dukes EM. The validity and reproducibility of a work productivity and activity impairment instrument. Pharmacoeconomics. 1993;4:353–365.
- Baker VB, Sowers CB, Hack NK. Lost productivity associated with headache and depression: a quality improvement project identifying a patient population at risk. J Headache Pain. 2020;21(1):50.
- Bonafede M, McMorrow D, Noxon V, et al. Care among migraine patients in a commercially insured population. Neurol Ther. 2020;9:93–103.
- Mansfield C, Gebben DJ, Sutphin J, et al. Patient preferences for preventive migraine treatments: a discrete-choice experiment. Headache. 2019;59(5):715–726.
- Starling AJ, Dodick DW. Best practices for patients with chronic migraine: burden, diagnosis, and management in primary care. Mayo Clin Proc. 2015;90(3):408–414.
- Ford JH, Schroeder K, Buse DC, et al. Predicting initiation of preventive migraine medications: exploratory study in a large U.S. medical claims database. Curr Med Res Opin. 2020;36:51–61.
- Diamond S, Bigal ME, Silberstein S, et al. Patterns of diagnosis and acute and preventive treatment for migraine in the United States: results from the American migraine prevalence and prevention study. Headache. 2006;0(0):061117080657014–061117080657363.
- Silberstein SD, Holland S, Freitag F, et al. Evidence-based guideline update: pharmacologic treatment for episodic migraine prevention in adults report of the quality standards subcommittee of the American Academy of Neurology and the American Headache Society. Neurology. 2012;78(17):1337–1345.
- Buse D, Kovacik AJ, Nicholson RA, et al. Acute treatment optimization influences disability and quality of life in migraine: results of the observational survey of the epidemiology, treatment and care of migraine (OVERCOME) study. Neurology. 2020;94(15 suppl).
- Lombard L, Farrar M, Ye W, et al. A global real-world assessment of the impact on health-related quality of life and work productivity of migraine in patients with insufficient versus good response to triptan medication. J. Headache Pain. 2020;21:41.
- Jiang L, Zhang B, Smith ML, et al. Concordance between self-reports and Medicare claims among participants in a National Study of Chronic Disease Self-Management Program. Front Public Heal. 2015;3:222.
- Roessler T, Zschocke J, Roehrig A, et al. Administrative prevalence and incidence, characteristics and prescription patterns of patients with migraine in Germany: a retrospective claims data analysis. J Headache Pain. 2020;21(1):85.
- Ping Wong L, Alias H, Bhoo-Pathy N, et al. Impact of migraine on workplace productivity and monetary loss: a study of employees in banking sector in Malaysia. J Hea. 2020;21:68.
- Silberstein SD. Emerging target-based paradigms to prevent and treat migraine. Clin Pharmacol Ther. 2013;93(1):78–85.
- Silberstein S, Lenz R, Xu C. Therapeutic monoclonal antibodies: what headache specialists need to know. Headache. 2015;55(8):1171–1182.