
Abstract
Introduction
Those invested in the outcome of specific decisions may seek to inform the decision-maker by generating relevant evidence. With multiple decision-makers, the evidence generator benefits from understanding whether their needs differ. This was explored using relevant stakeholders’ preferences on quality indicators (QIs) of rare disease patient registries (RDRs), a common vehicle for generating evidence, to support the adoption of new medicines.
Methods
The Jandhyala method was used to compare the observed consensus on RDR quality indicators from each stakeholder group (SHG) and between the combined pharmaceutical (pharma) and non-pharmaceutical (non-pharma) SHG population.
Results
All non-pharmaceutical stakeholder groups were equally unique – suggesting QIs peculiar to themselves – Patients (13/102; 12.75%); Payors (5/102; 4.90%); Prescribers (7/102; 6.86%) to the same degree. Non-pharmaceutical stakeholders generated 31/102 (30.39%) unique QIs. Pharma stakeholder generated 25/102 (24.51%). This totals 56/102 (54.90%) QIs without a match. Two QIs were unanimously suggested and agreed upon by all SHGs (7/7; 100%) – “Engages with patients and gains their buy-in” and “Includes a core data set as part of outcomes”. There was homogenous consensus on common QIs between: Commercial – Market Access (13/52; 25%; p = .005) SHGs; Commercial – Medical Affairs (9/47; 19.15%; p = .001) SHGs; Commercial – Payor (11/41; 21.15%; p = .012) SHGs, and Market Access – Regulatory Affairs (10/41; 19.61%; p = .008) SHGs.
Conclusions
A multiple stakeholder approach for generating real-world evidence can be justified. The potential mismatch of 54.9% between pharma and non-pharma stakeholders indicates a critical misalignment between generator and consumer of its RWE. Pharmaceutical SHG’s were highlighted for greater alignment with Patients and Payor (non-pharma) groups.
Introduction
Evidence is the product of research conducted to answer a particular research question. Such evidence is of the greatest value to its “consumers.” These are defined by the relevance of the research question to them. This includes the value that the answers will have in supporting their decision makingCitation1.
Some may assume that evidence-based decision-making is a risk-mitigating approachCitation2. Consumers of evidence may fall into groups based on two factors: (1) Their common unanswered research or policy questions; and (2) The effect that the evidence is expected to have on an environment.
Consumers may generate relevant evidence themselves or have it generated for them by another interested party. This party may be driven by the shared benefits, to themselves and to the consumer, of answering a specific set of consumer-relevant questions.
The pharmaceutical industry is one such interested party. It manufactures medicines for the benefit of patients, in return for revenue generated by its adoptionCitation3. However, before these benefits can be broadly realized, key hurdles of regulatory approval, reimbursement and prescribing practices need to be addressed. This needs to be done with evidence tailored to their gatekeeper consumers’ needs.
Some argue that these gatekeepers, more constructively termed “stakeholders,” require a dedicated strategy to meet their specific evidence needs. Consequently, a multiple stakeholder approach to planning and delivering evidence is required. This needs to maximize the return on investment, in terms of time and resources. The way to do this is by ensuring that as many stakeholders as possible can benefit from the evidence generatedCitation4.
Patient registries, or observational cohort clinical studies of prospective and/or retrospective type, have the potential to generate answers to a large number of research questions in real-world patientsCitation5. This is especially so if these questions are appropriately understood and incorporated in the planning phaseCitation6,Citation7.
Their value can be amplified in rare diseases. This occurs when, in order to increase the quality of the evidence generated, small, discrete patient populations cared for by different centres can be combined and studied as a larger, single population. Orphan medicines are also among the more costly drugs and are consequently under greater scrutinyCitation8.
Therefore, well-targeted evidence which encourages orphan medicine adoption by supporting the approval, reimbursement, and prescribing, can maximize the chances for rare populations to receive this life-changing treatment.
The pharmaceutical industry has evolved by recognizing the need to engage with key non-pharma (PH−) stakeholders, such as the Payor (Payo), Patient (Pati) and Prescriber (Pres). It has achieved this by aligning its internal functions to mirror the needs of these stakeholders. This has ensured that their perspective remains in focus for the companyCitation9,Citation10. This has been attempted by defining functions such as Regulatory Affairs (RAff), Market Access (MAcc), Commercial (Comm) and Medical Affairs (MAff). To engage specifically with patient organizations, several companies have also implemented patient advocacy functions.
Study objectives and research questions
The value and versatility of patient registries in rare diseases for generating real-world evidence (RWE) is clearCitation11. Furthermore, Berger, SoxCitation12 also underscores the importance of the decisions made by stakeholders involved in making new medicines available. Thus, three research questions have been developed as the subject of this work.
Research questions
Research Question 1: by confirming the differences in the stakeholder needs between them, is a multiple stakeholder approach required?
Research Question 2: what is the exact nature of the differences and of the level of agreement on any common items across the groups?
Research Question 3a: is pharma aligned with PH − stakeholders or not?
Research Question 3b: is there an alignment between the individual stakeholder groups (SHGs), especially between those Pharma (PH+) SHGs intended to mirror specific PH − SHGs?
Study aim and objectives
The overarching aim of this project is to answer the research questions above. The alignment of answers to the questions above will be measured by comparing the detailed lists of quality indicators (QIs) of rare disease patient registries (RDRs), generated using the Jandhyala method from each stakeholder group. This will enable consensus to be observed among the stakeholder groups on the quality indicators that should be included. Hence, the study has two main two objectives, to facilitate achieving the study aim.
Objective 1: to identify the quality indicators for a successful RDR from the perspective of multiple relevant stakeholders.
Objective 2: to assess the heterogeneity among stakeholders.
The outputs from this work are expected to both inform the planning of RWE generating strategies, and determine whether a multiple stakeholder approach is justified.
Methods
Jandhyala method
This original research was conducted using the Jandhyala methodCitation13. This is a novel way of observing proportional group awareness and consensus of answers arising from list-generating questioningCitation14. The Jandhyala method uses two anonymized (Awareness and Consensus) rounds of surveys without face-to-face interaction between rounds. It is differentiated from other consensus-generating methodologies due to two key factors. Firstly, in its passive approach in observing and not forcing consensus, through neither providing feedback between rounds nor including the option of adding or dropping items after the initial stage. This enables the original set of answers to be appreciated and not undergo modification through several rounds before a set threshold of agreement is reached. The second factor is calculating the awareness index, enabling each participant’s suggestions to be considered part of the whole list, thereby inferring their proportional awareness of the subject matter. Hence, being limited to only two survey rounds without a face-to-face meeting, the Jandhyala method lends itself to the rapid completion of data collection and the minimization of study participant attrition.
Using the Jandhyala method in this study, the expert consensus was achieved by observing levels of awareness and consensus relating to QIs. These are solicited via two anonymized online surveys and the calculation of an awareness index (AI) and consensus index (CI) for each QI, respectively. During the Awareness Round (1) survey, participants were asked to respond to the list-generating question: “What is important to planning for, or judging the success of, a Rare Disease Registry?” They were asked to provide a minimum of three, and a maximum of ten, free-text answers. The participants’ responses from this Awareness Round (1) were analyzed per group. They were then refined into a mutually exclusive list of quality indicators by three researchers using a process of content analysis and open coding. The codes were then attributed to the relevant participants’ answers by one researcher. They were then confirmed by a second, with disagreements being resolved by the author.
The participants who completed the Awareness Round (1) survey were asked to participate in the Consensus Round (2) survey. They were asked to rate their level of agreement with the inclusion of the quality indicators arising from the Awareness Round (1) survey. They were to use a five-point Likert scale (strongly agree; agree; neither agree nor disagree; disagree; or strongly disagree). Quality indicators reaching a consensus level of >50% (CI > 0.5) were retained in the final list. There were no formal endpoints in this study, as the outcomes were consensus on QIs that indicated successful RDR quality.
Study participants
Study participants were invited from the author’s professional network and via advertisements placed on professional social media networking sites. They were chosen based on experience in RWE in rare diseases from the following industry and non-industry stakeholder groups: Medical Affairs experts, Market Access experts, Commercial experts, Regulatory Affairs experts, Patients, Prescribers and Payors.
Study variables
In line with the published method and its reporting convention, the awareness index, consensus index, and an index score indicating prompting, were calculated for each generated QI within their stakeholder group.
The AI, measured in the Awareness Round (1), was calculated using the frequency of a QI concerning the most frequently occurring QI. The minimal awareness threshold was defined as an AI > 50%. The CI was calculated as the percentage of participants who agreed or strongly agreed with a QI in the Consensus Round (2).
The Index score measured whether prompting occurred during the Consensus Round (2). Prompting occurred if the absolute difference between the AI and the CI was >0.05 (or 5%). Prompting was considered negligible if the absolute difference was <0.05 (or 5%). Unprompted consensus occurred when most participants suggested a QI in the Awareness Round (1), and the majority agreed, or strongly agreed, that the QI was important in the Consensus Round (2). Any QI that was not suggested by the participants during the Awareness Round (1), but which was agreed to be important in the Consensus Round (2), was prompted completely. Quality indicators achieving a CI >0.50 were retained.
The different SHGs were recruited at different time points. To send the Consensus Round (2) survey out in a timely fashion, it was necessary to code the Awareness Round (1) data for each group individually. Consequently, the generated QIs could not be harmonized across all groups until the end of the data collection period, and an additional round of analysis had been carried out to standardize the generated QIs and to avoid repetition.
The list of QIs for a successful registry from the perspective of multiple stakeholders was duly generated. QIs could be considered “unique” in three different respects, each aligned to a comparison outlined in the statistical analysis section below. These were “unique” to a single SHG only, to a pair of SHGs only and to a population, PH + or PH−, of stakeholder groups only.
Statistical analysis
Absolute heterogeneity in stakeholder responses
At least one unique QI observed is a threshold for absolute heterogeneity of a stakeholder group. The number of unique QIs generated by each SHG, the total number of QIs generated by each SHG, and the proportion of unique QIs are presented.
Two proportions tests were performed to see whether the proportion of unique QIs generated by each SHG was significantly different than those of others (combined). A p-value <.05 indicated a significant difference.
Relative heterogeneity
The heterogeneity among stakeholders for each QI was examined using individual- or expert-level consensus rating. For this analysis, the consensus ratings of the individual stakeholders were further classified as “agree” (expert-level consensus ratings of 4 or 5 in the Jandhyala method) and “disagree” (expert-level consensus rating of 1–3 in the Jandhyala method). For each QI, these classified ratings were tabulated among the SHGs that provided consensus for the QI. Chi-square tests were performed on the tabulated data, and a p-value <.05 indicated heterogeneity among stakeholders for consensus rating on the QI.
The SHGs were combined into PH+; Commercial, Market Access, Medical Affairs, and Regulatory Affairs; and PH−; Patients, Prescribers, and Payors. Chi-square testing was also performed on the combined tabulated data. A p-value <.05 indicated heterogeneity in consensus on each QI between the PH + and PH − stakeholders for the QI.
Heterogeneity in common pairwise stakeholder QIs
The heterogeneity between stakeholder pairs for the list of QIs generated and consented upon by each SHG within the pairs were examined. This analysis used QI-level consensus score (CS) from the Jandhyala method, ranging from 1 to 4: Complete consensus (CI = 1.00) – CS 1; Consensus + (0.50 < CI) – CS 2; Consensus – (0 < CI ≤ 0.50) – CS 3; and No consensus (CI = 0) – CS 4. The category numbers for each generated list of QIs were tabulated between each stakeholder pair. Chi-square tests were performed on the tabulated data, and a p-value <.05 indicated homogeneity between the stakeholder pair in their consensus on the QI.
All statistical analyses were performed using R 3.6.2.
Results
Study participants
Recruitment took place in May 2019 and January 2020. A total of 55 participants were recruited. PH − stakeholder participants were made up of 9 Prescribers, 7 Payors and 9 Patients. PH + stakeholder participants comprised 13 Medical Affairs experts, 5 Market Access experts, 7 Commercial experts, and 5 Regulatory Affairs experts. Non-industry regulatory functions were uniformly unable to participate in the study on the grounds of conflict of interest. Due to recruitment difficulties, the Regulatory Affairs experts were not always specialized in rare diseases, and one Payor had to be recruited from outside the European Union (EU).
Jandhyala method
A definitive list of QIs for each stakeholder group examined was achieved through the execution of the Jandhyala method.
Statistical analysis
Heterogeneity in SHG QIs
Absolute heterogeneity
Responses to awareness round (1) survey
From the Awareness Round (1) survey, a total of 102 QIs were generated and received an AI and a CI (Supplements 1 and 2). Of these, the following numbers of QIs were unique to either an SHG or a population of SHGs: PH + stakeholders generated 25/102 (24.51%): Commercial experts (4/102; 3.92%), Market Access experts (6/102; 5.88%), Medical Affairs experts (4/102; 3.92%), and Regulatory Affairs experts (4/102; 3.92%) and 7/102 (6.86%) suggested by >1 PH + SHG; while PH − stakeholders generated 31/102 (30.39%): Patients (13/102; 12.75%), Payors (5/102; 4.90%), and Prescribers (7/102; 6.86%) and 6/102 (5.88%) suggested by >1 PH − SHG (; ). All stakeholder groups met the threshold for absolute heterogeneity within the overall SHG result.
Figure 1. Pairwise degree of consensus and heterogeneity of quality indicators constituting a rare disease patient registry. Abbreviations. Comm, Commercial; MAcc, Market Access; MAff, Medical Affairs; RAff, Regulatory Affairs; Pati, Patients; Payo, Payors; Pres, Prescribers.
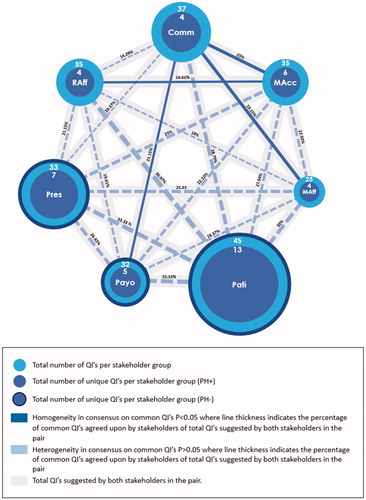
Table 1. The number of unique QIs suggested by SHGs as a proportion of the total number of QIs suggested.
Out of the total number of unique QIs suggested (n = 56), the PH + group generated 25 unique QIs: Commercial experts (4/43; 9.3%), Market Access experts (6/43; 13.95%), Medical Affairs experts (4/43; 9.3%) and RAff (4/43; 9.3%); while the PH − group generated 31 unique QIs: Patients (13/43; 30.23%), Payors (5/43; 11.63%), and Prescribers (7/43; 16.28%) (; ).
On further analysis, the numbers of unique QIs to total QIs within each SHGs were dissimilar. This led to differences in proportions of unique QIs among SHGs. Stakeholders in the PH + group generated the following unique and total QIs: Comm (4/37; 10.81%), Market Access experts (6/35; 17.14%), Medical Affairs experts (4/25; 16.00%), and Regulatory Affairs experts (4/35; 11.43%); while the PH − group generated: Patients (13/45; 28.89%), Payors (5/32; 15.63%), and Prescribers (7/33; 21.21) (; ).
When compared to the total number of QIs, the total number of unique QIs per SHG generated across both PH + and PH − stakeholder groups was 43/102 (42.16%) (; ). The potential mismatch of unique QIs between the stakeholder groups of PH + and PH − was 56/102 (54.9%).
Relative heterogeneity
The overall mean of unique QIs (PH+; PH−) suggested per SHG was 6.14 (4.5; 8.33), whereas the overall mean of non-unique QIs was 28.43. (28.5; 28.33). The mean SHG size was 7.86 participants per SHG (7.50; 8.33). For the PH − stakeholder groups: The Patients SHG suggested both the largest number of unique and total QIs (13/45; 28.89%) followed by Prescribers (7/33; 21.21%) and Payors (5/32; 15.63%), respectively.
For the PH + stakeholder groups: The Medical Affairs SHG had the greatest number of participants (13/55) but suggested the smallest number of unique and total QIs (4/25; 16.00%). The proportion of unique QIs to total QIs for the other PH + stakeholders were: Commercial experts (4/37; 10.81%), Market Access experts (6/35; 17.14%), and Regulatory Affairs experts (4/35; 11.43%) (; ). No statistically significant difference was observed in the proportion of unique QIs across all SHGs, whether PH + or PH−. This means that they were all equally unique.
Heterogeneity in QI consensus
Responses to consensus round (2) survey
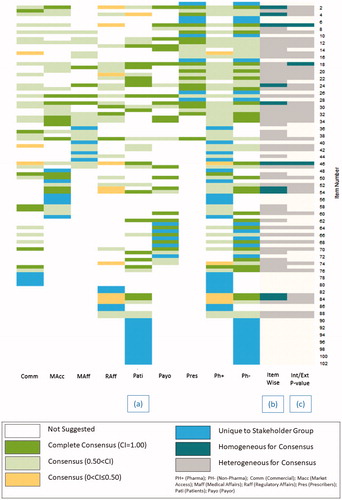
A consensus score of ≤2 was reached in 23 out of 102 QIs in four or more SHGs (). A degree of commonality and heterogeneity exists between the consensus levels of these common QIs.
Table 2. Analysis of QIs above consensus threshold for inclusion (CI > 0.50) in ≥4 SHGs on heterogeneity of consensus scores.
Two QIs reached consensus in all seven SHGs for inclusion in the list QIs of RDRs: “Includes a core dataset as part of the outcomes” and “Engages with patients (organisations) and gains their buy-in” (; ).
Figure 2. Distribution of suggested QIs listed in QI numbering ascending order. (a) Stakeholder: uniqueness, consensus index; (b) heterogeneity of quality indicators by the level of stakeholder consensus; (c) heterogeneity by pharma or non-pharma stakeholder group consensus threshold for inclusion (CI > 0.05) within their discipline listed in quality indicator numbering ascending order. Abbreviations. QI, Quality Indicator; Comm, Commercial; MAcc, Market Access; MAff, Medical Affairs; RAff, Regulatory Affairs; Pati, Patients; Payo, Payors; Pres, Prescribers.
Heterogeneity in pairwise stakeholder consensus
When conducting pairwise analysis, it was found that the Commercial – Regulatory Affairs pair had the lowest number of unique QIs (n = 8), while the Patients – Regulatory Affairs pair had the highest (n = 22). Aligned PH − and PH + pairwise comparisons were: Market Access – Payors (12/54; 22.22%), Commercial – Prescribers (11/54; 20.37%), and Medical Affairs – Patients (18/60; 30%).
All pairs of SHGs were examined for homogeneity in their consensus score for each common QI. The seven SHGs yielded 21 comparisons, with four of these comparisons being statistically significant and therefore, homogeneous: Commercial – Market Access (p = .005); Commercial – Payors (p = .012); Commercial – Medical Affairs (p = .001); and Market Access – Regulatory Affairs (p = .008) ( and ).
Table 3. Pairwise analysis of SHGs on the heterogeneity of consensus scores for QIs that are common.
Discussion
This research sought to confirm the presence of discrete PH − stakeholder groups with equally unique needs, to validate the need for a multiple stakeholder approach in evidence generation. However, this was confirmed in both PH + and PH − stakeholders. Despite the unique QIs mapped out per SHG, several common QIs existed. An understanding of both common and unique QIs enables evidence generation to be planned to satisfy the needs of more than one PH − stakeholder. This improves the evidence generator’s return-on-investment in both time and resource and the availability of medicines from which a group of patients will benefit. Two QIs of rare disease registries met with unanimous agreement across all stakeholder groups and should be considered “core” to the success of this type of research: (1) the need to have a core dataset and (2) the need to both engage with patients and obtain their buy-in.
The core dataset has clear significance in the context of the “Achilles heel” of observational clinical studies – that of missing data from the data requested. The issue here is the central requirement that an observational study must not mandate data collection through unnecessary interventions on patients in the real world. Instead, it must simply observe their standard diagnostic and monitoring practice. There is a common theme running through these stakeholders’ appreciation for a key QI of a potential powerhouse of evidence generation. The theme is the inevitability of missing data and the limitation this places on the quality of the evidence generated. The development of core datasets in rare diseases is currently an area of interest for the author. Work is ongoing regarding how these can be delivered with multiple stakeholders in mind.
Regarding the work presented here, it should be recognized that PH + stakeholders have evolved, in alignment with, and primarily as a result of, the recognition of the various gatekeeper PH − SHGs above.
The results of the dedicated pairwise analysis of common QIs between all possible pairs of stakeholders were surprising. The largest number of common QIs between a PH+/ PH − pair was Patients – Regulatory Affairs (22/61; 36.07%). Expected pairs failed to demonstrate homogeneity in consensus on common QIs. This was despite the low background level of commonality, most notably Payors – Market Access, where other pairs yielded unexpected and, arguably, less useful alignment, such as Market Access – Commercial.
The above findings were in the context of a broader and more worrying lack of alignment in QIs between the PH + and PH − stakeholders; 56/102 (54.90%) QIs were without a corresponding partner on either side of this divide. This suggests a critical incongruence in QIs between evidence generator and consumer. Finally, despite the recognition that patients were unanimously agreed to be an SHG that needed to be engaged with, no PH + stakeholder group pairwise test yielded homogeneity in common QIs with the Patients stakeholder group.
The ultimate beneficiary of optimally generated evidence, in this setting, is the patient, through being treated with medicines from which they would receive a benefit. Failure to provide the necessary evidence to satisfy the gatekeepers, that is, the regulator, the payor and the prescriber, of this benefit may result in the medicine being withheld from these patients. Therefore, the importance of this research highlights not only the critical mismatch between the perceptions of the evidence generator and the external stakeholders they are trying to influence but the exact composition of the mismatch. This detailed knowledge is expected to inform decision-making and reduce or eradicate this mismatch, resulting in more significant patient benefit.
Limitations
The study recruited 55 participants from the EU into seven of the eight intended stakeholder groups. This highlighted the potential limitations of the study regarding the generalisability of the findings. The small size of the examined population must be recognized at both the stakeholder level and the geographical level and should be taken into account when interpreting the results. Furthermore, the inability to recruit regulators to participate in the study has left the pairwise comparisons incomplete. Consequently, a larger number of QIs need to be solicited from the PH + stakeholders.
Conclusion
This original research supports the existence of discrete SHGs involved in the adoption of new medicine. They fall into two clear functional categories, that is, being internal or external to the pharmaceutical company, which depends on whether they generate or consume evidence. Each SHG has unique needs from patient registries, and the RWE generated from them needs to be observed. Though a degree of commonality has been identified, no two SHGs can be considered the same. Therefore, it is recommended that pharmaceutical companies adopt a sensitive multiple stakeholder approach to ensure evidence utility to the intended consumer. In this regard, a critical mismatch has been observed between PH + and PH − stakeholders, which is reflected by the redundancies of the QIs on both sides of this generator/consumer divide. This calls into question the ability of the former to entirely meet the evidence needs of the latter and whether much of their current effort is not, in fact, wasted by not meeting consumer needs.
Further work is encouraged in this area, first to confirm these findings, and then to understand how they can be implemented to bring the generator and the consumer of RWE into closer alignment, to realize the benefits of RWE more efficiently. The unanimous agreement on the need to engage with patients, and their high number of unique QIs, should prioritize this group for specific attention.
Transparency
Declaration of funding
No external funding sources supported this work.
Declaration of financial/other relationships
The author is the Founder and CEO of Medialis Ltd., a medical affairs consultancy and contract research organization involved in the design and delivery of real-world evidence. All members of the Medialis Multidisciplinary RWE Advisory Panel were offered remuneration for their time.
Author contributions
RJ conceived the research, designed the study, and is the sole author of this manuscript.
Ethics approval and consent to participate
All participants provided written informed consent to participate in this research study, and it was determined using the NHS Research Ethics Committee (REC) review tool that the study did not require ethical approval to be conducted (certification available upon request).
Supplementary Table 2
Download MS Word (199.6 KB)Supplementary Table 1
Download MS Word (252.2 KB)Acknowledgements
RJ would like to thank the biostatisticians and medical writers at Medialis Ltd for their statistical and editorial support and the members of the RWE Multidisciplinary Advisory Panel for participating in this research.
Data availability statement
All data generated or analyzed during this study are included in this published article and its supplementary information files.
References
- Rycroft-Malone J, Seers K, Titchen A, et al. What counts as evidence in evidence-based practice? J Adv Nurs. 2004;47(1):81–90.
- Brownson RC, Gurney JG, Land GH. Evidence-based decision making in public health. J Public Health Manag Pract. 1999;5(5):86–97.
- Szmelter A. Global pharmaceutical industry: characteristics and trends. In: Nozari H, Szmelter A, editors. Global supply chains in the pharmaceutical industry. Hershey (PA): IGI Global; 2019. p. 57–85.
- Boaz A, Hanney S, Borst R, et al. How to engage stakeholders in research: design principles to support improvement. Health Res Pol Syst. 2018;16(1):60.
- Jandhyala R. Comment on: “patient registries: an underused resource for medicines evaluation: operational proposals for increasing the use of patient registries in regulatory assessments”. Drug Saf. 2019;42(12):1515–1516.
- Noonan V, Kwon B, Soril L, et al. The Rick Hansen spinal cord injury registry (RHSCIR): a national patient-registry. Spinal Cord. 2012;50(1):22–27.
- Wang SV, Verpillat P, Rassen JA, et al. Transparency and reproducibility of observational cohort studies using large healthcare databases. Clin Pharmacol Ther. 2016;99(3):325–332.
- Melnikova I. Rare diseases and orphan drugs. Nat Rev Drug Discov. 2012;11(4):267–268.
- Hiswåls A-S, Hamrin CW, Vidman Å, et al. Corporate social responsibility and external stakeholders’ health and wellbeing: a viewpoint. J Public Health Res. 2020;9(1):1742–1742.
- Kessel M. The problems with today’s pharmaceutical business–an outsider’s view. Nat Biotechnol. 2011;29(1):27–33.
- Khosla S, White R, Medina J, et al. Real world evidence (RWE)–a disruptive innovation or the quiet evolution of medical evidence generation? F1000Res. 2018;7(111):111–114.
- Berger ML, Sox H, Willke RJ, et al. Good practices for real-world data studies of treatment and/or comparative effectiveness: recommendations from the joint ISPOR-ISPE special task force on real-world evidence in health care decision making. Value Health. 2017;20(8):1003–1008.
- Jandhyala R. A novel method for observing proportional group awareness and consensus of items arising from list-generating questioning. Curr Med Res Opin. 2020;36(5):883–893.
- Jandhyala R. Delphi, non-RAND modified Delphi, RAND/UCLA appropriateness method and a novel group awareness and consensus methodology for consensus measurement: a systematic literature review. Curr Med Res Opin. 2020; 36(11):1873–1887.