
Abstract
Objectives
The objectives of this study were to describe the characteristics and initial treatment patterns, healthcare resource use (HCRU), and costs of patients newly diagnosed with neurofibromatosis type 1 (NF1)-related plexiform neurofibromas (PN).
Methods
This was a retrospective study of individuals enrolled in the IBM MarketScan Multi-State Medicaid database from 1 October 2014 to 31 December 2017. Patients aged ≤18 years at the index date (first diagnosis of NF1 or PN, whichever occurred later) with at least 1 ICD-10-CM diagnosis code for both NF1 and PN were included. All-cause HCRU and the associated direct costs during the follow-up period were calculated per patient per year (PPPY) in 2018 USD.
Results
A total of 383 patients were included with a mean follow-up of 448 days. Most patients were diagnosed by a specialist (63.5%). During the follow-up period, pain medications were used by 58.5% of patients, 25.1% were treated with chemotherapy, 7.1% received surgery for PN, 1.6% received MEK inhibitors, and 0.8% received radiation. Mean PPPY inpatient, outpatient, ER, pharmacy, and other visits were 1.4, 17.3, 1.6, 13.6, and 25.8, respectively. Mean ± SD (median) total PPPY healthcare costs were $17,275 ± $61,903 ($2889), with total medical costs of $14,628 ± $56,203 ($2334) and pharmacy costs of $2646 ± $13,303 ($26).
Conclusions
This study showed that many pediatric patients newly diagnosed with NF1 and PN were initially treated with supportive care only, highlighting a substantial unmet medical need. This study also highlights the considerable economic burden among patients with NF1 and PN.
Introduction
Neurofibromatosis type 1 (NF1) is a rare autosomal dominant genetic disorder caused by mutations in the NF1 tumor suppressor geneCitation1. It is characterized by progressive cutaneous, neurological, skeletal, and neoplastic manifestations ranging from minor freckling of the skin to mobility-limiting disfigurement and serious neurological deficitsCitation1. NF1 significantly decreases lifespanCitation2–4 and has a global prevalence of 1 in 3000 to 1 in 6000 peopleCitation1,Citation5,Citation6.
The major clinical manifestations of NF1 become apparent during childhood and adolescence, and most patients are diagnosed by the age of 8Citation7. The diagnostic criteria are well established and include café au lait macules on the skin, Lisch nodules in the eye, dysplasia in the bones, and externally visible or internal neurofibromasCitation8. Approximately 20–50% of NF1 patients exhibit plexiform neurofibromas (PNs)Citation9–12, which are distinguished from other NF1-related tumors by their growth in the nerve sheaths of multiple large nerve bundles and their anatomical invasivenessCitation10,Citation13. They are typically benign but can grow rapidly during childhood and adolescenceCitation1,Citation8 and give rise to malignant peripheral nerve sheath tumorsCitation14,Citation15.
Clinical management of patients with NF1-related PNs consists of surveillance of disease progression and palliative care for symptoms, including, when possible, surgical excision of tumorsCitation8. However, because of their invasive nature, complete removal of PNs is generally impossibleCitation1,Citation16,Citation17, and tumors tend to regrowCitation18. Ongoing clinical trials are examining the efficacy of targeted therapies, that is, drugs targeted to the specific cellular signaling pathways that are disrupted by the NF1 mutationCitation19,Citation20, with the goal of slowing or stopping the growth of PNs. Only recently has one of these therapies, selumetinib, been approved for use in pediatric patients with symptomatic, inoperable PNsCitation21.
Other than the information gleaned from the National Cancer Institute’s NF1 natural history cohort (NCT00924196)Citation22–24, little is known about the real-world experience of NF1 patients with PN. The most recent study of costs in NF1 was published 20 years agoCitation25, and treatment patterns and healthcare resource utilization (HCRU) of NF1 patients with PN are underreported in the literature. The objective of this study was to describe the demographic characteristics and initial treatment patterns, HCRU, and costs among patients newly diagnosed with NF1 and PN in the United States. This was done in a pediatric population of Medicaid-insured patients.
Methods
Study design
We retrospectively analyzed medical and pharmacy claims data. The study period was from 1 October 2014, to 31 December 2017. The index date was the date of the first diagnosis of NF1 or PN, whichever occurred later, on or after 1 October 2015. The baseline period was defined as the 12-month period before the index date. The follow-up period varied in length, ranging from the index date to the end of the study period or to the end of continuous enrollment in the health plan, whichever occurred first.
Data source
Claims data were from the IBM MarketScanFootnotei Multi-State Medicaid databaseCitation26. This national database, maintained by IBM Watson Health, belongs to a family of administrative claims databases that compile data on approximately 40 million patients per year in the United StatesCitation27. The databases contain patient-level data on healthcare expenditures and outpatient prescription claims from inpatient and outpatient medical claims as well as clinical utilization records. The Multi-State Medicaid database contains the same de-identified, individual-specific details as the other IBM databases, but contains additional details on race and reasons for eligibility (disability, financial need, etc.).
Study population
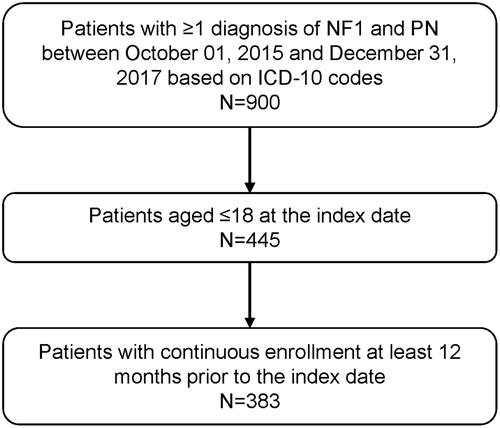
Patients diagnosed with both NF1 and PN, aged ≤18 on the index date, and continuously enrolled for ≥12 months before the index date were included in the study population (). Continuous enrollment was defined as no lapse in insurance coverage longer than 45 days. NF1 and PN were identified using International Classification of Diseases, 10th revision, Clinical Modification (ICD-10-CM) codes of Q85.01 for NF1; and D36.1x, D31.6x, and D33.3 for PN.
Figure 1. Patient selection flow chart. Abbreviations. NF1, neurofibromatosis type 1; PN, plexiform neurofibroma.
Study outcomes
The study outcomes were demographic characteristics in the baseline period (or on the index date); and all-cause HCRU, all-cause costs, imaging services, and treatments in the follow-up period. Patient demographics included age, gender, race, and type of health insurance. Information about the index diagnosis was also collected, including the place of service codes and provider type category on the diagnosis claim. The specialist provider type included provider codes 100–799 (excluding codes 204 and 240), which in practice meant primarily neurologists, ophthalmologists, pediatricians, radiologists, pediatric hematologists/oncologists, and geneticists.
Treatments were broadly classified as surgery for PN, pain medication, chemotherapy, radiotherapy, and targeted therapies. Surgery for PN was identified by Current Procedural Terminology codes 64790 and 64792Citation28. Pain medications were identified by National Drug Codes using previously published methodsCitation22,Citation23,Citation29. Chemotherapy included all medications and procedures coded as “chemotherapy” in the Cancer Research Network’s 2017 chemotherapy look-up tablesCitation30. Radiotherapy was identified by codes listed in the Cancer Research Network’s radiation therapy look-up tablesCitation30. Targeted therapies included MEK inhibitors (binimetinib, cobimetinib, and trametinib dimethyl sulfoxide), tyrosine kinase inhibitors (bosutinib, dasatinib, imatinib, nilotinib, ponatinib, and sunitinib), and pegylated interferon alpha-2b.
All-cause HCRU included inpatient, outpatient, emergency room (ER), pharmacy, and other encounters. “Other” encounters encompassed home visits, ambulance rides, and visits to independent laboratories, federally qualified health centers, rural health clinics, and community mental health centers. Claims for imaging services (CT, MRI, and PET) were identified by the Healthcare Common Procedure Coding System (HCPCS) and ICD PROC codes (list available upon request). Costs associated with inpatient, outpatient, ER, and other encounters were classified as medical costs, separate from the costs associated with pharmacy claims.
Statistical methods
All statistical analyses were descriptive and were carried out using SAS version 9.4. Patient characteristics from the baseline period or index date were presented as numbers and percentages for categorical variables and as means and standard deviations (SDs) for continuous variables. Treatments during the follow-up period were presented as the number and proportion of patients with each service or treatment type. Follow-up HCRU was tabulated as the number and percentage of patients with each type of resource use and also as the mean (SD) number of encounters per patient per year (PPPY), which was calculated as the total number of claims for each type of resource use divided by the total length of follow-up in years among patients with each type of resource use. Costs during follow-up were presented as means (SD) or medians (interquartile range [IQR]). Healthcare costs PPPY were calculated as the total cost divided by the total number of days of enrollment in years, where costs were weighted by each patient’s length of follow-up to avoid overestimation and annualized for patients observed for less than 1 year. All costs were adjusted to 2018 US dollars based on the medical care component of the Consumer Price IndexCitation31.
Results
Demographic characteristics
A total of 383 patients were included in the analysis, 199 (52.0%) of whom were male (). The mean (SD, range) age on the index date was 11.4 (4.4, 2.0–18.0) years. The racial composition of the population was 47.3% White, 30.0% Black, and 5.2% Hispanic. Most index diagnoses occurred in a campus-based outpatient hospital (68.4%) or doctor’s office (25.3%) and were provided by a specialist (63.5%). The mean (SD) and median (range) duration of follow-up were 448 (239) and 473 (5–823) days, respectively, for a total of 171,444 follow-up days (data not shown).
Table 1. Baseline demographic characteristics among pediatric patients diagnosed with NF1 and PNA.
Treatment patterns
In analyses of treatment patterns, 27 patients (7.1%) had surgery for PN (). Over half (58.5%) of the patients had used pain medications, while 25.1% had received chemotherapy, 0.8% had received radiotherapy, and 1.6% had received targeted therapy. Neuropathic pain medications commonly used by NF1/PN patients included gabapentin (11.2%), amitriptyline (3.9%), pregabalin (1.0%), and duloxetine (0.8%; data not shown). The most common chemotherapy was dexamethasone (17.2%). The only targeted therapy used in this population was the MEK (MAPK/ERK) inhibitor trametinib dimethyl sulfoxide.
Table 2. Treatment received during the follow-up period by pediatric patients diagnosed with NF1 and PN.
Healthcare resource utilization and costs
In analyses of HCRU during the follow-up period (), outpatient visits were the most common type of encounter (99.7%), followed by pharmacy visits (85.6%), “other” visits (76.0%), ER visits (45.2%), and inpatient visits (13.6%). Among resource users, “other” visits were the most numerous, with a mean (SD) of 25.8 (55.0) visits PPPY. Outpatient and pharmacy visits occurred slightly more than once per month (mean (SD) 17.3 (19.0) and 13.6 (17.9) PPPY, respectively), whereas ER and inpatient visits occurred about once per year (mean (SD) 1.6 (1.4) and 1.4 (1.4) PPPY, respectively). In results not shown, imaging services were used by 258 patients (67.4%); MRI was the most common imaging service (65.3% of patients), followed by CT scans (11.8%) and PET scans (3.7%).
Table 3. All-cause health care resource use during the follow-up period among pediatric patients diagnosed with NF1 and PN.
Mean (SD) and median (IQR) total costs PPPY during follow-up were $17,275 ($61,903) and $2889 ($207–$9499), respectively (). The cost breakdown showed that medical costs constituted 85% of the total and were driven by inpatient costs (46% of medical costs).
Table 4. All -cause costs during the follow-up period among pediatric patients diagnosed with NF1 and PNA.
Discussion
This study showed that the HCRU and costs of Medicaid-enrolled pediatric patients in the first year after diagnosis with NF1 and PN were substantial. Treatment patterns consisted primarily of supportive care with medications. Our data include many completely novel findings from a real-world population that highlight the burden of disease in pediatric NF1 patients with PN.
The last evaluation of HCRU and cost in NF1 was published in the year 2000; it was a prospective analysis of 201 adult NF1 patients receiving care at a hospital-based referral center in FranceCitation25. The long time interval between this study and ours highlights the scarcity of information on the burden and cost of the disease in NF1 patients and underscores the novelty of our findings.
One additional study published in the intervening time provides some insight into the burden of disease in children with NF1 and PN. Kim et al. assessed the pre-enrollment characteristics of 59 children (median age 8 years) enrolled in NF1/PN trials at the National Institutes of Health in 1996–2007Citation32. Very few of these patients had had prior chemotherapy (5%), while 47% had had debulking surgery for their PN. These numbers vary widely from the proportions observed in the Medicaid population (25% had chemotherapy and 7% had surgery). The differences may be attributed to differences in age and severity between the study populations, with older patients (as in the Medicaid population) more likely to consider using chemotherapy, and patients with surgically intractable PNs (as in the NIH population) more likely to enroll in a trial.
The use of a Medicaid population as a data source offers a unique perspective on the burden of NF1 with PN. First, it includes race data that are not available in other MarketScan databases. In comparison to previously published observational studies in the United States, which drew from sources such as the National NF Registry/Lurie Children’s Hospital in ChicagoCitation33,Citation34, the National Cancer Institute’s natural history cohortCitation23,Citation35, and the Cincinnati Children’s HospitalCitation36, our study population had a lower proportion of White patients and a higher proportion of Black patients. Thus, our results provide insight into a different cross-section of NF1 patients than might be seen with other data sources. Second, in comparison to a similar analysis performed on a commercially insured populationCitation37, several interesting differences were noted. Medicaid patients were most frequently diagnosed at a campus-based hospital (68%), versus a doctor’s office for the commercial population (58%). A higher proportion of Medicaid patients used pain medications (59%), and more of them were observed to use targeted therapies (1.6%), compared to the commercially insured patients (44% and 1.0%, respectively). ER visits were more frequent in the Medicaid population (45%) than the commercial population (25%), as were “other” types of resource use (76% Medicaid, 51% commercial), and medical costs were driven by inpatient rather than outpatient services. These differences, though qualitative, suggest that resource use and costs are different in NF1 patients with different types of health insurance coverage, and this may inform future studies of treatment patterns, disease burden, and health outcomes in different populations.
The rate of use of pain relievers (59%) in the Medicaid population was higher than in some previous studiesCitation23,Citation38. However, in a population drawn from the National Cancer Institute’s natural history cohort (n = 41; median age 8 years), the rate of pain reliever use rose from 43% at baseline to 63% at the time point of maximum PN volume (a median time span of 6.5 years)Citation22. A high rate of pain reliever use may suggest that patients in the Medicaid population have larger tumors and/or experience more pain than some other cohorts.
The substantial resource use and cost burden described here, along with the findings of others regarding the burden of disease, highlight the need for new and more effective pharmacotherapies. Targeted agents like the recently approved selumetinibCitation21 represent the future of treatment for NF1 patients, especially those with inoperable PNs. The use of targeted agents will almost certainly lead to changes in treatment patterns, HCRU, and costs that can be the subject of future studies.
Limitations
Several limitations inherent to the use of administrative claims data apply to our study. First, since the IBM MarketScan Multi-State Medicaid database contains information on individuals enrolled in Medicaid, the results may not be generalizable to other populations, for example, the uninsured or those with employer-sponsored coverage. Second, the use of diagnosis codes and procedure codes to identify NF1 patients and PN-related procedures is imperfect because of variations in coding. Specifically, there is no single ICD code identifying PN; however, the diagnosis codes used in this study were reviewed for accuracy by a clinician specializing in NF1. Also, the specific reasons for certain procedures, such as radiotherapy, are not provided. Third, drugs administered during an inpatient stay do not appear in the database, so we were not able to capture individual drugs administered in the hospital. Fourth, although dexamethasone and tretinoin are included as chemotherapy in the Cancer Research Network’s 2017 chemotherapy look-up tablesCitation30, they may be used as non-chemotherapies in conditions other than cancer. Fifth, claims data lack the granularity that would provide details on the source of pain (PN versus something else), so the specific reason for use of pain medication cannot be inferred. Similarly, details on the site and the size of PNs are lacking. Finally, NF1 is a chronic disease, and compared to a long-term horizon, the follow-up period in our study was relatively short (mean follow-up of 448 days, or 1.2 years). Study timing also affected the list of treatments observed, as many therapies were still undergoing investigation at the study endpoint in 2017.
Conclusions
This study characterized the initial treatment patterns, HCRU, and costs of Medicaid-enrolled pediatric patients with NF1 and PN in the United States. The results show that many patients were treated with supportive care only, highlighting a substantial unmet medical need. This study also highlights the considerable economic burden among patients newly diagnosed with NF1 and PN. Our data alleviate scarcity of information on the burden of NF1 with PN, which is needed to help improve the treatment and health outcomes of these patients.
Transparency
Declaration of funding
Funding was provided by Merck Sharp & Dohme Corp., a subsidiary of Merck & Co., Inc., Kenilworth, NJ, USA.
Declaration of financial/other relationships
XY, KD, ES, and SS are employees of Merck Sharp & Dohme Corp., a subsidiary of Merck & Co., Inc., Kenilworth, NJ, USA, and maybe stockholders of Merck & Co., Inc., Kenilworth, NJ, USA. NA, KM, and SC, are employees of Complete HEOR Solutions, North Wales, PA, USA, and received financial compensation for their participation in the study analysis. A reviewer on this manuscript has disclosed that they have been a medical adviser for Astra Zeneca on plexiform neurofibromas. Peer reviewers on this manuscript have no other relevant financial relationships or otherwise to disclose.
Author contributions
All authors made a significant contribution to the work reported, whether that is in the conception, study design, execution, acquisition of data, analysis, and interpretation, or in all these areas; took part in drafting, revising, or critically reviewing the article; gave final approval of the version to be published; have agreed on the journal to which the article has been submitted; and agree to be accountable for all aspects of the work.
Ethics approval and consent to participate
The Medicaid database contains de-identified information, and, therefore IRB approval and informed consent were not necessary.
Acknowledgements
The authors thank Melissa Stauffer, PhD in association with ScribCo, for medical writing assistance.
Data availability statement
The data that support the findings of this study are available from the Medicaid claims repository, https://www.ibm.com/products/marketscan-research-databases, but restrictions apply to the availability of these data, which were used under license for the current study and so are not publicly available.
Notes
i IBM MarketScan Research Databases is a registered trademark of IBM Watson Health, Ann Arbor, MI, USA.
References
- Gutmann DH, Ferner RE, Listernick RH, et al. Neurofibromatosis type 1. Nat Rev Dis Primers. 2017;3:17004.
- Evans DG, O’Hara C, Wilding A, et al. Mortality in neurofibromatosis 1: in North West England: an assessment of actuarial survival in a region of the UK since 1989. Eur J Hum Genet. 2011;19(11):1187–1191.
- Masocco M, Kodra Y, Vichi M, et al. Mortality associated with neurofibromatosis type 1: a study based on Italian death certificates (1995-2006). Orphanet J Rare Dis. 2011;6:11.
- Rasmussen SA, Yang Q, Friedman JM. Mortality in neurofibromatosis 1: an analysis using U.S. death certificates. American Journal of Human Genetics. 2001;68(5):1110–1118.
- Uusitalo E, Leppavirta J, Koffert A, et al. Incidence and mortality of neurofibromatosis: a total population study in Finland. J Invest Dermatol. 2015;135(3):904–906.
- Orphanet [Internet]. Neurofibromatosis type 1. New York (NY): Orphanet; 2014 [cited 2020 October 8]. Available from: https://www.orpha.net/consor/cgi-bin/Disease_Search.php?lng=EN&data_id=185&Disease_Disease_Search_diseaseGroup=Neurofibromatosis-type-1&Disease_Disease_Search_diseaseType=Pat&Disease(s)/group%20of%20diseases=Neurofibromatosis-type-1&title=Neurofibromatosis%20type%201&search=Disease_Search_Simple
- DeBella K, Szudek J, Friedman JM. Use of the national institutes of health criteria for diagnosis of neurofibromatosis 1 in children. Pediatrics. 2000;105(3):608–614.
- Ferner RE, Huson SM, Thomas N, et al. Guidelines for the diagnosis and management of individuals with neurofibromatosis 1. J Med Genet. 2007;44(2):81–88.
- Mautner VF, Asuagbor FA, Dombi E, et al. Assessment of benign tumor burden by whole-body MRI in patients with neurofibromatosis 1. Neuro-oncology. 2008;10(4):593–598.
- Korf BR. Plexiform neurofibromas. Am J Med Genet. 1999;89(1):31–37.
- Nguyen R, Kluwe L, Fuensterer C, et al. Plexiform neurofibromas in children with neurofibromatosis type 1: frequency and associated clinical deficits. The Journal of Pediatrics. 2011;159(4):652–655.
- Boulanger JM, Larbrisseau A. Neurofibromatosis type 1 in a pediatric population: Ste-Justine’s experience. Can J Neurol Sci. 2005;32(2):225–231.
- Karaconji T, Whist E, Jamieson RV, et al. Neurofibromatosis type 1: review and update on emerging therapies. Asia-Pacific Journal of Ophthalmology. 2019;8(1):62–72.
- Evans DG, Baser ME, McGaughran J, et al. Malignant peripheral nerve sheath tumours in neurofibromatosis 1. J Med Genet. 2002;39(5):311–314.
- Korf BR. Malignancy in neurofibromatosis type 1. Oncologist. 2000;5(6):477–485.
- Ly KI, Blakeley JO. The diagnosis and management of neurofibromatosis type 1. Med Clin North Am. 2019;103(6):1035–1054.
- Canavese F, Krajbich JI. Resection of plexiform neurofibromas in children with neurofibromatosis type 1. J Pediatr Orthop. 2011;31(3):303–311.
- Nguyen R, Ibrahim C, Friedrich RE, et al. Growth behavior of plexiform neurofibromas after surgery. Genet Med. 2013;15(9):691–697.
- Karajannis MA, Ferner RE. Neurofibromatosis-related tumors: emerging biology and therapies. Curr Opin Pediatr. 2015;27(1):26–33.
- Gutmann DH, Blakeley JO, Korf BR, et al. Optimizing biologically targeted clinical trials for neurofibromatosis. Expert Opin Investig Drugs. 2013;22(4):443–462.
- US Food and Drug Administration [Internet]. FDA approves first therapy for children with debilitating and disfiguring rare disease. Silver Spring (MD): FDA; 2020 [cited 2021 June 30]. Available from: https://www.fda.gov/news-events/press-announcements/fda-approves-first-therapy-children-debilitating-and-disfiguring-rare-disease
- Gross AM, Singh G, Akshintala S, et al. Association of plexiform neurofibroma volume changes and development of clinical morbidities in neurofibromatosis 1. Neuro Oncol. 2018;20(12):1643–1651.
- Wolters PL, Burns KM, Martin S, et al. Pain interference in youth with neurofibromatosis type 1 and plexiform neurofibromas and relation to disease severity, social-emotional functioning, and quality of life. Am J Med Genet A. 2015;167A(9):2103–2113.
- Martin S, Wolters P, Baldwin A, et al. Social-emotional functioning of children and adolescents with neurofibromatosis type 1 and plexiform neurofibromas: relationships with cognitive, disease, and environmental variables. J Pediatr Psychol. 2012;37(7):713–724.
- Wolkenstein P, Durand-Zaleski I, Moreno JC, et al. Cost evaluation of the medical management of neurofibromatosis 1: a prospective study on 201 patients. Br J Dermatol. 2000;142(6):1166–1170.
- IBM [Internet]. IBM MarketScan research databases. Armonk (NY): IBM; 2020 [cited 2020 January 29]. Available from: https://www.ibm.com/products/marketscan-research-databases
- IBM [Internet]. Data brochure: research databases for life sciences researchers. Armonk (NY): IBM; 2019 [cited 2020 May 2]. Available from: https://www.ibm.com/downloads/cas/OWZWJ0QO
- Neurofibroma Midwest [Internet]. Insurance coverage for neurofibroma removal. Saint Charles (IL): Neurofibroma Midwest; 2015. [cited 2020 September 3]. Available from: https://www.nfmidwest.org/wp-content/uploads/2016/03/Insurance-Coverage-of-Fibroma-Removal.pdf
- Rasu RS, Sohraby R, Cunningham L, et al. Assessing chronic pain treatment practices and evaluating adherence to chronic pain clinical guidelines in outpatient practices in the United States. J Pain. 2013;14(6):568–578.
- Cancer Research Network [Internet]. Cancer therapy look-up tables. Kaiser Permanente Division of Research. 2020 [cited 2020 January 29]. Available from: http://www.hcsrn.org/crn/en/RESEARCH/LookupTables/
- US Bureau of Labor Statistics [Internet]. Consumer price index. 2020 [cited 2020 October 3]. Available from: https://www.bls.gov/cpi/home.htm
- Kim A, Gillespie A, Dombi E, et al. Characteristics of children enrolled in treatment trials for NF1-related plexiform neurofibromas. Neurology. 2009;73(16):1273–1279.
- Lai JS, Jensen SE, Charrow J, et al. Patient reported outcomes measurement information system and quality of life in neurological disorders measurement system to evaluate quality of life for children and adolescents with neurofibromatosis type 1 associated plexiform neurofibroma. J Pediatr. 2019;206:190–196.
- Lai JS, Jensen SE, Patel ZS, et al. Using a qualitative approach to conceptualize concerns of patients with neurofibromatosis type 1 associated plexiform neurofibromas (pNF) across the lifespan. Am J Med Genet A. 2017;173(1):79–87.
- Dagalakis U, Lodish M, Dombi E, et al. Puberty and plexiform neurofibroma tumor growth in patients with neurofibromatosis type I. J Pediatr. 2014;164(3):620–624.
- Prada CE, Rangwala FA, Martin LJ, et al. Pediatric plexiform neurofibromas: impact on morbidity and mortality in neurofibromatosis type 1. The Journal of Pediatrics. 2012;160(3):461–467.
- Yang X, Desai K, Agrawal N, et al. Treatment, resource use and costs among pediatric patients with neurofibromatosis type 1 and plexiform neurofibromas. Pediatric Health Med Ther. 2020;11:421–428.
- Kongkriangkai AM, King C, Martin LJ, et al. Substantial pain burden in frequency, intensity, interference and chronicity among children and adults with neurofibromatosis type 1. Am J Med Genet A. 2019;179(4):602–607.