
Abstract
Objective
This study compared all-cause direct cost and healthcare resource utilization (HCRU) among preventive migraine medication (PMM)-naïve patients and patients with up to 3 PMM category switches before initiating calcitonin gene-related peptide (CGRP) monoclonal antibodies (mAbs).
Methods
This was a retrospective analysis of the IBM Marketscan database. Patients who initiated injectable CGRP mAbs between May 2018 and December 2019 (index period) were included in 4 groups based on the number of prior non-CGRP PMM classes used during the 24-month pre-index period: P0 = none; P1 = one; P2 = two; P3 ≥ three. All-cause direct cost and HCRU for groups were compared without adjustment and after generalized propensity score (GPS) matching.
Results
Of the 23,288 patients included (mean age ± standard deviation [SD] 45.4 ± 12.0 years), 85.6% were females, and the mean Charlson Comorbidity Index was 0.69 ± 1.2. P3 group had the highest average annual unadjusted total healthcare costs per patient ($50,274±$76,629); the highest costs attributed to procedure/imaging-related expenses ($20,105±$36,401) and pharmacy ($11,633±$29,763). P0 group had the lowest cost ($25,288±$41,427). Pairwise comparison of GPS matched costs showed significantly greater average annual direct costs per patient in the P3 group vs. P0 (p = .003), P1 (p = .014), and P2 (p = .021) groups. GPS matched HCRU also increased with the number of prior PMM classes used. Anti-epileptics (48.9%) were the most commonly used PMM class, with triptans (75.2%) being the most common acute medication class.
Conclusions
Total direct healthcare cost and HCRU increased significantly with increasing use of PMM classes with the greatest cost difference existing between the P0 and the P3 groups.
PLAIN LANGUAGE SUMMARY
Medications used for the prevention of migraine (PMM) are underused as they might cause adverse effects, intolerance, or may lack efficacy. This leads to the discontinuation of the current treatment and switching to other treatments. Calcitonin gene-related peptide (CGRP) monoclonal antibodies (mAbs) are a new class of drugs for the prevention of migraine. Since 2018, four CGRP mAbs have been approved for use in the prevention of migraine. It is known that patients who use more preventive migraine treatments incur greater total direct (caused by a number of medical visits or increased healthcare resource utilization, surgery, drugs, equipment, etc.) annual healthcare costs and healthcare resource utilization (HCRU) in patients with migraine. In the current study, the annual average direct cost and HCRU were compared between patients who had not used preventive medicine and patients who had used 1, 2, or ≥3 preventive medicines for migraine before starting CGRP mAbs. We observed that the healthcare costs and HCRU increased with the use of a higher number of preventive medicines for migraine. Patients who started using injectable CGRP mAbs after at least 3 preventive medicines had the highest healthcare costs and HCRU compared with other groups.
Introduction
Migraine, a debilitating neurological disorder marked by intense and recurring headachesCitation1, affects approximately 12% of the total population in the United States (U.S.)Citation2,Citation3, and is more prevalent in womenCitation3,Citation4. Migraine significantly impacts day-to-day functionCitation3,Citation5,Citation6, and its prevalence peaks during the prime years of employment (18–44 years)Citation2,Citation7.
Due to the impact on multiple aspects of life, migraine management incurs a significant economic burden for patients, payers, and the healthcare system. Each year, approximately $56 billion is spent on healthcare for migraine, and patients with migraine spend an incremental adjusted direct healthcare cost of over $9 billion each year compared to those without migraineCitation8,Citation9. When compared to a demographically similar population without migraine, patients with migraine had significantly greater annual direct costs, and odds of having short-term disability claims along with higher indirect costs, indicating a substantially greater direct and indirect cost burden in a real-world settingCitation10. Among the different components of direct costs, outpatient services and outpatient pharmacy costs for preventive migraine medications (PMMs) constituted up to 79.7% of the total costCitation9. Available PMMs in the U.S. such as beta-blockers, calcium channel blockers, anti-epileptics, and tricyclic antidepressantsCitation11,Citation12 are associated with low efficacy, poor tolerability, and side effects, leading to frequent switching or discontinuation of treatmentCitation13. As a result of the inadequacy of the PMMs before calcitonin gene-related-peptide (CGRP) antagonistsCitation13, and the high economic impact of migraine management on the healthcare systemCitation8,Citation10, there existed an unmet need for novel therapies for migraine.
The availability of CGRP monoclonal antibodies (mAbs) as a targeted therapy for migraine is an important step in migraine managementCitation14,Citation15. The American Headache Society consensus statement recommends the use of CGRP mAbs in patients who have been unable to tolerate or have had inadequate efficacy with at least 2 classes of PMMs after a 6-week trialCitation14.
Given the significant economic burden associated with switching PMMsCitation16, a comparison of healthcare costs for patients with migraine who initiate CGRP mAb therapy after using multiple PMMs is informative to payers, healthcare providers, and patients. Therefore, in this study, we compared the real-world direct healthcare cost and healthcare resource utilization (HCRU) in patients with migraine who initiated CGRP mAbs based on the number of prior PMM classes used. In addition, we described the demographic and clinical characteristics, treatment patterns, and acute medication use in the defined groups.
Methods
Study design and data sources
This was a retrospective cohort analysis that used data from the IBM MarketScan Early View database records from May 1, 2018, to December 31, 2019 (index period). The index event was defined as the date on which the patient-initiated CGRP mAbs. The study had a 24-month pre-index period, Supplementary Figure S1.
The database comprises de-identified healthcare records of approximately 263 million unique commercially insured patients, covered dependents, retirees with employer-sponsored supplemental Medicare coverage or Consolidated Omnibus Budget Reconciliation Act (COBRA) continuation plans in the U.S.Citation17. The data consist of administrative claims capturing patient-level data on age, sex, geographic region, HCRU, and expenditures associated with the continuum of care (inpatient, outpatient, prescription drug, and carve-out services). The database linked encounter data and diagnostic codes via the International Classification of Disease, 10th Revision (ICD-10). For this study, only pre-index data was analyzed, and post-index treatment effect data was not applicable.
This study was conducted in accordance with the ethical principles that have their origin in the Declaration of Helsinki and that are consistent with Good Pharmacoepidemiology Practices and applicable laws and regulations of the country where the study was being conducted, as appropriate. The de-identified records in the database complied with Section 164.514 (a)-(b) 1ii of the U.S. Health Insurance Portability and Accountability Act. The study was not registered.
Patient selection
Patients with migraine, aged ≥18 years at the index event of injectable CGRP mAb initiation and with at least one claim for CGRP mAbs during the index period, were included. Patients were required to have: a pre-index continuous 24-month medical and prescription enrollment and a confirmed migraine diagnosis using ICD-10 codes (ICD-10 G43.0X-G43.1X, G43.5X-G43.7X, and G43.9X) between May 1, 2016, and December 31, 2019. The classes of non-CGRP PMMs used in the pre-index period (before initiating CGRP mAbs) included antidepressants, anti-epileptics, neurotoxins, and beta-blockers.
Patients were divided into 4 mutually exclusive migraine groups based on the use of PMMs in the 24 months prior to CGRP mAbs initiation: i) P0: patients who used CGRP mAbs as their initial (and only) PMM; ii) P1: patients who initiated CGRP mAbs after cycling through 1 class of PMM; iii) P2: patients who initiated CGRP mAbs after cycling through 2 classes of PMM; and iv) P3: patients initiated CGRP mAbs after cycling through ≥3 classes of PMM. Usually, a PMM is selected based on the co-morbidities of the patient and is switched if the patient do not show a response after 2 months of starting a therapyCitation18.
Outcome measures
The main outcomes measured in this study were: i) average annual all-cause direct cost: healthcare costs associated with outpatient, inpatient, and emergency room (ER) visits, pharmacy costs, procedure and imaging costs, laboratory costs, and ii) HCRU: number of outpatient visits, inpatient stays, ER visits, laboratory visits, and procedure/imaging visits. The secondary outcomes included baseline and clinical characteristics, treatment patterns and acute medication overuse, and medication overuse headache. All outcomes were evaluated during the 24-month pre-index period before CGRP initiation.
The Charlson Comorbidity Index (CCI) was defined as a score based on the presence or absence of 17 chronic conditions identified from claims data for each cohort. The score was calculated for the diagnoses during the 24-month pre-index period, to help characterize the health severity of patientsCitation19. Acute medication overuse was defined as class-level average acute medication use per month during the study period. For each class, acute medication overuse was 8+ days/month for opioids, triptans, or ergotamines, 15+ days/month for prescription nonsteroidal anti-inflammatory drugs (NSAIDs), 5+ days/month for barbiturates, and 10+ days/month for any combination of ergotamine, triptans, analgesics, and/or opioids without overuse of a single classCitation20,Citation21. Medication overuse headache presented the proportion of patients having a diagnostic claim (G44.40) during the pre-index period.
Statistical methods
We described the patient characteristics, acute medication use, and healthcare cost and HCRU of the study population using frequencies with percentages for categorical variables and means with standard deviations (SDs) for continuous variables and compared group differences using chi-square tests for categorical variables and F-test for continuous variables before matching. Descriptive analyses were conducted using non-missing values.
To account for bias and confounding in this retrospective observational study, we used generalized propensity scores (GPS) matchingCitation19, which is an extension of the propensity scores for binary treatment cases to the setting of 3 or more intervention/treatment groups. The GPS was estimated using PROC LOGISTIC with variable selection (link = glogit selection = stepwise sle = 0.20 sls = 0.20). The confounding variables considered for the GPS model included age, sex, region, insurance type, chronic migraine diagnosis, and comorbidities (Supplementary Table S1). Each outcome of total direct healthcare cost and HCRU had a GPS model. Variables significantly associated with each outcome (e.g. total direct healthcare cost) from model selection were forced into the GPS model. The Crump trimming algorithm was implemented to find a common overlap population for analysisCitation22. The GPS matching with replacement within the group was performed to produce estimated counterfactual outcomes for every patient and every group. Means were estimated separately for each group. The p-value and 95% confidence interval (CI) for the estimated group means and mean the difference between groups were computed using the wild bootstrap algorithm (1000 bootstrap samples)Citation23,Citation24. A p-value of .05 was considered statistically significant. SAS version 9.4 (SAS Institute Inc) was used for all analyses.
Results
Patient disposition and baseline characteristics
We obtained IBM MarketScan claims analysis data for 1,974,861 individuals, of whom 37,608 patients were diagnosed with migraine between May 2016 and December 2019. The total population had an average age ± SD of 45.4 ± 12.0 years. Of the total population, a higher proportion was female compared with male (85.6% vs. 14.4%), from the southern region of the U.S., and consulted neurologists more than other physician types. The average overall CCI was 0.69 ± 1.2, with P3 group having the highest mean CCI score of 0.86 ± 1.3 (). Of the 37,608 patients, 23,288 were selected and assigned to groups based on the number of classes of non-CGRP PMM therapies received in the pre-index period: 4459 in P0 group, 9153 in P1 group, 6748 in P2 group, and 2928 in P3 group (). Demographic and baseline medical characteristic data for all 4 groups are presented in .
Figure 1. Patient disposition flowchart. aPatients were excluded for non-continuous medical and pharmacy enrolment 24-month pre-index event and <18 years of age. Abbreviations. CGRP: calcitonin gene-related peptide; mAbs: monoclonal antibodies; P0: patients with CGRP mAbs as their initial PMM; P1: patients with CGRP mAbs after using one class of PMM; P2: patients with CGRP mAbs after using 2 classes of PMM; P3: patients with CGRP mAbs after ≥3 or more classes of PMM; PMM: preventive migraine medication.
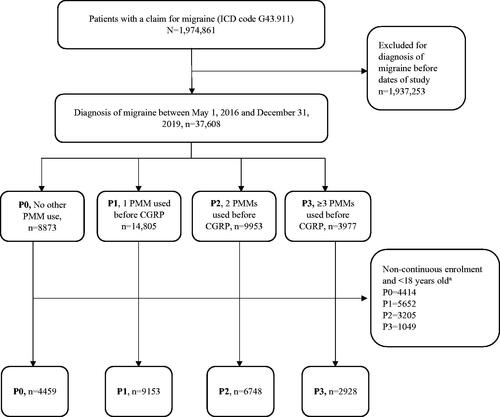
Table 1. Demographic and patient characteristics at index event – unadjusted.
Pre-Index annual average direct cost
The mean ± SD unadjusted total average annual direct healthcare costs in the pre-index period were lowest for patients in the P0 group ($25,287.9 ± $41,427.0 per patient), followed by patients in P1 ($32,158.0 ± $52,820.6 per patient), P2 ($39,433.1 ± $59,982.5 per patient), and P3 ($50,273.8 ± $76,629.2 per patient), (p < .001) (Supplementary Table S2). The mean costs for all the individual direct healthcare services were also lowest in the P0 group. Costs of outpatient visits, imaging and procedure, and pharmacy accounted for the majority of the total healthcare cost in all the groups.
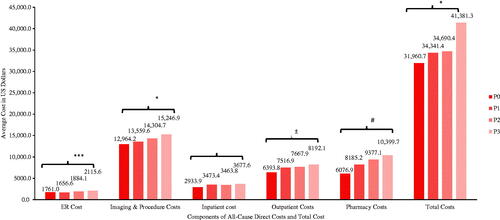
The total average GPS matched cost of direct healthcare per patient (mean [95% CI]) was lower in the P0 group ($31,960.7 [95% CI $29,132.9–$34,788.6]) compared with the P1 ($34,341.4 [95% CI $32,839.5–$35,843.2]), P2 ($34,690.4 [95% CI $33,305.4–$36,075.4]), and P3 ($41,381.3 [95% CI $35,907.6–$46,855.0]) groups (). The total average direct cost in the P3 group was significantly greater than the P0 group (p = .003), P1 group (p = .014) and P2 group (p = .021) (). The highest adjusted costs were attributed to imaging/procedure-related expenses, pharmacy, and outpatient costs in all the groups. The P0 group had significantly lower adjusted mean (95% CI) costs for imaging and procedures compared with the P3 group ($12,964.2 [95% CI $11,836.2–$14,092.2] vs. $15,247.0 [95% CI $14,126.6–$16,367.3]; difference -$2282.8 [95% CI $-3858.7–$-706.9], p = .005). Mean (95% CI) pharmacy and outpatient costs in the P0 group were significantly lower compared with the P1, P2, and P3 groups (p < .005 for comparisons with P0) (). In addition, outpatient costs in the P1 group were significantly lower compared with the P3 group ($7516.9 [95% CI $7209.1–$7824.7] vs. $8192.1 [95% CI $7635.3–$8748.9]; difference $-675.2 [95% CI $-1307.7–$-42.7], p = .036).
Figure 2. Pairwise comparisons between groups for total direct healthcare costs – GPS matched. Pairwise comparisons were made between P0 (comparator) and other groups (P1, P2, P3) at p < .005. *Total cost and Imaging and procedure cost: significant difference between P0 vs. P3 (p ≤ .005). ***ER cost: significant difference between: P1 vs. P3 (p = .002). #Pharmacy cost: significant difference between: P0 vs. P1, P0 vs. P2 (p < .001) and P0 vs. P3, p = .005. ±Outpatient cost: significant difference between P0 vs. P1, P0 vs. P2, and P0 vs. P3, p ≤ .001.
Pre-Index HCRU
HCRU unadjusted for baseline covariates showed patients in the P0 group had the lowest mean ± SD ER visits, 0.9 ± 2.0, compared with the P1 (1.1 ± 3.4), P2 (1.4 ± 3.0), and P3 (2.0 ± 4.9) groups. Compared with other groups, the P3 group had a greater number of mean outpatient visits, imaging/procedure-related visits, inpatient visits, laboratory visits, and urgent care visits (Supplementary Table S3).
Pairwise comparisons for HCRU showed that the P0 group had a significantly lower mean (95% CI) number of imaging and procedure visits (43.2 [95% CI 41.6–44.7]) compared with the P1 (47.4 [95% CI 46.3–48.4]), P2 (49.3 [95% CI 48.2–50.4]), and P3 (53.2 [95% CI 51.3–55.0]) groups (p < .001 for all comparisons vs. P0). In addition, P0 had significantly lower rates of outpatient visits compared to P1, P2, and P3 after GPS matching (p < .001). The P0 group had significantly lower rates of ER visits compared with the P3 group (1.1 [95% CI 1.0–1.2] vs. 1.5 [95% CI 1.4–1.7], p < .001) ().
Table 2. All-cause HCRU in 24-month pre-index period – GPS matched.
Pre-Index treatment patterns and acute medication use
Approximately 49% (n = 11,382) of total patients had a PMM prescription claim for an anti-epileptic medication during the 24-month pre-index period (). The highest proportion of patients using anti-epileptics was in the P3 group (88.2%, n = 2581), followed by P2 (69.7%, n = 4705), and P1 (44.8%, n = 4096). Other PMMs used before initiation of CGRP mAbs included beta-blockers (32.5%), antidepressants (28.1%), and onabotulinumtoxinA (27.3%).
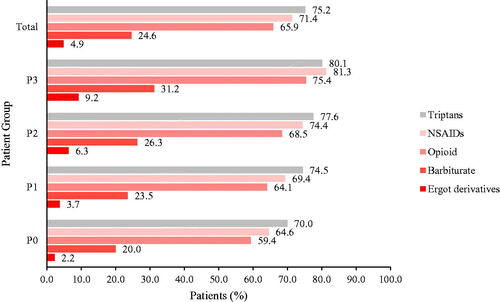
During the pre-index period, triptans (75.2%, n = 17,522) were the most commonly filled prescriptions for acute medication, followed by NSAIDs (71.4%, n = 16,634), and opioids (65.9%, n = 15,351) (). On average, the proportion of acute medication use increased as the number of PMMs used increased: opioid users were 59.4% (n = 2649) in the P0 group, 64.1% (n = 5868) in P1, 68.5% (n = 4625) in P2, and 75.4% (n = 2209) in P3. The P3 group also had the highest proportion of patients using triptans (80.1%, n = 2344) and NSAIDs (81.3%, n = 2379). The rate of acute medication overuse was >85%, with a diagnosis of medication overuse headache being <10% across all the PMM groups (overuse: P3 = 88.1%, P2 = 87.6%, P1 = 85.7%, and P0 = 85.1%; overuse headache: P3 = 8.7%, P2 = 5.6%, P1 = 4.4%, and P0 = 3.1%).
Figure 3. Acute medication uses a 24-month pre-index – unadjusted. NSAIDs: nonsteroidal anti-inflammatory drugs.
Comorbidities
Of the 25 comorbidities identified as covariates in the study during the pre-index period (Supplementary Table S1), the ones with a prevalence rate of >15% in the total population are presented in Supplementary Table S4. Anxiety was the most prevalent comorbidity in the total population. The P3 group had a greater prevalence of comorbidities compared with the P0 group, the P1 group (except for sinusitis and allergy/hay fever) and the P2 group (except for sinusitis, allergy/hay fever, obesity, osteoarthritis, and asthma) (Supplementary Table S4).
Discussion
The results of this retrospective study indicated that the unadjusted baseline characteristics across the groups were generally balanced, with a few significant differences observed in the pairwise comparisons. In terms of pre-index medication class drug use, anti-epileptics were the most commonly used drugs, followed by beta-blockers. In addition to the PMMs, 75.2% of patients were administered triptans as acute medication across the 4 groups. As an observation, the proportion of patients with acute medication use increased from the P0 to P3 groups. Using GPS matching in our study, we observed that the patients initiating CGRP mAbs when naïve to other PMMs during the study period reported lower direct costs and HCRU compared to the patients who had received 1 or more conventional PMMs before switching to CGRP mAbs. As imaging and procedural, pharmacy, and outpatient costs were major components of the total cost, lower utilization in the P0 group led to lower total costs compared with other groups, especially in the case of the P0 versus P3 group. In our study, neurologists constituted approximately 50% of the physicians. This is important as neurologists may make a more accurate diagnosis, differentiate migraine from other neurological conditions which have migraine-like symptoms, and provide other treatment options, including newer treatments, at an earlier stage compared with general practitioners. In addition, more complex patient cases get referred to specialists. Given the nature of our analysis, it was likely that the treating HCPs were not the first contact for patients with a higher number of prior preventive migraine treatments.
Previous research has established that a higher number of PMM switches or discontinuations leads to higher costs and higher HCRU compared with a lower number of switches or discontinuationsCitation16. However, this is the first study to explore the economic impact leading up to CGRP mAbs initiation relative to placement in migraine therapy. The findings of the current research are important because they present real-world treatment patterns and comparisons of economic burden during the 24 months prior to initiation of a CGRP mAb, specifically addressing when patients initiate a CGRP mAb as their first PMM versus patients who switch to a CGRP mAb after 1, 2, or ≥3 non-CGRP PMMs.
The findings of the current study have some similar trends as previous researchCitation16. Previously, patients who persisted with the first initiated PMM had lower all-cause and migraine-specific costs, and HCRU, compared with the patients with 2 or 3 PMM switches. The main contributors to overall cost in the previous research included outpatient and pharmacy costs, followed by ER costs and inpatient costsCitation16. The current study and previous research are similar in terms of outpatient services and outpatient costs being the major contributor to the overall cost. However, some major differences exist between the current and previous studies. In the current study, the all-cause annual direct cost was evaluated for 24-months pre-index, whereas previous research evaluated 12-months pre- and post-index among patients with migraine. In addition, the current study was specific to a migraine population that was initiating CGRP mAbs as the index event, whereas the previous research was specific to non-CGRP PMM initiation as the index event. Additionally, this study specifically addressed cost and utilization for labs, imaging, and procedures. Other research has also found outpatient visits to be a major factor for higher treatment costsCitation5,Citation25.
In the current study, unadjusted mean HCRU was lowest for the P0 group in the pre-index period, and the P0 group had the least number of mean outpatient visits, imaging/procedure-related visits, inpatient visits, laboratory procedures, and urgent care visits, except for similar mean laboratory procedure visits in the P0, P1, and P2 groups. GPS matched results also showed a similar trend of lowest mean HCRU, in terms of significantly lower outpatient visits and imaging and procedure visits, compared with all other groups. In previous research, patients with migraine had greater HCRU compared to patients without migraineCitation10. Furthermore, in separate research, a trend of increasing all-cause and migraine-specific HCRU (for inpatient, ER, and outpatient visits) was observed from the PMM persistent group to the group switching to ≥3 PMMs, with the exception of a decrease in HCRU from the PMM persistent group to the group switching to 1 PMM for outpatient visits. Increasing HCRU from the persistent group to the group switching to ≥3 PMMs indicated greater severity and unmet need in migraine management and hence the single or multiple switches in therapyCitation16.
In the current study, anti-epileptics were the most commonly used PMM class (48.9%) during the pre-index period before CGRP mAb initiation. Beta-blockers (32.5%), antidepressants (28.1%), and onabotulinumtoxinA (27.3%) were other classes of PMM used before CGRP initiation. For anti-epileptics, usage decreased from the P1 to P3 group, but an opposite trend was observed for all other PMMs. Similar to our findings, previous research showed anti-epileptics as the most common index PMM class followed by beta-blockers, antidepressants, and neurotoxins. However, PMM class treatment patterns were different from the study reported here, with variations in increases or decreases across the PMM subgroupsCitation16.
As would be expected for this disease state, the majority of the study population (>85%) had acute prescriptions in addition to the preventive medication. Acute medication use for all classes saw an upward trend from the P0 group to the P3 group. Previous research reflected a similar trend of increasing acute treatment utilization with more PMM switchesCitation16, despite differences in study design from the current research. In the current study, triptans (75.2%) were the most common acute medications, followed by NSAIDs (71.4%), and opioids (65.9%). Other studies have also demonstrated opioids and triptans as commonly utilized acute medications (>50% patients) Citation5,Citation25. Among the different acute medications prescribed in migraine, triptans are prescribed for moderate to severe migraine whereas NSAIDs are prescribed as first-line for mild to moderate migraine or when triptans are contraindicated. Previous studies have shown that NSAIDs present one of the most common low-cost treatment options; however, more than 50% of patients switch to triptans due to greater efficacy despite the higher costCitation26. Furthermore, patients treated with triptans need to visit HCPs for monitoring triptan dose, adding to the migraine cost burden vs. NSAIDsCitation26–28. Over-the-counter NSAID use would not have been captured in claims data, thus, this analysis may not adequately reflect overall NSAID use in this population.
The strengths of our study include uniquely comparing between subgroups defined by the number of PMMs received prior to the index event of CGRP mAb initiation. The real-world data source provided a large sample size for evaluating treatment patterns, cost, and HCRU. Additionally, the data consisted of adjudicated healthcare claims which provide more accurate cost estimates.
Limitations
The results of this study should be interpreted after considering the limitations. As this analysis was exploratory in nature and only focused on the pre-index period, the effect of treatments and other post-index outcomes were not explored, and causality was not evaluated. The current study was US-specific and might not be generalizable to other countries. Another limitation was that the patients could have been on PMMs prior to the 24-month pre-index period, which was not captured in this study. We had the high number of patients in the P1 group despite the American Headache Society Consensus Statement guidelines (use of CGRPs in patients unable to tolerate or have had inadequate efficacy with at least 2 classes of PMMs after a 6-week trial). The reason for a higher number in the P1 group could be due to the limitations of claims data or the medication usage prior to the 24-month pre-index period. The study only included patients with insurance claims, which may make these findings less generalizable. As medication use was based on prescription claims, factors such as actual patient consumption, specific indication, use of over-the-counter treatments, such as NSAIDs, and alternative treatments for headache disorders were not captured in the database. We also assumed that pharmacy claims were equivalent to patient consumption of medication and the PMMs were prescribed only for migraine. The PMM classes evaluated are all approved for uses other than migraine; however, we did not exclude patients with other diagnoses that the PMM classes treat and hence the use of some PMMs could be overstated for the treatment of migraine. The findings presented in this study reflected all-cause cost and not the migraine-specific cost and HCRU. In addition, we did not separate patients with episodic and chronic migraine. Sixth, the IBM database lacked vital information on disease severity, as well as the rationale for first PMM selection, PMM class switch, or discontinuation. In addition to inadequate efficacy, cost-related factors could have influenced the decision for prescribing a PMM (e.g. formulary changes, patients’ ability, or inability to pay). Anti-epileptics were administered as the most common PMM in the 24-month pre-index period, however, the reasons for prescribing anti-epileptics as the most common pre-index therapy were not explored. Lastly, we did not have information on adherence or persistence for the medications used in the pre-index period; therefore, these outcomes were not evaluated.
Conclusion
In summary, the total direct healthcare cost and HCRU increased with the number of PMM classes administered before injectable CGRP mAb initiation in patients with migraine. Overall, patients treated with ≥3 PMMs in the pre-index period had the highest direct cost of treatment and HCRU compared with patients who did not receive any PMMs in the pre-index period. More studies are required to determine change in healthcare costs and HCRU in post-CGRP mAbs initiation.
Transparency
Declaration of funding
The study was funded by Eli Lilly and Company.
Declaration of financial/other relationships
SAF, MH, WY, OM, and JHF are employees and stockholders at Eli Lilly and Company. Peer reviewers on this manuscript have no relevant financial or other relationships to disclose.
Author contributions
SAF conceptualized the work. SAF, JHF, MH, OM, and WY were involved in designing the study, interpretation of data. All authors were involved in drafting and critical revision of the manuscript. All authors approved the final version of the manuscript.
Presentation declaration
Previously presented at AMCP NEXUS 2020 Virtual (Abstract G39: https://www.jmcp.org/doi/pdf/10.18553/jmcp.2020.26.10-a.s1)
Supplemental Material
Download MS Word (181.3 KB)Acknowledgements
Karan Sharma from Eli Lilly and Company provided medical writing support. Afsah Amin was an intern with Eli Lilly and Company during this study and provided design and analytics support.
Data availability statement
The datasets generated during and/or analyzed during the current study are not publicly available due to their proprietary nature and the associated restrictions that apply to their availability to external sources. Data may be made available through the corresponding author upon reasonable request and with permission of IBM MarketScan Early View database.
References
- Headache Classification Committee of the International Headache S. The international classification of headache disorders, 3rd edition (beta version). Cephalalgia. 2013;33(9):629–808.
- Migraine Research Foundation. Migraine facts. [cited August 23, 2020]. Available at: https://migraineresearchfoundation.org/about-migraine/migraine-facts/.
- Buse DC, Manack AN, Fanning KM, et al. Chronic migraine prevalence, disability, and sociodemographic factors: results from the American Migraine Prevalence and Prevention Study. Headache. 2012;52(10):1456–1470.
- GBD 2016 Headache Collaborators. Global, regional, and national burden of migraine and tension-type headache, 1990–2016: a systematic analysis for the global burden of disease study 2016. Lancet Neurol. 2018;17:954–976.
- Silberstein SD, Lee L, Gandhi K, et al. Health care resource utilization and migraine disability along the migraine continuum among patients treated for migraine. Headache. 2018;58(10):1579–1592.
- Ford JH, Ye W, Nichols RM, et al. Treatment patterns and predictors of costs among patients with migraine: evidence from the United States medical expenditure panel survey. J Med Econ. 2019;22(9):849–858.
- Lipton RB, Bigal ME, Diamond M, et al. Migraine prevalence, disease burden, and the need for preventive therapy. Neurology. 2007;68(5):343–349.
- Raval AD, Shah A. National trends in direct health care expenditures among US adults with migraine: 2004 to 2013. J Pain. 2017;18(1):96–107.
- Gilligan AM, Foster SA, Sainski-Nguyen A, et al. Direct and indirect costs among United States commercially insured employees with migraine. J Occup Environ Med. 2018;60(12):1120–1127.
- Bonafede M, Sapra S, Shah N, et al. Direct and indirect healthcare resource utilization and costs among migraine patients in the United States. Headache. 2018;58(5):700–714.
- Hepp Z, Bloudek LM, Varon SF. Systematic review of migraine prophylaxis adherence and persistence. J Manag Care Pharm. 2014;20(1):22–33.
- Estemalik E, Tepper S. Preventive treatment in migraine and the new US guidelines. Neuropsychiatr Dis Treat. 2013;9:709–720.
- Hepp Z, Dodick DW, Varon SF, et al. Adherence to oral migraine-preventive medications among patients with chronic migraine. Cephalalgia. 2015;35(6):478–488.
- American Headache Society. The American Headache Society position statement on integrating new migraine treatments into clinical practice. Headache. 2019;59(1):1–18.
- Huang IH, Wu PC, Lin EY, et al. Effects of anti-calcitonin gene-related peptide for migraines: a systematic review with meta-analysis of randomized clinical trials. Int J Mol Sci. 2019;20(14):3527.
- Ford JH, Schroeder K, Nyhuis AW, et al. Cycling through migraine preventive treatments: implications for all-cause total direct costs and disease-specific costs. JMCP. 2019;25(1):46–59.
- IBM Watson Health. IBM MarketScan research databases for health services research–white paper. Somers (NY): IBM; 2018.
- Ha H, Gonzalez A. Migraine headache prophylaxis. Am Fam Physician. 2019;99(1):17–24.
- Deyo RA, Cherkin DC, Ciol MA. Adapting a clinical comorbidity index for use with ICD-9-CM administrative databases. J Clin Epidemiol. 1992;45(6):613–619.
- Bigal ME, Lipton RB. Excessive acute migraine medication use and migraine progression. Neurology. 2008;71(22):1821–1828.
- Silberstein SD, Olesen J, Bousser MG, et al. The international classification of headache disorders, 2nd edition (ICHD-II)-revision of criteria for 8.2 medication-overuse headache. Cephalalgia. 2005;25(6):460–465.
- Crump RK, Hotz VJ, Imbens GW, et al. Dealing with limited overlap in estimation of average treatment effects. Biometrika. 2009;96(1):187–199.
- Yang S, Imbens GW, Cui Z, et al. Propensity score matching and subclassification in observational studies with multi-level treatments. Biometrics. 2016;72(4):1055–1065.
- Faries DE, Zhang X, Kadziola Z, et al. Real world health care data analysis: Causal methods and implementation using SAS®. Cary (NC): SAS Institute Inc.; 2020.
- Bonafede M, Cai Q, Cappell K, et al. Factors associated with direct health care costs among patients with migraine. JMCP. 2017;23(11):1169–1176.
- Affaitati G, Martelletti P, Lopopolo M, et al. Use of nonsteroidal anti-Inflammatory drugs for symptomatic treatment of episodic headache. Pain Pract. 2017;17(3):392–401.
- Xu H, Han W, Wang J, et al. Network Meta-analysis of migraine disorder treatment by NSAIDs and triptans. J Headache Pain. 2016;17(1):113.
- Linde M, Steiner TJ, Chisholm D. Cost-effectiveness analysis of interventions for migraine in four low- and middle-income countries. J Headache Pain. 2015;16:15.