
 ?Mathematical formulae have been encoded as MathML and are displayed in this HTML version using MathJax in order to improve their display. Uncheck the box to turn MathJax off. This feature requires Javascript. Click on a formula to zoom.
ABSTRACT
Purpose/aim
Corneal injury is a major cause of impaired vision around the globe. The fine structure of the corneal stroma plays a pivotal role in the phenotype and behavior of the embedded cells during homeostasis and healing after trauma or infection. In order to study healing processes in the cornea, it is important to create culture systems that functionally mimic the natural environment.
Materials and methods
Collagen solution was vitrified on top of a grated film to achieve thin collagen films with parallel microgrooves. Keratocytes (corneal stromal cells) were cultured on the films either as a single layer or as stacked layers of films and cells. SEM and F-actin staining were used to analyze the pattern transference onto the collagen and the cell orientation on the films. Cell viability was analyzed with MTS and live/dead staining. Keratocytes, fibroblasts, and myofibroblasts were cultured to study the pattern’s effect on phenotype.
Results
A microstructured collagen film-based culture system that guides keratocytes (stromal cells) to their native, layerwise perpendicular orientation in 3D and that can support fibroblasts and myofibroblasts was created. The films are thin and transparent enough to observe cells at least three layers deep. The cells maintain viability in 2D and 3D cultures and the films can support fibroblast and myofibroblast phenotypes.
Conclusions
The films provide an easily reproducible stroma model that maintains high cell viability and improves the preservation of the keratocyte phenotype in keratocytes that are differentiated to fibroblasts.
KEYWORDS:
Introduction
The cornea is the outermost layer of the eye, playing a crucial role in light transmission. It is made out of five functionally distinct layers (epithelium, Bowman’s membrane, stroma Descemet’s membrane, and endothelium). As the majority of the cornea is comprised of the stroma, representing 90% of the total thickness, it is a vital component for its optical clarity. The stroma’s optical properties are mainly governed by the organization of its structural components.Citation1 The stroma consists mostly of thin layers (2.5 µm) of aligned type I collagen fibers in an orthogonal conformation with a sparse number of keratocytes.Citation2 There are other types of collagen present as well that help pack and maintain the diameter of the type I fibers, such as type V collagen, which is the most prominent next to type I.Citation3 The stromal structure and its optical properties are also affected by a number of proteoglycans: Decorin, fibromodulin, lumican, and biglycan, all of which regulate type I collagen fibril formation through their leucine-rich domain.Citation4–6
Stromal wounds are common and if they heal with restored structure, they do not affect the vision. However, a dysregulated wound healing response may cause fibrotic scar formation and subsequent vision impairment, which is the 4th leading cause of blindness on an international scale.Citation7 Therefore, understanding the pathophysiological mechanisms for when and how the stroma repairs itself correctly is of clinical importance. Three different cell types can be found in the stroma during wound healing: Keratocytes, fibroblasts, and myofibroblasts. It is known that soon after the wound is formed, the keratocytes at the edge of the wound change their phenotype to become fibroblasts. The fibroblasts then start remodeling the extracellular matrix around the wound by producing matrix metalloproteinases.Citation8 In the bed of the wound, the fibroblasts begin to express α-smooth muscle actin (α-SMA) and change their phenotype to myofibroblasts.Citation9 Myofibroblasts are motile and contractile and therefore necessary for closing the wound gap.Citation10
It is challenging to study the stromal cells in monolayer cultures, since it is not their typical environment. In particular, the keratocyte phenotype readily drifts to a fibroblast-like one, when cultured in monolayers, and in the presence of fetal bovine serum (FBS).Citation11 Several culture systems have been developed to remedy the shortcomings of monolayer cultures, but more complicated culture systems are often based on materials that are not native to the cornea, such as silk and chitosan.Citation12–15 Collagen, being a major component of the stroma, has obvious benefits as a basis for a culture system and it has been shown to be a viable material for keratocyte maintenance even in the presence of FBS.Citation16,Citation17 However, tuning the mechanical properties of collagen-based culture systems can be difficult, as the collagen concentration is often not sufficient to form mechanically robust systemsCitation17. Surface topography can be used to guide cell phenotype and morphology, and cell orientation can affect the orientation of the produced collagen.Citation18 It has also been shown that aligned collagen fibers can help transform fibroblasts into keratocytes.Citation19 Collagen vitrification is a cost-effective way to create more robust structures, and it has been used to create a corneal model before.Citation16 However, as far as we know, patterned collagen vitrigels for studying corneal stromal cells have not yet been explored. In this study, we aimed to create a multilayered and micropatterned collagen vitrigel-based culture system that would maintain and guide the corneal stromal cells to have a more natural organization.
Materials and methods
Preparation of collagen surfaces
Holographically grated polyethylene terephthalate (PET) films (1,000 grooves/mm, #40-267 Edmund optics, York, UK) were cut into squares and cleaned with 70% ethanol. After drying, 12 µl/cmCitation2 of type I collagen solution (PureCol® EZ Gel 5 mg/ml, Advanced Biomatrix, San Diego, CA) was evenly spread on the grated films, either on the grated or flat side, and left in an oven to vitrify for 24 h at 37 °C. The following day 48 µl/cmCitation2 of the type I collagen solution was spread on top of the preexisting collagen layer and left to vitrify for 24 h at 37 °C. The vitrified collagen films were cross-linked with 22.4 mM of N-(3-dimethylaminopropyl)-N′-ethylcarbodiimide hydrochloride (EDAC) and 4.6 mM of N-hydroxysulfosuccinimide sodium salt (sulfo-NHS) in 70% ethanol solution for 2 h at room temperature. After cross-linking, the collagen films were washed twice with 70% ethanol and then twice with phosphate-buffered saline (PBS). The films were prepared for cell culture by cutting them with a biopsy punch (ø = 8 mm) and sterilizing them under a UV light for 20 minutes.
Cell source
Keratocytes were acquired from healthy corneal tissue through the Tissue Establishment, Eye Bank Umeå, at the University Hospital of Umeå. The tissues originated from diseased individuals who had chosen to be postmortem tissue donors for research purposes, according to Swedish law. The Regional Ethical Review Board in Umeå has deemed the use of the tissue to be exempt from the requirement of approval from the board (2010‐373‐31 M).
Cell culture
Keratocytes were isolated from the donated tissues as described previously.Citation20,Citation21 Briefly, the corneal samples were received in DMEM supplemented with dextran, after which they were scraped with a scalpel to remove the remaining epithelial and endothelial cells. After this, the tissues were rinsed with culture medium (DMEM/F-12, Gibco, Carlsbad, USA) and cut into pieces approximately 1–2 mm2 in size and placed in a collagenase bath (2 mg/ml) at 37 °C overnight to free the keratocytes from the extracellular matrix. The following day, the digest was centrifuged to separate the cells before they were re-suspended in fresh medium supplemented with 2% fetal bovine serum (FBS) (Gibco, Carlsbad, USA) and 1% penicillin-streptomycin (Invitrogen, Carlsbad, USA). Keratocytes were differentiated into fibroblasts and myofibroblasts by adjusting the culture medium to include 10% FBS or 10% FBS, 0,25 ng/ml TGF-β1 and 0,5 mM L‐ascorbic acid 2‐phosphate sesquimagnesium salt hydrate, respectively.Citation22,Citation23 20 000 cells/cmCitation2 were seeded on the films for all experiments. All cell cultures were maintained in a humidified incubator at 37 °C and 5% CO2. In this study, cells cultured in 2% FBS were referred to as keratocytes in accordance with findings in our previous studies.Citation20,Citation21,Citation24 Cells cultured in 10% FBS were referred to as fibroblasts and cells cultured in 10% FBS with TGF-β1 and ascorbic acid were referred to as myofibroblasts, in accordance with findings in other studies.Citation25–27
Scanning electron microscopy
After the cells were maintained for 3 days on the collagen films, the films were fixed with 2.5% glutaraldehyde in sodium cacodylate buffer for 2.5 h at room temperature, washed in sodium cacodylate buffer, and subsequently dehydrated with an increasing ethanol gradient, critical point dried and coated with 5 nm platinum. The morphology of the samples was analyzed by field-emission scanning electron microscopy (SEM) (Merlin, Carl Zeiss, Oberkochen, DE) using an in-lens secondary electron detector at an accelerating voltage of 4 kV and a probe current of 120 pA. Collagen fiber diameter analysis was performed in Fiji.Citation28 First difference of Gaussians algorithm was used to highlight the fibers, after which the mean fiber diameter was measured using a ridge detection plugin.Citation29
Atomic force microscopy
Samples were prepared for atomic force microscope (AFM) by reusing the collagen film samples prepared for SEM or by cutting a small piece of the PET film used as a template and fixing it on metallic disc using commercially available double-sided tape. The Bioscope Catalyst AFM (Bruker, CA, USA) was used to image the samples at ambient temperature. Images of various sizes (5 × 5 and 15 × 15 µm2) with 512 × 512 pixels were acquired in Peak Force Tapping mode, with a tapping amplitude typically of 100 nm and a peak force driving frequency of 2 kHz using sharpened triangular Si3N4 cantilevers (nominal spring constant = 0.4 N/m, ScanAsyst-Air; Bruker, tip radius ~2 nm). Images were plane fitted when required using Nanoscope Analysis Software without noise filtering or sharpening.
Immunocytochemistry
Cell orientation was measured from cells that had been grown on non-stacked films. Only cells that were maintained in 2% FBS were used for the measurement. After maintaining the cell cultures for 7 days, the films were washed with PBS, and the cells were then permeabilized in 0.3% Triton-X-100. The cells were then stained for F-actin (BODIPY FL Phallacidin, Life Technologies, Carlsbad, USA) according to the manufacturer’s instructions. The cells were imaged using a fluorescence microscope (IX71, Olympus, Tokyo, JP). Cell morphology was visualized on stacked films. F-actin staining was used to visualize the cell morphology, and it was performed as previously mentioned. All samples were mounted with ProLong Diamond Antifade Mountant with DAPI (4′,6-diamidino-2-phenylindole, Life Technologies, Carlsbad, CA). All stacked film constructs were imaged with a confocal microscope (SP8, Leica, Wetzlar, DE).
Cell alignment measurement
The cell orientation was estimated by calculating the orientation of the actin fibers in relation to the groove direction on the collagen film. The orientation of the actin fibers was calculated using OrientationJ Distribution plugin in ImageJ. Minimum coherency and energy were set to 5%, and the Gaussian window was approximated by the thickness of the fibers. The orientation was measured from two images per sample, which were then summed together and binned into 10 degree groups, i.e. orientation within a 10-degree window were clustered into one group. Measurements were normalized so that 0 degrees was the groove direction and the groove direction was determined by marking the edge of the films in the direction of the grooves prior to the start of the experiment.
Gene expression analysis
Total RNA was isolated from the cells grown either on tissue culture polystyrene (TCP) or on the collagen films with or without patterning (n ≥ 5) using RNeasy Mini kit (Qiagen, Hilden, DE). The isolation was done according to manufacturer’s instructions for isolation from cell culture. 500 ng of the RNA was reverse transcribed to cDNA with High‐Capacity cDNA Reverse Transcription Kit (Life Technologies, Carlsbad, USA). Gene expression was analyzed from the cDNA with TaqMan Gene Expression Assays (Applied Biosystems, Carlsbad, USA). The gene expression is represented as the relative expression of the target gene, which is normalized to the expression on the patterned collagen films. β‐actin was used as the endogenous control in all experiments. All probes were acquired from Applied Biosystems (Carlsbad, USA) and they are summarized in .
Table 1. Probes used for gene expression analysis from Applied Biosystems.
[insert ]
Western blot
Cells were collected in triplicates and combined into one sample for each condition. Samples were lysed in Radioimmunoprecipitation Assay (RIPA) lysis buffer, supplemented with protease inhibitor (Sigma, St. Louis, MO) and diluted in Laemmli buffer (Bio‐Rad, Hercules, USA) supplemented with β‐mercaptoethanol. After boiling the samples, equal amounts of total protein were loaded into each well of a pre‐made 12% gel (Mini‐PROTEAN TGX, Bio‐Rad, Hercules, USA) and ran at 120 V for approximately 1 h. Subsequently, proteins were transferred to a polyvinylidene fluoride transfer membrane (Santa Cruz, Dallas, USA) for 60 min at 100 V. Membranes were blocked for 1 h in room temperature before primary antibody was added and incubated at 4 °C overnight. After washing, the membranes were exposed to the secondary antibody (conjugated with horseradish peroxidase, HRP) for 1 h and then to the enhanced chemiluminescence solution (GE healthcare, Little Chalfont, UK) for 5 min in room temperature. The membranes were developed using Odyssey Fc imaging system (LI‐COR, Lincoln, USA). All antibodies used are summarized in .
Table 2. Antibodies used for immunofluorescence staining and Western blot.
[insert ]
Transparency
The collagen films were cut to fit in five wells of a 96 well plate. The films were submerged in PBS, and the absorbance was measured at a physiologically relevant range of 300 to 700 nm using Synergy HT plate reader (BioTek, Winooski, USA). The absorbance was converted to transparency using the formula:
3D corneal model
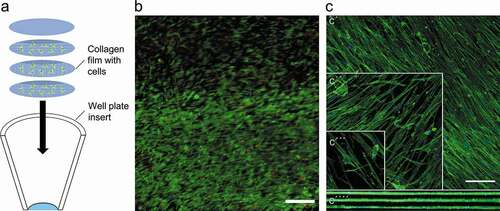
Cells were seeded on the prepared collagen films and left to attach for 24 h before stacking three films with cells on top of each other into a cell culture insert (product# 353,097, Falcon, New York, USA). One film without any cells was placed on top (Figure). A cylindrical weight was prepared from a 1 ml pipette tip, and it was placed on top of the constructs to hold the films in place, while cell culture media was added for the first time. The weight was not used for subsequent media changes. All experiments with the 3D constructs were conducted with 2% FBS. The constructs were maintained for 4 days to determine cell viability with a live/dead assay (L-3224 Invitrogen, Carlsbad, USA) and for 2 weeks for collagen production and morphology analysis in a humidified incubator at 37 °C and 5% CO2. Cell morphology was studied by staining for actin fibers as described in the immunocytochemistry section. The cells were imaged with a confocal microscope (Leica SP8, Wetzlar, DE).
Cell viability
Metabolic activity of the keratocytes cultured on a single layer of the prepared films was analyzed with CellTiter 96 AQueous One Solution Cell Proliferation Assay (Promega, Fitchburg, USA). The absorbance of the culture media was read at 490 nm by a Synergy HT plate reader (BioTek, Winooski, USA). Live/dead assay was performed according to manufacturer’s instructions apart from increasing the incubation time from 30 minutes to 45 minutes to achieve stronger staining between the films.
Statistics
Statistical analysis was performed with one-way ANOVA and Tukey’s multiple comparison post hoc test in all experiments. Data normality was verified using the Shapiro–Wilk test. P-values below 0.05 were considered statistically significant. All experiments were performed in at least technical triplicates and successfully repeated at least three times, meaning at least three separate experiments were performed with cells isolated from different patients.
Results
Collagen film fabrication and characterization
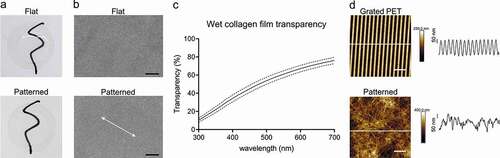
Collagen vitrification and cross-linking yielded thin (19 ± 3 µm, average ± SD, n = 4) and clear films that ranged from 10% to 76% transparency across the visible spectrum (, c). The casting of the pattern appeared to be uniform across the collagen surface when observed with SEM, and the patterning did not affect the macroscopic appearance of the films (). AFM was used to compare the topography on the grated PET film to the cast collagen. While the PET film had an average groove depth of 191 ± 5 nm (n = 20 grooves), no discernible pattern in the topography of the collagen surfaces was detectable (). Collagen fibril diameters, as measured from the SEM micrographs (S1), were approximately 74.9 ± 22.2 nm (average ± SD, n = 3 504 fibrils).
Figure 1. Characterization of the collagen films. Under visual inspection the films were smooth and transparent when wetted, without any difference between the grooved and flat surfaces. Films were placed on glass coverslips for photography (a). Scanning electron microscopy of the patterned and flat collagen films. Arrow indicates the direction of the grooves SB = 10 µm (b). Mean patterned collagen film transparency across the visible light spectrum. SD is shown with the dashed line. Results are representative of five replicates (c). Atomic force micrographs of grated PET surface and patterned collagen film. Height profiles taken along white lines for corresponding images are shown. SB = 3 (d).
Orientation and viability in 2D culture
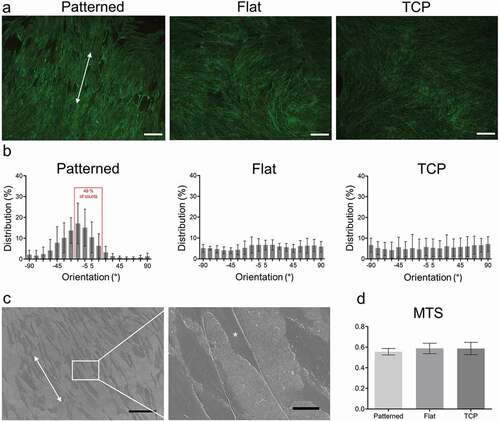
Cell orientation was approximated by measuring the orientation of F-actin fibers. On the patterned surfaces 49% of the cells were aligned within ± 15° of an axis parallel to the groove direction, while no preferential orientation could be discerned on the flat collagen or TCP surfaces ( b). Since the grooved pattern could not be seen under light microscopy, SEM was done on patterned surfaces with cells on them to show the correlation between the pattern direction and cell orientation (). The cell viability of keratocytes in 2D culture was equal between the collagen films and TCP after 7 days of culture ().
Figure 2. Cell orientation on the patterned films and cell viability. Actin staining of keratocytes cultured on patterned, flat and TCP. SB = 100 μm (a). Distribution of mean actin fiber orientation angles after seven days of culture. Results are representative of seven biological repeats (b). Representative scanning electron micrograph of patterned collagen surface. Arrows indicate the orientation of the grooves and asterisk indicates a cell. SB = 100 μm (left) and 15 μm (right) (c). MTS of patterned, flat and TCP after seven days of culture. Results represent six biological replicates (d). Results are shown as average ± SD.
Relative mRNA expression in 2D culture
mRNA expression was studied after 3 days of culture on all three culture surfaces: patterned collagen film, flat collagen film, and TCP. During the culture, cells were either maintained as keratocytes or differentiated toward fibroblast or myofibroblast lineages as described in the methods section.Citation24–27 Expression of ALDH1 was significantly increased for keratocytes in the TCP group when compared to both flat and patterned collagen films (). However, ALDH3 was significantly lower on TCP when compared to flat collagen film (). Lumican, ALDH1, ALDH3, and α-SMA expressions for fibroblasts were significantly lower in the TCP group when compared to flat and patterned collagen films (). Similarly, the lumican expression was significantly lower for myofibroblasts in the TCP group when compared to flat and patterned collagen films, but conversely ALDH1 was significantly higher in the TCP group in comparison to flat and patterned collagen films ().
Figure 3. Relative mRNA expression of keratocyte markers. Relative mRNA expression in maintained keratocytes (a), keratocytes differentiated into fibroblasts (b), and keratocytes differentiated into myofibroblasts (c). The results are shown as average ± SD from six biological replicates. * P < 0.05.
Protein expression
To assess the overall expression of relevant structural components, proteins were extracted for Western blot analysis. The quantity of α-SMA was higher for the myofibroblasts than for the keratocytes or fibroblasts on the collagen surfaces. Furthermore, this difference could only be seen for cells cultured on the collagen films and not on TCP (, b). The amount of produced lumican was comparable between all groups and culture conditions (, c).
Figure 4. Protein expression of keratocyte markers. The expression levels of α-SMA and Lumican were normalized to Actin (a). α-SMA (b) and Lumican (c) expressions were compared between different phenotypes. The results are shown as average ± SD from three biological replicates. * P < 0.05.
3D culture on stacked films
Patterned films were perpendicularly stacked inside a well-plate insert to create the 3D model. Even though the films were not deliberately attached to each other by any special mechanical or chemical means, they remained together when manipulated at the end of the experiment (). Cell viability was assessed after 4 days of culture, and approximately 86 ± 7% (average ± SD, n = 5) of the cells were alive (). Confocal microscopy of the films revealed that the cells retain their ability to orient themselves along the pattern even through a prolonged culture time of 2 weeks (). The cell density at top, middle, and bottom layers were measured to be approximately 65,000 ± 17,000, 47,000 ± 12,000, and 57,000 ± 4,000 cells/cmCitation2 (average ± SD; n = 5), respectively.
Figure 5. Representations of three-dimensional cell culture. Schematic representation of stacked films and the conical insert that they were maintained in (a). Representative image of live/dead cell viability assay, in which live cells are shown as green and dead cells as red. SB = 100 µm. Images were obtained from five biological replicates. (b). Representation of individual layers stained for F-actin (green), where c´, c´´ and c´´´ are the top, middle and bottom layers, respectively. C´´´´ indicates the orthogonal projection of the stack. SB = 100 µm. Images were obtained from three biological replicates (c).
Discussion
In this work, we created a novel collagen film-based scaffold for culturing and guiding keratocytes in 3D, mimicking the corneal stroma from a cellular perspective. Fabrication of a representative corneal model would help in studying the pathophysiological mechanisms of eye wound healing and scar formation in vitro. In the future, this kind of research could mitigate or prevent the loss of eyesight in patients with corneal injuries. So far, more effort has been focused in studies on the epithelium of the cornea and much less on the stroma, while often both are damaged. At the moment, major hurdles to overcome in creating a stroma model, are the anisotropy of the extracellular matrix and the correct induction of the repair phenotype of keratocytes.Citation30 There are many material alternatives to make viable tissue constructs, but as approximately 90% of the cornea is made up of collagen, it makes sense to use it as the basis of the model.Citation15,Citation31–33 So far, the methods used for the orthogonal orientation of collagen in the stromal lamellae are complicated and inaccessible to many researchers.Citation34,Citation35 We believe that the model of our study adds to the existing 3D corneal in vitro models since itconsists of collagen, and the cells are perpendicularly aligned in multilayers, similar to the in vivo condition.
Grated PET film was used as a mold for collagen during vitrification, and after cross-linking the films were robust, flexible, and easy to manipulate. The transparency of the films fell short of a native cornea and that of our previous silk-based model but still reached 33–90% transparency of the native cornea.Citation36 This slightly lower transparency could, at least in part, be explained by the random orientation and low spacing between the collagen fibrils in the gel, in comparison to the collagen fibrils natively found in the corneal stroma.Citation1,Citation24,Citation37,Citation38
The template films were manufactured using a holographic grating. The process leads to a sinusoidal groove profile with symmetrical peaks and troughs, which was confirmed by AFM measurements. However, we could not measure a similar topography on the collagen surfaces. It is possible that the collagen surface relaxed during the sample preparation so much that the impressed grooves were no longer distinguishable from the collagen fibers. While often micrometer-scale topographies are used for cell guidance by limiting the cells’ ability to traverse ridges,Citation39 nanotopographies have been shown to be enough for cell orientation guidance through contact guidance.Citation40 The porosity of the surface may mitigate the contact guidance effect of the grooves, which at least in part may explain the wide spectrum of actin fiber orientations. It is also worth noting that cells can have a narrower distribution of orientations along the grooves than the actin fibers.Citation41 Nonetheless, the observations from the SEM micrographs and actin fiber orientation analyses support each other in that the grooved pattern leads to a good level of orientation along the grooves.
The collagen films did not affect the viability of keratocytes in either 2D or 3D cultures, and the cells populated the films thoroughly. The morphology of the cells appeared to be different in the lower layers in comparison to the uppermost layer. In the upper layer, the cells had a more spindle-like morphology similar to keratocytes grown on TCP.Citation42 The cells in the lower layers had developed thin processes, reminiscent of the stellate morphology of keratocytes in vivo.Citation43 Additionally, the lower cell numbers in the bottom layers in comparison to the topmost layer would be in line with the finding that keratocytes return to the more quiescent state that they are observed to have in vivo and when embedded in collagen matrices.Citation44
Keratocytes stay quiescent when cultured in serum-free conditions, but they can be induced to proliferate when supplemented with FBS. However, the addition of FBS also drives the phenotype to a fibroblast lineage. It has been suggested that keratocytes can both proliferate and maintain phenotype in the presence of a relatively high concentration of FBS if they are cultured on collagen vitrigels.Citation45 This was also the case in our model, based on the fact that the lumican protein expression did not differ between the different FBS concentrations in the patterned collagen films, although the same phenomenon was seen in TCP culture conditions. It is known that keratocytes grown on flat surfaces have cortical F-actin organization and lack stress fibers.Citation43 However, keratocytes cultured on microscale grooves can express stress fibers along the orientation of the grooves, appearing morphologically similar to fibroblasts while otherwise maintaining their keratocyte phenotype.Citation42,Citation46 The gene expression data suggest that the cells grown in 10% FBS on the collagen films are more keratocyte-like than their counterparts grown on TCP. Cells grown in 10% FBS express comparatively high amounts of lumican and ALDH on the flat and patterned collagen films as compared to on TCP, whereas cells cultured in 2% FBS express comparative amounts of these genes on all surface types. It thus seems as if the difference in phenotype between cells grown on collagen compared to those grown on TCP becomes evident only when the cells are grown in higher concentrations of FBS. The myofibroblasts grown on the collagen films appear to express a similar amount of keratocyte markers as their counterparts on TCP, which is further supported by the protein expression.
Linear grooves have been shown to enhance the expression of keratocyte markers and are often linked to the orientation and elongation of the cell body along the grooves.Citation42,Citation47 Hence, in the present study, it was surprising to see that, although we could witness changes in morphology, the gene expression was comparable between the cells grown on flat and patterned collagen when cultured in 2% FBS. Filopodia have been shown to form more stable contacts with a surface feature when the contact angles are acute and when the topographic shapes are parallel to the direction of the filopodia.Citation48 It could be that the sinusoidal profile of the grooves is enough to guide the morphology through easier formation of filopodia and subsequent lamellipodia, but that they are not enough to affect the phenotype in a reliable manner.Citation49
Our model harbors advantages in comparison to some other 3D models in the sense that it is based on collagen with multiple layers of perpendicularly arranged cells, mimicking in vivo conditions. 3D bioprinting can be used to align collagen and cells if the shear forces during printing are adjusted appropriately. However, this method still leads to relatively thick sections.Citation50 Using electrospinning, collagen fiber orientation—and subsequent cell alignment—can be achieved with thin lamellae, but with the drawback that it is a complicated method that requires specialized equipment.Citation51,Citation52 Our model is both affordable and easily reproducible, and it could serve as a good platform for further development of systems for studies of specific corneal injuries. Since the epithelium does in part influence the repair phenotype of the keratocytes in a wound healing, the addition of an epithelial layer would be needed for a more comprehensive model. With this model, adding layers to increase its complexity and similarity to the native cornea is feasible. Furthermore, the improved morphology of the keratocytes in the bottom layers of the 3D model may provide an interesting new path for exploring keratocyte phenotype maintenance.
In the present study, a collagen film-based tissue model with a grooved topography was developed. The model supports stromal cells and guides the cell orientation in individual layers similarly to a native cornea while also maintaining a more keratocyte-like phenotype. Patterned collagen vitrigels have the potential to be a rapidly reproducible culture system that is highly accessible, without requiring specialized equipment. The realization of this as a fully representative corneal model, however, requires the addition of other corneal elements.
Acknowledgments
The authors thank Assoc. Prof. Paul Kingham for facilitating our fluorescence light microscopy needs and Ass. Prof. Marta Bally for her consultancy and expertise with atomic force microscopy. We acknowledge the Biochemical Imaging Center at Umeå University and the National Microscopy Infrastructure, NMI (VR-RFI 2016-00968) for providing assistance in microscopy. The authors also thank Dr Maria Brohlin, Dr Mona Lindström, Ms Randi Elstad, and Dr Berit Byström for help in providing the donated corneas from the biobank.
Disclosure statement
The authors do not declare any potential conflicts of interest regarding the research, authorship, or publication of this article.
Additional information
Funding
References
- Meek KM, Knupp C. Corneal structure and transparency. Prog Retin Eye Res. 2015;49:1–16.doi:https://doi.org/10.1016/j.preteyeres.2015.07.001.
- Chen S, Mienaltowski MJ, Birk DE. Regulation of corneal stroma extracellular matrix assembly. Exp Eye Res. 2015;133:69–80.doi:https://doi.org/10.1016/j.exer.2014.08.001.
- Svensson L, Aszódi A, Reinholt FP, Fässler R, Heinegård D, Oldberg Å. Fibromodulin-null mice have abnormal collagen fibrils, tissue organization, and altered lumican deposition in tendon. J Biol Chem. 1999;274(14):9636–9647.doi:https://doi.org/10.1074/jbc.274.14.9636.
- Dunlevy JR, Neame PJ, Vergnes J-P, Hassell JR. Identification of then-linked oligosaccharide sites in chick corneal lumican and keratocan that receive keratan sulfate. J Biol Chem. 1998;273(16):9615–9621.doi:https://doi.org/10.1074/jbc.273.16.9615.
- Chen S, Birk DE. Focus on molecules: decorin. Exp Eye Res. 2011;92(6):444–445.doi:https://doi.org/10.1016/j.exer.2010.05.008.
- Guo C, Kaufman LJ. Flow and magnetic field induced collagen alignment. Biomaterials. 2007;28(6):1105–1114.doi:https://doi.org/10.1016/j.biomaterials.2006.10.010.
- Fini ME, Stramer BM. How the cornea heals: cornea-specific repair mechanisms affecting surgical outcomes. Cornea. 2005;24(8 Suppl):S2–s11.doi:https://doi.org/10.1097/01.ico.0000178743.06340.2c.
- West-Mays JA, Dwivedi DJ. The keratocyte: corneal stromal cell with variable repair phenotypes. Int J Biochem Cell Biol. 2006;38(10):1625–1631.doi:https://doi.org/10.1016/j.biocel.2006.03.010.
- Chaurasia SS, Kaur H, de Medeiros FW, Smith SD, Wilson SE. Reprint of “Dynamics of the expression of intermediate filaments vimentin and desmin during myofibroblast differentiation after corneal injury”. Exp Eye Res. 2009;89(4):590–596.doi:https://doi.org/10.1016/S0014-4835(09)00247-4.
- Jester JV, Petroll WM, Barry PA, Cavanagh HD. Expression of alpha-smooth muscle (alpha-sm) actin during corneal stromal wound healing. Invest Ophthalmol Vis Sci. 1995;36(5):809–819.
- Berryhill BL, Kader R, Kane B, Birk DE, Teng J, Hassell AR. Partial restoration of the keratocyte phenotype to bovine keratocytes made fibroblastic by serum. Invest Ophthalmol Vis Sci. 2002;43(11):3416–3421.
- Kumar P, Pandit A, Zeugolis DI. Progress in corneal stromal repair: from tissue grafts and biomaterials to modular supramolecular tissue-like assemblies. Adv Mater. 2016;28(27):5381–5399.doi:https://doi.org/10.1002/adma.201503986.
- Ghezzi CE, Rnjak-Kovacina J, Kaplan DL. Corneal tissue engineering: recent advances and future perspectives. Tissue Eng Part B Rev. 2015;21(3):278–287.doi:https://doi.org/10.1089/ten.teb.2014.0397.
- Chen J, Zhang W, Kelk P, Backman LJ, Danielson P. Substance p and patterned silk biomaterial stimulate periodontal ligament stem cells to form corneal stroma in a bioengineered three-dimensional model. Stem Cell Res Ther. 2017;8(1):260.doi:https://doi.org/10.1186/s13287-017-0715-y.
- Gil ES, Mandal BB, Park SH, Marchant JK, Omenetto FG, Kaplan DL. Helicoidal multi-lamellar features of rgd-functionalized silk biomaterials for corneal tissue engineering. Biomaterials. 2010;31(34):8953–8963.doi:https://doi.org/10.1016/j.biomaterials.2010.08.017.
- McIntosh Ambrose W, Salahuddin A, So S, Ng S, Ponce Marquez S, Takezawa T, Schein O, Elisseeff J. Collagen vitrigel membranes for the in vitro reconstruction of separate corneal epithelial, stromal, and endothelial cell layers. J Biomed Mater Res B Appl Biomater. 2009;90(2):818–831.doi:https://doi.org/10.1002/jbm.b.31351.
- Cui Z, Zeng Q, Liu S, Zhang Y, Zhu D, Guo Y, Xie M, Mathew S, Cai D, Zhang J et al. Cell-laden and orthogonal-multilayer tissue-engineered corneal stroma induced by a mechanical collagen microenvironment and transplantation in a rabbit model. Acta Biomater. 2018;75:183–199.
- Wang JH, Jia F, Gilbert TW, Woo SL. Cell orientation determines the alignment of cell-produced collagenous matrix. J Biomech. 2003;36(1):97–102.doi:https://doi.org/10.1016/S0021-9290(02)00233-6.
- Muthusubramaniam L, Peng L, Zaitseva T, Paukshto M, Martin GR, Desai TA. Collagen fibril diameter and alignment promote the quiescent keratocyte phenotype. J Biomed Mater Res A. 2012;100(3):613–621.doi:https://doi.org/10.1002/jbm.a.33284.
- Sloniecka M, Le Roux S, Boman P, Bystrom B, Zhou Q, Danielson P. Expression profiles of neuropeptides, neurotransmitters, and their receptors in human keratocytes in vitro and in situ. PLoS One. 2015;10(7):e0134157.doi:https://doi.org/10.1371/journal.pone.0134157.
- Sloniecka M, Le Roux S, Zhou Q, Danielson P. Substance p enhances keratocyte migration and neutrophil recruitment through interleukin-8. Mol Pharmacol. 2016;89(2):215–225.doi:https://doi.org/10.1124/mol.115.101014.
- Karamichos D, Rich CB, Zareian R, Hutcheon AE, Ruberti JW, Trinkaus-Randall V, Zieske JD. Tgf-beta3 stimulates stromal matrix assembly by human corneal keratocyte-like cells. Invest Ophthalmol Vis Sci. 2013;54(10):6612–6619.doi:https://doi.org/10.1167/iovs.13-12861.
- Jester JV, Huang J, Fisher S, Spiekerman J, Chang JH, Wright WE, Shay JW. Myofibroblast differentiation of normal human keratocytes and htert, extended-life human corneal fibroblasts. Invest Ophthalmol Vis Sci. 2003;44(5):1850–1858.doi:https://doi.org/10.1167/iovs.02-0973.
- Zhang W, Chen J, Backman LJ, Malm AD, Danielson P. Surface topography and mechanical strain promote keratocyte phenotype and extracellular matrix formation in a biomimetic 3d corneal model. Adv Healthc Mater. 2017;6(5):1601238.doi:https://doi.org/10.1002/adhm.201601238.
- Jester JV, Ho-Chang J. Modulation of cultured corneal keratocyte phenotype by growth factors/cytokines control in vitro contractility and extracellular matrix contraction. Exp Eye Res. 2003;77(5):581–592.doi:https://doi.org/10.1016/S0014-4835(03)00188-X.
- Musselmann K, Kane BP, Alexandrou B, Hassell JR. Igf-ii is present in bovine corneal stroma and activates keratocytes to proliferate in vitro. Exp Eye Res. 2008;86(3):506–511.doi:https://doi.org/10.1016/j.exer.2007.12.004.
- Sloniecka M, Danielson P. Acetylcholine decreases formation of myofibroblasts and excessive extracellular matrix production in an in vitro human corneal fibrosis model. J Cell Mol Med. 2020;24(8):4850–4862.doi:https://doi.org/10.1111/jcmm.15168.
- Schindelin J, Arganda-Carreras I, Frise E, Kaynig V, Longair M, Pietzsch T, Preibisch S, Rueden C, Saalfeld S, Schmid B et al. Fiji: an open-source platform for biological-image analysis. Nat Methods. 2012;9(7):676–682.doi:https://doi.org/10.1038/nmeth.2019.
- Glaser M, Schnauß J, Tschirner T, Schmidt BUS, Moebius-Winkler M, Käs JA, Smith DM. Self-assembly of hierarchically ordered structures in DNA nanotube systems. New J Phys. 2016;18(5):055001.doi:https://doi.org/10.1088/1367-2630/18/5/055001.
- Myrna KE, Pot SA, Murphy CJ. Meet the corneal myofibroblast: the role of myofibroblast transformation in corneal wound healing and pathology. Vet Ophthalmol. 2009;12(Suppl 1):25–27.doi:https://doi.org/10.1111/j.1463-5224.2009.00742.x.
- Tonsomboon K, Oyen ML. Composite electrospun gelatin fiber-alginate gel scaffolds for mechanically robust tissue engineered cornea. J Mech Behav Biomed Mater. 2013;21:185–194.doi:https://doi.org/10.1016/j.jmbbm.2013.03.001.
- Wang HY, Wei RH, Zhao SZ. Evaluation of corneal cell growth on tissue engineering materials as artificial cornea scaffolds. Int J Ophthalmol. 2013;6(6):873–878.doi:https://doi.org/10.3980/j.2222-3959.2013.06.23.
- Zimmermann DR, Fischer RW, Winterhalter KH, Witmer R, Vaughan L. Comparative studies of collagens in normal and keratoconus corneas. Exp Eye Res. 1988;46(3):431–442.doi:https://doi.org/10.1016/S0014-4835(88)80031-9.
- Torbet J, Malbouyres M, Builles N, Justin V, Roulet M, Damour O, Oldberg A, Ruggiero F, Hulmes DJ. Orthogonal scaffold of magnetically aligned collagen lamellae for corneal stroma reconstruction. Biomaterials. 2007;28(29):4268–4276.doi:https://doi.org/10.1016/j.biomaterials.2007.05.024.
- Doughty MJ, Seabert W, Bergmanson JPG, Blocker Y. A descriptive and quantitative study of the keratocytes of the corneal stroma of albino rabbits using transmission electron microscopy. Tissue Cell. 2001;33(4):408–422.doi:https://doi.org/10.1054/tice.2001.0195.
- Boettner EA, Wolter JR. Transmission of the ocular media. Invest Ophthalmol. 1962;1(6):776–783.
- Freegard TJ. The physical basis of transparency of the normal cornea. Eye (Lond). 1997;11(Pt 4):465–471.doi:https://doi.org/10.1038/eye.1997.127.
- Meek KM. Corneal collagen-its role in maintaining corneal shape and transparency. Biophys Rev. 2009;1(2):83–93.doi:https://doi.org/10.1007/s12551-009-0011-x.
- Martinez E, Engel E, Planell JA, Samitier J. Effects of artificial micro- and nano-structured surfaces on cell behaviour. Ann Anat. 2009;191(1):126–135.doi:https://doi.org/10.1016/j.aanat.2008.05.006.
- Clark P, Connolly P, Curtis AS, Dow JA, Wilkinson CD. Cell guidance by ultrafine topography in vitro. J Cell Sci. 1991;99(Pt 1):73–77.doi:https://doi.org/10.1242/jcs.99.1.73.
- Sales A, Holle AW, Kemkemer R. Initial contact guidance during cell spreading is contractility-independent. Soft Matter. 2017;13(30):5158–5167.doi:https://doi.org/10.1039/C6SM02685K.
- Bhattacharjee P, Cavanagh BL, Ahearne M. Effect of substrate topography on the regulation of human corneal stromal cells. Colloids Surf B Biointerfaces. 2020;190:110971.doi:https://doi.org/10.1016/j.colsurfb.2020.110971.
- Lakshman N, Kim A, Petroll WM. Characterization of corneal keratocyte morphology and mechanical activity within 3-d collagen matrices. Exp Eye Res. 2010;90(2):350–359.doi:https://doi.org/10.1016/j.exer.2009.11.016.
- Nishida T. Commanding roles of keratocytes in health and disease. Cornea. 2010;29(11):S3–S6.doi:https://doi.org/10.1097/ICO.0b013e3181f2d578.
- Guo Q, Phillip JM, Majumdar S, Wu PH, Chen J, Calderon-Colon X, Schein O, Smith BJ, Trexler MM, Wirtz D et al. Modulation of keratocyte phenotype by collagen fibril nanoarchitecture in membranes for corneal repair. Biomaterials. 2013;34(37):9365–9372.doi:https://doi.org/10.1016/j.biomaterials.2013.08.061.
- Jester JV, Barry PA, Lind GJ, Petroll WM, Garana R, Cavanagh HD. Corneal keratocytes: in situ and in vitro organization of cytoskeletal contractile proteins. Invest Ophthalmol Vis Sci. 1994;35(2):730–743.
- Cutiongco MFA, Jensen BS, Reynolds PM, Gadegaard N. Predicting gene expression using morphological cell responses to nanotopography. Nat Commun. 2020;11(1):1384.doi:https://doi.org/10.1038/s41467-020-15114-1.
- Albuschies J, Vogel V. The role of filopodia in the recognition of nanotopographies. Sci Rep. 2013;3(1):1658.doi:https://doi.org/10.1038/srep01658.
- Bhattacharjee P, Cavanagh BL, Ahearne M. Influence of micropatterned substrates on keratocyte phenotype. Sci Rep. 2020;10(1):6679.doi:https://doi.org/10.1038/s41598-020-62640-5.
- Kim H, Jang J, Park J, Lee K-P, Lee S, Lee D-M, Kim KH, Kim HK, Cho D-W. Shear-induced alignment of collagen fibrils using 3d cell printing for corneal stroma tissue engineering. Biofabrication. 2019;11(3):035017.doi:https://doi.org/10.1088/1758-5090/ab1a8b.
- Wakuda Y, Nishimoto S, Suye S-I, Fujita S. Native collagen hydrogel nanofibres with anisotropic structure using core-shell electrospinning. Sci Rep. 2018;8(1):6248.doi:https://doi.org/10.1038/s41598-018-24700-9.
- Denchai A, Tartarini D, Mele E. Cellular response to surface morphology: electrospinning and computational modeling. Front Bioeng Biotechnol. 2018;6(155). doi:https://doi.org/10.3389/fbioe.2018.00155.