
 ?Mathematical formulae have been encoded as MathML and are displayed in this HTML version using MathJax in order to improve their display. Uncheck the box to turn MathJax off. This feature requires Javascript. Click on a formula to zoom.
Abstract
Objective
Giant cell arteritis (GCA) is a treatable, but potentially sight- and life-threatening form of systemic vasculitis. Prompt and correct diagnosis is therefore important. Temporal artery biopsy (TAB) is the gold standard for diagnosing GCA, but is associated with risks. There is no reliable non-invasive technique for the diagnosis of GCA. Ultrasound centre frequency shift (CFS) is a novel technique that uses high-frequency ultrasound and the analysis of the centre frequency of the ultrasound pulse, which is dependent on the size of the microstructures in the tissue. This provides an objective measure of the scattering microstructures in the tissue, and thus has the potential to discriminate changes due to disease. The aim of this study was to assess ultrasound CFS as a means of discriminating arteries affected by GCA from healthy arteries.
Method
TAB specimens from 68 subjects, 53 female and 15 male, with a mean age of 73 (range 52–87) years, with suspected GCA were examined using ultrasound ex vivo and the CFS was analysed. The temporal arteries were then examined histopathologically.
Results
Histopathological examination revealed that 25 of the 68 biopsies of the temporal artery showed inflammatory changes in the vessel wall compatible with GCA. The ultrasound CFS decreased less in TAB-positive than in TAB-negative temporal arteries (p < 0.05).
Conclusions
This proof-of-principle study indicates that ultrasound CFS has the potential to detect GCA in temporal arteries. Further technical development will be needed before in vivo examination can be performed and the clinical applicability can be assessed.
Giant cell arteritis (GCA), also known as temporal arteritis, is a potentially sight-threatening large-vessel disease; typical symptoms being headache, jaw claudication, fever, fatigue, night sweats, and weight loss (Citation1–4). Early diagnosis and immunosuppressant treatment can prevent sudden complications such as irreversible blindness and cerebrovascular events (Citation2, Citation3). GCA is a heterogeneous disease with more than one clinical picture (Citation5) and the spectrum of GCA encompasses overlapping phenotypes (Citation2), which may present a clinical challenge. GCA is generally regarded as cranial arteritis (C-GCA), but may also present as large-vessel vasculitis (LVV-GCA) or single-organ arteritis (Citation6, Citation7). However, cranial arteries are thought often to be involved (Citation8, Citation9)
Temporal artery biopsy (TAB) is currently the gold standard for the diagnosis of GCA, which entails surgical excision of a segment of the temporal artery, followed by histopathological examination to identify inflammatory lesions in the vessel wall. Positive findings have almost 100% specificity, whereas negative findings have a lower sensitivity (Citation10), with a high false-negative rate of up to 15–30% (Citation11–13), which may be due to the segmental nature of the disease (Citation14, Citation15), short biopsy specimens, or long-duration steroid treatment prior to biopsy (Citation16, Citation17). Furthermore, TAB is associated with several risks, such as injury to the facial nerve and the trigeminal nerve, haemorrhage, wound infection, and scarring (Citation18–20). A non-invasive technique for the diagnosis of GCA would therefore be of considerable benefit.
Previous studies have employed colour Doppler ultrasonography for the non-invasive diagnosis of GCA, in which the imaging capabilities of B-mode ultrasonography are combined with the flow-velocity determination of Doppler ultrasonography. In general, the diagnostic accuracy of colour Doppler ultrasonography has been disappointing, probably because it is highly dependent on the expertise of the operator (Citation21–23). Colour Doppler examination has shown good specificity, but lower sensitivity (Citation24–28), and therefore it cannot replace surgical biopsy and histopathological examination (Citation6, Citation10, Citation18, Citation24). Other non-invasive techniques have also been investigated, such as magnetic resonance imaging (MRI) and [18F]fluorodeoxyglucose-positron emission tomography (FDG-PET), but these have also shown inadequate specificity and sensitivity in diagnosing C-GCA (Citation6). There is, therefore, currently no non-invasive method that can replace surgical biopsy for the diagnosis of C-GCA.
In 2016, we presented a new non-invasive ultrasound method based on the centre frequency shift (CFS) of the ultrasound radio frequency data in the examination of the carotid artery (Citation29). CFS could be used to identify lesion components of the plaque contributing to plaque vulnerability and the risk of vascular events such as stroke. Ultrasound CFS uses the fact that different tissue microstructures (primarily the size of the scatterers) affect the centre frequency of the backscattered pulses (Citation30). With knowledge of the transducer and pulse characteristics, the CFS can provide an objective measure of tissue microstructure, free from the interobserver variability that hampers traditional clinical ultrasound imaging. Quantitative spectral analysis of ultrasound data has shown promising results in the characterization of a wide range of tissues, including breast cancer (Citation31). However, these methods require the investigation of a larger area of tissue. The ultrasound CFS method, on the other hand, does not use frequency spectra, enabling the analysis of small tissue samples, such as the temporal artery.
To the best of our knowledge, the hypothesis that ultrasound CFS can be used to diagnose GCA has not yet been tested. The aim of the present study was thus to investigate the feasibility of using ultrasound CFS to identify inflammatory changes due to GCA in surgical biopsies of the temporal artery, to pave the way for future non-invasive examination in vivo.
Method
Subjects
Patients suspected of having GCA, who had already been referred for TAB in the routine clinical setting at the Department of Ophthalmology at Skåne University Hospital, in Lund, Sweden, from October 2017 to October 2020, were enrolled in the study. The surgically excised temporal artery specimens were examined with ultrasound CFS ex vivo, before being sent for histopathological examination.
Seventy-eight patients suspected of having GCA undergoing TAB were assessed for eligibility, nine of whom were excluded owing to uncertainty in the presence of inflammatory changes in the vessel wall at histopathological assessment, or inappropriate biopsy specimen, i.e. vein instead of artery, and one who did not wish to continue participating in the study, resulting in 68 patients being included in the study. Participant enrolment is illustrated in , and patient characteristics are given in .
Figure 1. Participant enrolment.
Table 1. Patient characteristics.
Ultrasound scanning procedure
After TAB under local anaesthesia, according to local practice, the samples were transported to a nearby laboratory for ultrasound scanning. The vessel lumen was first rinsed with balanced saline solution (BSS), using a hypodermic needle and a syringe. Surgical threads were sewn to each end of the biopsy, and it was then placed in a 100 × 70 × 50 mm3 Perspex container filled with BSS, with a sheet of ultrasound-attenuating material in the bottom. The biopsy was held in place by the surgical threads.
The TABs were scanned using a Vevo 3100 imaging system (FUJIFILM VisualSonics, Toronto, ON, Canada) equipped with an MX400 ultrasound linear array transducer, which has a centre frequency of 30 MHz. The transducer was fixed to an adjustable arm, and the holder was driven by a stepper motor to enable three-dimensional (3D) scanning (VisualSonics, Toronto, ON, Canada). The scanning set-up is illustrated in ).
Figure 2. Illustration of the ultrasound scanning set-up used to examine the temporal artery biopsy (TAB). (A) The sample is mounted in a Perspex container filled with balanced saline solution. The artery is then scanned with an ultrasound transducer that is attached to an adjustable arm using a linear stepper motor that moves transversely with a step size of 0.5 mm. (B) The scanning procedure results in a stack of 2D ultrasound images containing B-mode images (short pulse) interleaved with images generated using colour Doppler mode (long pulse). (C) A 3D image is then reconstructed from the slices of the 2D images, and the mean centre frequency shift (CFS) is calculated from the pixels from the whole specimen.
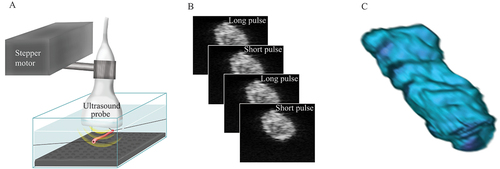
Three-dimensional scans were made by moving the transducer transversely with a step size of 0.5 mm, resulting in a 3D stack of data (). A combined B-mode and colour Doppler mode was used to obtain frequency information from two different types of ultrasound pulses. A short pulse was generated by the B-mode and then interleaved with a second, longer pulse generated by the colour Doppler mode. Note that the (raw) colour Doppler images were used to obtain conventional images and not flow information. The reason for this approach is explained in the next subsection. Radiofrequency data were analysed with regard to CFS on a computer using MATLAB® (The MathWorks, Natick, MA, USA).
Centre frequency shift analysis
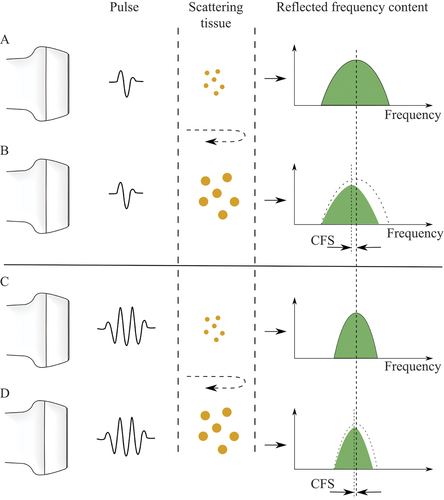
The tissue-related changes in the centre frequency of the ultrasound signal were analysed when comparing the frequency content of the transmitted pulse of ultrasound to that of the backscattered pulse. The CFS of the radiofrequency data was analysed as described previously (Citation29, Citation30). The principle of CFS is illustrated in .
Figure 3. Illustration of the principle of centre frequency shift (CFS) due to differences in the size of the scatterers in the tissue and pulse wavelength. An ultrasound pulse is transmitted into the tissue, where it is reflected, and the signal is recorded by the transducer. The frequency distribution of the backscattered ultrasound will depend on the size of the scatterers, in relation to the wavelengths, i.e. frequency content, of the pulse. Small scatterers (A and C) will return a greater proportion of high frequencies than large scatterers (B and D). Furthermore, short pulses (A and B) contain more frequencies, leading to a greater CFS than with longer pulses (C and D). The shift in the backscattered centre frequency depends on the size of the microstructures in the tissue, providing an objective measure of the differences between healthy and diseased tissues.
When analysing small areas of tissue where there is little information, variations in the frequency of the signal (caused by interference, not related to the tissue) have a higher impact and could degrade the result. In this study, a dual-pulse approach was used to reduce the impact of this background signal. Two different pulses were transmitted through the same tissue segment, with the same nominal centre frequency, but with different pulse lengths. Both pulses undergo similar interference effects, i.e. give the same background signal, but the longer pulses have a small CFS response and are thus less tissue dependent. By subtracting one signal from the other, the background signal could be removed.
The colour Doppler mode was used to effectively interleave several long pulses with short pulses. The short pulses are used for B-mode images and, normally, the images created by the long pulses are used to calculate flow. However, in this study no flow information was calculated and the images from both pulses were therefore directly comparable.
A reference centre frequency of 25.6 MHz, i.e. the actual central frequency for the transducer, was used for both the long and short pulses when calculating the shift in centre frequency. The reference was measured in a separate acquisition using the same measurement set-up, except that the tissue sample was replaced with a flat surface that returned the transmitted pulse without any interaction with tissue.
After removing the effects of interference seen in the long pulse, the CFS was defined as:
where CFshort and CFlong are the centre frequencies of the short and long pulse, R is the reference frequency (25.6 MHz, as described above), and N is the number of pixels in the sample. Hence, CFS (%) is the normalized average difference in centre frequency of the short and the long pulses.
A total average of CFS (%) was calculated from the stack of 3D scanned data obtained from each artery for the group with positive biopsies and the group with negative biopsies. The difference in the average CFS between the TAB-positive and the TAB-negative biopsies was then determined.
Histopathological examination
After ultrasound scanning, the TAB specimens were placed in formalin and sent to the pathology laboratory for sectioning and histological analysis. The biopsies were cut into thin 3 μm sections and then stained with haematoxylin–eosin and elastica van Gieson staining according to a standard protocol. The sections were then examined for signs of inflammation compatible with GCA by different histopathologists.
Statistical analysis
Results are presented as mean values with 95% confidence intervals (CIs). Calculations and statistical analysis were performed using GraphPad Prism 9.0 (GraphPad Software, San Diego, CA, USA). The t-test was used for comparisons between groups. Significance was defined as p < 0.05.
Ethics and consent
This study was approved by the Ethics Committee of Lund University, Sweden. The research adhered to the tenets of the Declaration of Helsinki, as amended in 2008. All the subjects participating in the study were given verbal and written information about the study and the voluntary nature of participation. All subjects gave their informed written consent.
Results
Histopathology
Of the 68 patients included in this study, 25 had biopsies with histopathological signs of GCA (TAB-positive) while 43 biopsies had no signs of GCA (TAB-negative). Typical signs of GCA were infiltration of inflammatory cells (e.g. lymphocytes), multinucleate giant cells, artery lumen reduction, and fragmentation of the internal elastic lamina, the last seen by elastica van Gieson staining. Subjects were classified as TAB positive when the histopathological examination showed clear signs of inflammation compatible with GCA and as TAB negative when there were no signs of inflammation.
Ultrasound CFS
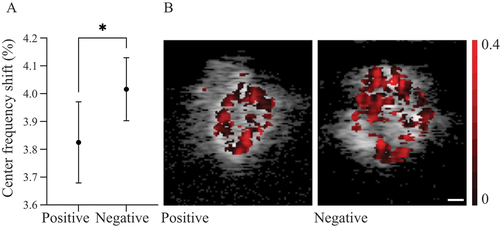
The mean CFS (%) decreased by 3.83 (95% CI 3.68–3.97) in the TAB-positive group, and decreased by 4.02 (95% CI 3.90–4.13) in the TAB-negative group. The difference in CFS between the two groups was significant (p < 0.05) (). Representative examples of CFS images are shown in .
Figure 4. (A) Graph showing the centre frequency shifts (CFS) for temporal artery biopsy TAB-positive and TAB-negative biopsies. Data are presented as mean values with 95% confidence intervals. *Significant difference between the two groups (p < 0.05). (B) Representative examples of CFS images of a TAB-positive (left) and a TAB-negative (right) specimen of the temporal artery. The value of CFS (%) for each pixel is shown as a darker (red) overlay. The scale bar is 0.1 mm.
Discussion
The present study shows that ultrasound CFS can be used to differentiate temporal arteries with GCA from those without GCA. The main advantage of ultrasound CFS is that it is independent of the expertise of the examiner since the frequency distribution obtained is an objective measure and thus without interobserver variability. This is in contrast to traditional clinical ultrasound imaging based on B-mode images such as colour Doppler ultrasonography, which is dependent on the operator’s experience (Citation21, Citation22), and may be affected by the choice of ultrasound window and colour gain. Despite this, colour Doppler ultrasonography has been used extensively for the examination of GCA (Citation24–28). The most common sign for GCA on colour Doppler ultrasonography is a dark halo around the lumen of the temporal artery, called the halo sign, which is thought to be caused by oedema in the artery wall (Citation27, Citation28). According to a meta-analysis in 2010, a unilateral halo sign has a specificity of 91% and sensitivity of 68%, but the specificity is greater when bilateral halo signs are present (Citation24). However, it has been demonstrated that the halo sign can be easily provoked in healthy temporal arteries and can also be missed in diseased temporal arteries when applying inappropriate colour Doppler settings (Citation21). In the TABUL study (Temporal Artery Biopsy vs Ultrasound in Diagnosis of GCA), the aim of which was to determine the diagnostic accuracy of temporal artery colour Doppler ultrasonography in comparison to TAB in the diagnosis of GCA, the specificity and sensitivity of colour Doppler ultrasound were found to be 81% and 54%, respectively (Citation10). All ultrasound examiners in the TABUL study underwent training to standardize the examination. However, no previous experience of vascular ultrasound was required in the TABUL study, indicating that colour Doppler ultrasonography may have been limited by the operator’s experience.
Another common sign used for the diagnosis of GCA using colour Doppler ultrasonography is the so-called compression sign, which Aschwanden et al suggested to be less dependent on the operator’s experience (Citation21). A positive compression sign is defined as visibility of the temporal artery upon transducer-imposed compression of the artery, owing to the stiffness of the inflamed artery wall, as opposed to a negative compression sign, when the artery collapses upon compression and is no longer visible. A follow-up study showed strong interobserver agreement for a positive compression sign, regardless of the operator’s experience (Citation22). However, the compression sign has been found to have a similar sensitivity to the halo sign (Citation21), and the role of colour Doppler ultrasonography in diagnosing GCA has still not been formally established.
Colour Doppler ultrasonography is associated with other limitations. False-positive results are sometimes seen in cases of atherosclerosis (Citation32), and false-negative results are seen in individuals who have periadventitial small-vessel vasculitis or vasa vasorum vasculitis, in contrast to a more classic transmural pattern (Citation33). Indeed, patients with atherosclerosis often appear in the investigation for GCA. In the present study, the patients with negative biopsies for GCA had a higher incidence of risk factors for atherosclerosis (e.g. hypertension and diabetes mellitus), which is probably an effect of these patients being more often subject to investigation as the symptoms may mimic those of GCA (e.g. loss of vision and low pulsatility of the temporal artery on clinical examination). Unfortunately, subgroup analysis of the CFS data was not possible in the present study owing to the limited sample size. The effect of atherosclerosis on CFS may be an important consideration in future studies directed towards clinical implementation.
The clinical advantage of introducing ultrasound CFS as a non-invasive tool for diagnosing GCA would be the replacement of surgical biopsy, thereby avoiding the risks associated with this invasive approach. Since GCA is a treatable, but potentially sight-threatening form of systemic vasculitis, prompt and correct diagnosis is of importance, as early intervention can prevent irreversible blindness and other complications. Ultrasound CFS has a number of advantages as a non-invasive repeatable diagnostic technique for GCA. First, it allows examination of a larger area of the temporal artery than a surgical biopsy. GCA can present with so-called skip lesions (Citation14, Citation15), owing to the segmental nature of the disease, which is probably one of the reasons why biopsy findings can be negative in 15–30% of patients with GCA (Citation11–13). It is therefore necessary for the biopsy to be sufficiently long (Citation34). Furthermore, other vessels involved in GCA, for example, the axillary artery, can be examined with ultrasound CFS, which is not possible by surgical biopsy, thereby increasing the probability of finding inflammatory changes in the arteries. In GCA, the axillary arteries are affected in up to 50% of patients (Citation35, Citation36) and TAB specimens are negative in over half of patients with extracranial GCA (Citation35). In a previous study, DiIorio et al showed that 34.8% of subjects with ultrasound findings suggestive of GCA only had involvement of extracranial vessels (axillary and/or subclavian) (Citation37). In these cases, there is no doubt as to the additional diagnostic benefit of imaging the extracranial arteries.
Secondly, a non-invasive technique would potentially allow the effect of treatment to be monitored over time. This could improve the treatment of GCA, which is currently a clinical challenge. The sensitivity of colour Doppler imaging is significantly reduced within the first week of therapy with corticosteroids (Citation23), and the halo sign, which is thought to be caused by oedema in the artery wall, tends to disappear about 2 weeks after the start of corticosteroid treatment (Citation27). Findings due to signs of inflammation caused by GCA tend to be seen after a longer period histopathologically than with ultrasound. Follow-up studies must be carried out to investigate whether ultrasound CFS can be used to detect the subtle differences in tissue microstructures when treatment has been initiated with corticosteroids.
Thirdly, in contrast to MRI and FDG-PET, ultrasound CFS can be used at the bedside, and is generally well tolerated by patients. Ultrasound CFS can be performed with any ultrasound scanner that also has a Doppler ultrasonography function, to enable the dual-pulse approach described in this study. A software upgrade is required for the analysis of CFS. The technique should thus be widely available at many clinics already using ultrasound.
One limitation of the present study, and with previous studies on GCA, is the difficulty in defining the patient inclusion criteria, since there are no established diagnostic criteria for GCA. Many previous studies have used the American College of Rheumatology (ACR) criteria for GCA, which are based on a combination of clinical signs (Citation38). However, these classification criteria were designed to classify patients into GCA to facilitate epidemiological studies, and cannot be used to reliably confirm inflammatory lesions in the temporal artery (unless the TAB is positive). Therefore, we divided the subjects into those who were TAB positive and those who were TAB negative based on histopathological examination of the temporal artery. The histopathological examination was performed by different histopathologists, which is a limitation, although the biopsies were prepared and examined according to a standard protocol. However, the histopathologists were blinded to the results of the CFS examination.
Another limitation of this study was that the dual-pulse approach, used to remove the background signal, could affect the CFS. A frequency shift will be seen for both the long pulse and the short pulse, but the shift will scale (inversely) with pulse length, and will thus be much smaller for the long pulse. The dual-pulse approach was used to minimize the frequency variation caused by interference and transducer-related effects. However, this approach also removed the frequency shift of the long pulse, which will lead to a small decrease in the estimated CFS. Further studies are needed to investigate this, and we believe that tuning the pulse parameters will lead to improvements in the method.
Although the difference in the CFS signal between the TAB-positive and TAB-negative groups was numerically small, it is a promising result in an ex vivo setting with a non-user-dependent method of analysis. Ultrasound CFS is a novel technique applied to GCA here for the first time. Our aim is to develop the CFS technique to enable non-invasive in vivo examination of temporal arteries and other arteries that may be affected by GCA, such as the axillary artery. Technical development involving the implementation of motion-tracking algorithms will be necessary to remove movement artefacts such as those caused by breathing and arterial motion due to pulsation. Furthermore, the frequency attenuation in tissue above the artery will affect the estimated CFS and must be compensated for. It is hoped that clinical examination of a larger number of patients will enable the determination of a cut-off value allowing discrimination between healthy and diseased arteries.
Conclusion
The results of this study show the potential for using CFS to differentiate between TAB specimens with and without histological signs of GCA. Further technical development is needed to make in vivo examination possible, after which a large clinical trial must be performed to evaluate whether CFS can be used for the diagnosis of GCA.
Acknowledgement
The authors would like to thank Elisabet Englund, senior consultant and associate professor at the Department of Clinical Pathology, Skåne University Hospital, Lund, for her advice and assistance with the histopathological assessments.
Disclosure statement
No potential conflict of interest was reported by the authors.
Additional information
Funding
References
- Rahman W, Rahman FZ. Giant cell (temporal) arteritis: an overview and update. Surv Ophthalmol 2005;50:415–28.
- Dejaco C, Duftner C, Buttgereit F, Matteson EL, Dasgupta B. The spectrum of giant cell arteritis and polymyalgia rheumatica: revisiting the concept of the disease. Rheumatology (Oxford) 2017;56:506–15.
- Saleh M, Turesson C, Englund M, Merkel PA, Mohammad AJ. Visual complications in patients with biopsy-proven giant cell arteritis: a population-based study. J Rheumatol 2016;43:1559–65.
- Soriano A, Muratore F, Pipitone N, Boiardi L, Cimino L, Salvarani C. Visual loss and other cranial ischaemic complications in giant cell arteritis. Nat Rev Rheumatol 2017;13:476–84.
- Klein RG, Hunder GG, Stanson AW, Sheps SG. Large artery involvement in giant cell (temporal) arteritis. Ann Intern Med 1975;83:806–12.
- Buttgereit F, Dejaco C, Matteson EL, Dasgupta B. Polymyalgia rheumatica and giant cell arteritis: a systematic review. JAMA 2016;315:2442–58.
- Grayson PC, Maksimowicz-mckinnon K, Clark TM, Tomasson G, Cuthbertson D, Carette S, et al. Distribution of arterial lesions in Takayasu’s arteritis and giant cell arteritis. Ann Rheum Dis 2012;71:1329–34.
- Bley TA, Weiben O, Uhl M, Vaith P, Schmidt D, Warnatz K, et al. Assessment of the cranial involvement pattern of giant cell arteritis with 3T magnetic resonance imaging. Arthritis Rheum 2005;52:2470–7.
- Wilkinson IM, Russell RW. Arteries of the head and neck in giant cell arteritis. A pathological study to show the pattern of arterial involvement. Arch Neurol 1972;27:378–91.
- Luqmani R, Lee E, Singh S, Gillett M, Schmidt WA, Bradburn M, et al. The role of ultrasound compared to biopsy of temporal arteries in the diagnosis and treatment of giant cell arteritis (TABUL): a diagnostic accuracy and cost-effectiveness study. Health Technol Assess 2016;20:1–238.
- Gonzalez-Gay MA, Garcia-Porrua C, Llorca J, Gonzalez-Louzao C, Rodriguez-Ledo P. Biopsy-negative giant cell arteritis: clinical spectrum and predictive factors for positive temporal artery biopsy. Semin Arthritis Rheum 2001;30:249–56.
- Breuer GS, Nesher R, Nesher G. Negative temporal artery biopsies: eventual diagnoses and features of patients with biopsy-negative giant cell arteritis compared to patients without arteritis. Clin Exp Rheumatol 2008;26:1103–6.
- Grossman C, Ben-Zvi I, Barshack I, Bornstein G. Association between specimen length and diagnostic yield of temporal artery biopsy. Scand J Rheumatol 2017;46:222–5.
- Albert DM, Ruchman MC, Keltner JL. Skip areas in temporal arteritis. Arch Ophthalmol 1976;94:2072–7.
- Klein RG, Campbell RJ, Hunder GG, Carney JA. Skip lesions in temporal arteritis. Mayo Clin Proc 1976;51:504–10.
- Bowling K, Rait J, Atkinson J, Srinivas G. Temporal artery biopsy in the diagnosis of giant cell arteritis: does the end justify the means? Ann Med Surg (London) 2017;20:1–5.
- Jakobsson K, Jacobsson L, Mohammad AJ, Nilsson JA, Warrington K, Matteson EL, et al. The effect of clinical features and glucocorticoids on biopsy findings in giant cell arteritis. BMC Musculoskelet Disord 2016;17:363.
- Borchers AT, Gershwin ME. Giant cell arteritis: a review of classification, pathophysiology, geoepidemiology and treatment. Autoimmun Rev 2012;11:A544–54.
- Gunawardene AR, Chant H. Facial nerve injury during temporal artery biopsy. Ann R Coll Surg Engl 2014;96:257–60.
- Guffey Johnson J, Grossniklaus HE, Margo CE, Foulis P. Frequency of unintended vein and peripheral nerve biopsy with temporal artery biopsy. Arch Ophthalmol 2009;127:703.
- Aschwanden M, Daikeler T, Kesten F, Baldi T, Benz D, Tyndall A, et al. Temporal artery compression sign–a novel ultrasound finding for the diagnosis of giant cell arteritis. Ultraschall Med 2013;34:47–50.
- Aschwanden M, Imfeld S, Staub D, Baldi T, Walker UA, Berger CT, et al. The ultrasound compression sign to diagnose temporal giant cell arteritis shows an excellent interobserver agreement. Clin Exp Rheumatol 2015;33:S-113-5.
- Hauenstein C, Reinhard M, Geiger J, Markl M, Hetzel A, Treszl A, et al. Effects of early corticosteroid treatment on magnetic resonance imaging and ultrasonography findings in giant cell arteritis. Rheumatology (Oxford) 2012;51:1999–2003.
- Arida A, Kyprianou M, Kanakis M, Sfikakis PP. The diagnostic value of ultrasonography-derived edema of the temporal artery wall in giant cell arteritis: a second meta-analysis. BMC Musculoskelet Disord 2010;11:44.
- Maldini C, Depinay-Dhellemmes C, Tra TT, Chauveau M, Allanore Y, Gossec L, et al. Limited value of temporal artery ultrasonography examinations for diagnosis of giant cell arteritis: analysis of 77 subjects. J Rheumatol 2010;37:2326–30.
- Salvarani C, Silingardi M, Ghirarduzzi A, Lo Scocco G, Macchioni P, Bajocchi G, et al. Is duplex ultrasonography useful for the diagnosis of giant-cell arteritis? Ann Intern Med 2002;137:232–8.
- Schmidt WA, Kraft HE, Vorpahl K, Volker L, Gromnica-Ihle EJ. Color duplex ultrasonography in the diagnosis of temporal arteritis. N Engl J Med 1997;337:1336–42.
- Karassa FB, Matsagas MI, Schmidt WA, Ioannidis JP. Meta-analysis: test performance of ultrasonography for giant-cell arteritis. Ann Intern Med 2005;142:359–69.
- Erlov T, Cinthio M, Edsfeldt A, Segstedt S, Dias N, Nilsson J, et al. Determining carotid plaque vulnerability using ultrasound center frequency shifts. Atherosclerosis 2016;246:293–300.
- Erlov T, Jansson T, Persson HW, Cinthio M. Scatterer size estimation using the center frequency assessed from ultrasound time domain data. J Acoust Soc Am 2016;140:2352–7.
- Oelze ML, Mamou J. Review of quantitative ultrasound: envelope statistics and backscatter coefficient imaging and contributions to diagnostic ultrasound. IEEE Trans Ultrason Ferroelectr Freq Control 2016;63:336–51.
- Pfadenhauer K, Weber H. Duplex sonography of the temporal and occipital artery in the diagnosis of temporal arteritis. A prospective study. J Rheumatol 2003;30:2177–81.
- Muratore F, Boiardi L, Restuccia G, Macchioni P, Pazzola G, Nicolini A, et al. Comparison between colour duplex sonography findings and different histological patterns of temporal artery. Rheumatology (Oxford) 2013;52:2268–74.
- Oh LJ, Wong E, Gill AJ, McCluskey P, Smith JEH. Value of temporal artery biopsy length in diagnosing giant cell arteritis. ANZ J Surg 2018;88:191–5.
- Czihal M, Zanker S, Rademacher A, Tato F, Kuhlencordt PJ, Schulze-Koops H, et al. Sonographic and clinical pattern of extracranial and cranial giant cell arteritis. Scand J Rheumatol 2012;41:231–6.
- Schmidt WA, Seifert A, Gromnica-Ihle E, Krause A, Natusch A. Ultrasound of proximal upper extremity arteries to increase the diagnostic yield in large-vessel giant cell arteritis. Rheumatology (Oxford) 2008;47:96–101.
- DiIorio MA, Sobiesczcyk PS, Xu C, Huang W, Ford JA, Zhao SS, et al. Associations among temporal and large artery abnormalities on vascular ultrasound in giant cell arteritis. Scand J Rheumatol 2021;50:381–9.
- Fries JF, Hunder GG, Bloch DA, Michel BA, Arend WP, Calabrese LH, et al. The American College of Rheumatology 1990 criteria for the classification of vasculitis. Summary. Arthritis Rheum 1990;33:1135–6.