
ABSTRACT
Distinguishing morphologically cryptic taxa, by definition, requires genetic data such as DNA sequences. However, DNA sequences may not be obtained easily for taxa from remote sites. Here we provide the details of a high-resolution melt-curve-based method using taxon-specific primers that can distinguish two taxa of Adélie penguins, and that will be usable in Antarctica when combined with some of the newly developed field-deployable thermal cyclers. We suggest that the wider adoption of field-deployable polymerase-chain-reaction-based techniques will enable faster assignation of haplotype to individuals in situ, and so allow the targeting of observations and sample collection to specimens relevant to the research question. Targeting individuals will also reduce the need to repeatedly handle animals and reduce the time and travel required to complete field work.
Introduction
Taxonomy is a crucial tool for understanding biodiversity and for setting priorities for the conservation management of species affected by factors such as climate change or human fishing activity (McNeely Citation2002; Mace Citation2004). The conservation status of a species is dependent on several factors including population size and distribution (e.g. the IUCN Red List, IUCN Citation2014), and changes to the taxonomic classification of a population (e.g. from subspecies to species) can result in increased protection for the taxon if the taxon is reclassified into separate species (Morrison et al. Citation2009). The correct taxonomy of species is essential to understanding population sizes and distributions so that conservation management priorities and strategies can be assigned correctly. Additionally, the taxonomic status of populations can be obscured as climate change alters the geographical ranges of many taxa (Parmesan Citation1996; Parmesan & Yohe Citation2003; Root et al. Citation2003) resulting in the mixing of populations that were previously geographically separated.
Genetic sequences, in association with morphological and behavioural data, have identified previously unrecognised diversity within species and have been used to support the taxonomic reclassification of many species including penguins such as blue penguins, Eudyptula minor, gentoo penguins, Pygoscelis papua, and rockhopper penguins, Eudyptes chrysocome. Blue penguins were classified into six subspecies based on morphological variation (Kinsky & Falla Citation1976). Genetic studies based on mitochondrial DNA found that blue penguins were divided into two highly distinctive genetic clades that did not coincide with the morphological classification (Banks et al. Citation2002, Citation2008) but the genetic clades were supported by vocalisation differences and subtle variations in feather colour (Banks et al. Citation2002; Clark et al. Citation2015; Macey et al. Citation2015). Subsequent data from nuclear genetic markers also supported reclassifying the blue penguin into two species (Grosser et al. Citation2014).
Genetic data were also used to clarify the taxonomy of rockhopper penguins. Based on morphological and vocalisation differences, two (Jouventin Citation1982; Cooper et al. Citation1990) or three (Marchant & Higgins Citation1990; Martinez Citation1992) populations of rockhoppers were recognised. Banks et al. (Citation2006) found that the genetic distances for three genes among the three rockhopper clades were similar to the distances seen among other penguin species and suggested that rockhoppers should be classified into three species. Reclassifying rockhoppers was further supported by analysis of more gene regions (de Dinechin et al. Citation2009). Reclassification of rockhoppers was adopted by the New Zealand Department of Conservation when it recognised the eastern rockhopper penguin as a full species, Eudyptes filholi. The change in the taxonomy of the eastern rockhopper penguin resulted in its conservation status changing from ‘Nationally Endangered’ to ‘Nationally Critical’ (Hitchmough Citation2013) because the effective population size was now much reduced. Taxa listed as ‘Nationally Critical’ have a very high risk of extinction (Hitchmough et al. Citation2007).
There are an estimated 2.5 million Adélie penguin breeding pairs, Pygoscelis adeliae, living around the Antarctic continent (Ainley Citation2002), with approximately one million breeding pairs of Adélie penguins in the Ross Sea (LaRue et al. Citation2013). There are two distinctive genetic clades of Adélie penguins, an ‘Antarctic’ Adélie penguin clade found around Antarctica and in the Ross Sea, and a ‘Ross Sea’ clade found only in the Ross Sea (Ritchie et al. Citation2004). There is no breakdown of the numbers of each Adélie penguin clade in the Ross Sea, but given the relative frequencies of the Ross Sea Adélie clade (64% at Cape Hallett, 19% on Ross Island, 0% outside the Ross Sea) (Ritchie et al. Citation2004), there are probably fewer than 600,000 pairs of the Ross Sea clade.
The genetic differences between the two Adélie penguin clades are similar to those within three penguin groups that have been suggested are in need of taxonomic revision; blue (Banks et al. Citation2002), rockhopper (Banks et al. Citation2006) and gentoo (de Dinechin et al. Citation2012) penguins. Unlike gentoo, rockhopper and blue penguins, morphological and behavioural differences have not been investigated in Adélie penguins. Here we provide the details of a genetic assay using high-resolution melt curves to distinguish the two Adélie penguin clades, and compare the clade identifications from the high-resolution melt curves with those obtained by sequencing to verify the accuracy of the method. Our cost-effective approach to clade assignment will be field-deployable using some of the newly developed, portable thermal cyclers and so will facilitate in situ research into Adélie penguin taxonomy, behaviour and morphology.
Materials and methods
Sample collection
Feathers and faeces were collected in November 2005 from Adélie penguins selected randomly from seven different sites in the Ross Sea. DNA was collected from 21 faecal and feather samples collected from Adélie penguins breeding at Cotter Cliffs (72.4041°S, 170.3110°E), and Capes Adare (71.3106°S, 170.2078°E), Bird (77.2140°S, 166.4402°E), Crozier (77.4622°S, 169.2818°E), Hallett (72.3185°S, 170.2221°E), Royds (77.5539°S, 166.1618°E) and Wheatstone (72.6218°S, 170.2016°E), on the Victoria Land coast of the Ross Sea. Faecal swabs were collected by inserting sterile rayon swabs (LP Italiana Spa) into the penguins' cloacae. Swabs were frozen immediately in the field in liquid nitrogen and then placed at −80 °C on return to the laboratory. Feather samples were placed in tubes containing 100% ethanol and then stored at −80 °C in the laboratory. Sample collection was approved by the University of Waikato animal ethics committee. Genomic DNA was extracted from the swabs using the PowerSoil DNA isolation kit (Mo Bio) as described in Banks et al. (Citation2006).
To identify the clade to which an individual belonged, we amplified a section of the d-loop from the mitochondrial genome. Birds were haplotyped by sequencing 651 nucleotides of the hypervariable region of the mitochondrial control region using the protocol of Ritchie et al. (Citation2004), although we increased the annealing temperature to 56 °C. Samples were analysed on an ABI 3130XL DNA sequencer. Adélie control region sequences were aligned in Clustal X (Larkin et al. Citation2007). Based on the genetic sequences of the birds, individuals were then assigned to either the Antarctic (A) or Ross Sea (RS) clades.
High-resolution melt curve analysis
To economically and quickly identify the clade to which each bird belonged, we developed high-resolution melt-curve-based methods using a quantitative polymerase chain reaction (qPCR) thermal cycler. We identified a 138 nucleotide long area of the d-loop region that varied between the two Adélie penguin clades () and designed PCR primers that would only amplify one or the other of the two clades ().
Figure 1. The 138 nucleotide region of the mitochondrial d-loop amplified by the primers Clade_1For, Clade_2For and Clade 1/2Rev. The consensus sequence uses the IUPAC codes for variable sites in the alignment (r = A or G, y = C or T).
Table 1. Primer sequences used in polymerase chain reactions to identify the clades to which each Adélie penguin belongs.
Each PCR consisted of 10 µL of Ssofast EvaGreen Supermix (BioRad) containing Sybr Green fluorescent dye, 1 µL of either Clade_1For or Clade_2For 10 mmol/L primer (IDT), 1 µL of Clade 1/2Rev 10 mmol/L (IDT), 6 µL of HPLC grade water (Invitrogen) and 2 µL of DNA template. Negative controls were incorporated in each amplification round using sterile water rather than DNA. All qPCRs were carried out using a Rotor-Gene 6000 thermal cycler (Qiagen). The thermal cycler profile consisted of an initial hold at 98 °C for 2 min, followed by 40 cycles of 98 °C for 20 s and 55 °C for 20 s. High-resolution melt curves were produced to identify positive reactions. Melt curves were produced by increasing the temperature from 52 °C to 90 °C in increments of 1 °C. Each increment was held for 5 s, and fluorescence at 510 nm was measured in response to excitation at 470 nm (green). Melt-point temperatures were calculated using the Rotor-Gene 6000 software (Version 1.7). Rotor-Gene run files and sequence files are available as supplementary material (Archive S1).
Results
We were able to correctly determine the haplotype of all 20 birds tested using our assays on DNA extracted from feathers, and of 18 of 21 birds from DNA extracted from faecal swabs (). High-resolution melt curves distinguished successful amplification from non-specific amplification from primer dimerisation (amplification from a template formed by primer molecules hybridising to each other because of strings of complementary bases in the primers (Chou et al. Citation1992). Successful amplification of target DNA for the two assays produced melt curves with a narrow peak ranging from 76.2 °C to 78.7 °C, whereas negative results produced a melt curve with a broad peak around 68 °C, characteristic of primer dimerisation, and no peaks around 77 °C ().
Figure 2. Melt curve profiles for the Antarctic (A) and the Ross Sea (RS) Adélie penguin assays run on sample 121 (a Ross Sea haplotype bird). The peak at 77 °C for the Ross Sea assay is a positive result. dF/dT is the change in fluorescence over the change in time.
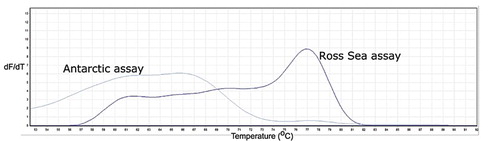
Table 2. Clade identification using high-resolution melt curves compared with clade identification from sequencing (i.e. sequencing 651 nucleotide region of the mitochondrial d-loop) in Adélie penguins.
Three faecal DNA swabs failed to produce any amplifiable DNA although the matching feather samples did provide amplifiable material that correctly identified the birds’ haplotypes ().
Discussion
Faecal samples provided an acceptable source of DNA with which to identify each Adélie penguin's haplotype. The feather DNA extracts provided unambiguous results (i.e. positive results that agreed with results obtained by sequencing) for all samples except feather DNA sample 144, which produced a very weak peak with assay 1 but a clearly negative result for assay 2. The result from the faecal DNA for the same bird was unequivocal, suggesting that the source material was the issue rather than the specimen's sequence and may reflect the concentration of DNA in the extraction or degradation of the DNA over time.
Three faecal DNA extracts failed to amplify with either assay; by contrast the corresponding feather DNA extractions from the same birds amplified for one or the other assay. The DNA extracts had been stored for over 8 years and moved between three laboratories before this analysis was conducted, suggesting that the DNA may have degraded over time. The co-extraction of inhibitory compounds may have also impacted on the amplification of these three samples. However, Deagle et al. (Citation2006) found no evidence for PCR inhibition in DNA extracts obtained from sea lion faecal samples, so we believe sample age rather than inhibition is the more likely cause of the non-amplification.
There was some variation in the melting points for each of the two assays calculated by the Rotor-Gene 6000 software. The variation among melting point temperatures for positive results within the two assays is very probably due to sequence variation among individuals within the two haplotypes. For example within the region amplified by the Clade 2 forward primer, only 111 of the 138 sites amplified are identical for all individuals and the largest pairwise distance within a clade was 3.6% or four nucleotides. However, this variation did not affect the efficacy of our haplotype identifications.
The primer sequences presented in this paper can be transferred easily to some of the new field-deployable thermal cyclers such as the Freedom 4 (Ubiquitome), and the gel-stabilised PCR reagent system developed by Aquila Diagnostic Systems. Alternatively, the samples could also be haplotyped using a conventional thermal cycler followed by gel electrophoresis. The application of field-based PCR is likely to revolutionise research in remote places by reducing the time and money needed to identify morphologically cryptic species, and so facilitate in situ studies of sympatric speciation, species’ distributions and biodiversity.
Supplementary data
Archive S1. Aligned sequences corresponding to the regions targeted by the haplotyping assay and Rotor Gene run files of the haplotyping assays.
Archive S1.
Download Zip (580.1 KB)Acknowledgements
Paul Nield was supported by the Science Teaching Leadership Programme administered by the Royal Society of New Zealand. Thanks to Kirsty Smith for constructive comments.
Associate Editor: Associate Professor Jim Briskie.
Disclosure statement
No potential conflict of interest was reported by the authors.
Additional information
Funding
Related Research Data
References
- Ainley D. 2002. The Adélie penguin. Bellwether of climate change. New York: Columbia University Press.
- Banks JC, Cruickshank RH, Drayton GM, Paterson AM. 2008. Few genetic differences between Victorian and Western Australian blue penguins, Eudyptula minor. New Zeal J Zool. 35:265–270. doi: 10.1080/03014220809510123
- Banks JC, van Buren A, Cherel Y, Whitfield JB. 2006. Genetic evidence for three species of rockhopper penguins, Eudyptes chrysocome. Polar Biol. 30:61–67. doi: 10.1007/s00300-006-0160-3
- Banks JC, Mitchell AD, Waas JR, Paterson AM. 2002. An unexpected pattern of molecular divergence within the blue penguin (Eudyptula minor) complex. Notornis. 49:29–38.
- Chou Q, Russell M, Birch DE, Raymond J, Bloch W. 1992. Prevention of pre-PCR mis-priming and primer dimerization improves low-copy-number amplifications. Nucleic Acids Res. 20:1717–1723. doi: 10.1093/nar/20.7.1717
- Clark J, Banks J, Agnew P, Gamboa R, Mason A, Waas J. 2015. Pairing patterns in mixed-clade colonies of little blue penguins. 9th Oamaru Penguin Symposium 2014. New Zeal J Zool. 42:33.
- Cooper J, Brown CR, Gales RP, Hindell MA, Klages NTW, Moors PJ, Pemberton D, Ridoux V, Thompson KR, van Heezik YM. 1990. Diets and dietary segregation of crested penguins (Eudyptes). In: Davis LS, Darby JT, editors. Penguin biology. San Diego: Academic Press; p. 131–156.
- Deagle B, Eveson JP, Jarman S. 2006. Quantification of damage in DNA recovered from highly degraded samples—a case study on DNA in faeces. Front Zool. 3:11. doi: 10.1186/1742-9994-3-11
- de Dinechin M, Dobson FS, Zehtindjiev P, Metcheva R, Couchoux C, Martin A, Quillfeldt P, Jouventin P. 2012. The biogeography of Gentoo Penguins (Pygoscelis papua). Can J Zool. 90:352–360. doi: 10.1139/z2012-016
- de Dinechin M, Ottvall R, Quillfeldt P, Jouventin P. 2009. Speciation chronology of rockhopper penguins inferred from molecular, geological and palaeoceanographic data. J Biogeogr. 36:693–702. doi: 10.1111/j.1365-2699.2008.02014.x
- Grosser S, Robertson BC, Rawlence N, Waters JM. 2014. Population genetics of little blue penguins, Eudyptula minor. 9th Oamaru Penguin Symposium.
- Hitchmough R. 2013. Summary of changes to the conservation status of taxa in the 2008–11 New Zealand Threat Classification System listing cycle. Wellington: Department of Conservation.
- Hitchmough R, Bull L, Cromarty P. 2007. New Zealand Threat Classification System lists—2005. Wellington: Department of Conservation.
- IUCN. 2014. IUCN Red List of Threatened Species. Version 2014.2. [cited 2014 Sept 30]. Available from: http://www.iucnredlist.org/
- Jouventin P. 1982. Visual and vocal signals in penguins, their evolution and adaptive characters. In: Wickler W, Curio E, editors. Advances in ethology No. 24. Berlin: Verlag Paul Parey; p. 148.
- Kinsky FC, Falla RA. 1976. A subspecific revision of the Australasian Blue Penguin (Eudyptula minor) in the New Zealand region. Nat Mus New Zeal Rec. 1:105–126.
- Larkin MA, Blackshields G, Brown NP, Chenna R, McGettigan PA, McWilliam H, Valentin F, Wallace IM, Wilm A, Lopez R and others. 2007. Clustal W and Clustal X version 2.0. Bioinformatics. 23:2947–2948. doi: 10.1093/bioinformatics/btm404
- LaRue MA, Ainley DG, Swanson M, Dugger KM, Lyver POB, Barton, K, Ballard G. 2013. Climate change winners: Receding ice fields facilitate colony expansion and altered dynamics in an Adélie penguin metapopulation. PLoS One. 8:e60568. doi: 10.1371/journal.pone.0060568
- Mace GM. 2004. The role of taxonomy in species conservation. Philos Trans R Soc London Ser B: Biolog Sci. 359:711–719. doi: 10.1098/rstb.2003.1454
- Macey S, Meadows M, Clark J, Banks J, Agnew P, Henriquez M, Waas J. 2015. The blue in little blue penguins: Quantifying colour and colour patterns by sex and clade. Proceedings of the 9th Oamaru Penguin Symposium 2014. New Zeal J Zool. 42:33–34.
- Marchant S, Higgins PJ. 1990. Handbook of Australian, New Zealand and Antarctic birds. Oxford: Oxford University Press.
- Martinez I. 1992. Order Sphenisciformes. In: Del Hoyo J, Elliott A, Sargatal J, editors. Handbook of the birds of the world. Barcelona: Lynx Edicions; p. 140–160.
- McNeely JA. 2002. The role of taxonomy in conserving biodiversity. J Nat Conser. 10:145–153. doi: 10.1078/1617-1381-00015
- Morrison WRIII, Lohr JL, Duchen P, Wilches R, Trujillo D, Mair M, Renner SS. 2009. The impact of taxonomic change on conservation: does it kill, can it save, or is it just irrelevant? Biol Conser. 142:3201–3206. doi: 10.1016/j.biocon.2009.07.019
- Parmesan C. 1996. Climate and species’ range. Nature. 382:765–766. doi: 10.1038/382765a0
- Parmesan C, Yohe G. 2003. A globally coherent fingerprint of climate change impacts across natural systems. Nature. 421:37–42. doi: 10.1038/nature01286
- Ritchie PA, Millar CD, Gibb GC, Baroni C, Lambert DM. 2004. Ancient DNA enables timing of the Pleistocene origin and Holocene expansion of two Adelie penguin lineages in Antarctica. Mol Biol Evol. 21:240–248. doi: 10.1093/molbev/msh012
- Root TL, Price JT, Hall KR, Schneider SH, Rosenzweig C, Pounds JA. 2003. Fingerprints of global warming on wild animals and plants. Nature. 421:57–60. doi: 10.1038/nature01333