
ABSTRACT
Predation by introduced mammals frequently limits abundance of New Zealand’s native invertebrates. We investigated responses of beetle and wētā communities to mammal eradication at two fenced forest sites at Maungatautari. Ground-dwelling beetle abundance, but not species richness, increased inside the southern exclosure two years after all mammals were eradicated. In the next 5 years, when all mammals except mice were eradicated from all of Maungatautari, beetle abundance and species richness were frequently higher in the mouse-free southern exclosure. Beetle community composition changed after mammal eradication, and over time with increasing mice densities outside the southern exclosure. Large, predatory, and native beetles showed the most differences between inside and outside the southern exclosure over some years. Wētā were more responsive to mammal removal than beetles. Wētā abundances both inside and outside the southern exclosure were similar when most mammals were eradicated and mice were controlled to low numbers. However, wētā declined in the following 2 years outside the southern exclosure when mouse abundance increased. Abiotic and biotic factors affecting the beetle and wētā communities are complex and interactions poorly understood. This study indicates that climate and predation by native fauna are likely to be important factors.
Introduction
The native biodiversity of isolated islands is renowned for its vulnerability to introduced mammal predation and competition (Tershy et al. Citation2015). There have been numerous examples in the literature of vertebrate declines and extinctions following the arrival of mammals on islands (e.g. King Citation2005; Towns et al. Citation2006), including some well-documented examples in New Zealand. For example, Innes et al. (Citation2010) reviewed New Zealand forest bird declines and suggested that this trend would continue unless introduced mammals were brought under greater control. Along with the recognized impacts on vertebrates, invertebrate populations can be suppressed and/or driven to extinction by introduced mammals. The majority of evidence comes from islands in New Zealand, Hawaii, and in the sub-Antarctic region (e.g. Hadfield et al. Citation1993; Gibbs Citation2009; Hadfield and Saufler Citation2009; Houghton et al. Citation2019).
Predation by introduced insectivorous mammals is now widely recognized as a major factor contributing to the decline and extinction of many New Zealand native invertebrates (whole issue of Ward (Citation2012) New Zealand Entomologist 35 (2)). The effects of such predation has long been suspected because New Zealand’s invertebrate fauna evolved in the absence of terrestrial mammals, except for bats. Invertebrates dominate the diet of small mammals (see King Citation2005), but few studies have quantified the effects that insectivorous mammals have on native invertebrate populations or communities. Most evidence has been derived from how invertebrates responded to rodent eradications on islands (Green Citation2002; Rufaut and Gibbs Citation2003; Sinclair et al. Citation2005), and after rat populations were controlled on the mainland (Spurr Citation1996; Hunt et al. Citation1998; King Citation2007; Ruscoe et al. Citation2013). Studies have documented changes in the abundance of some invertebrates (Green Citation2002; Watts et al. Citation2011, Citation2014), reported changes in species richness (Sinclair et al. Citation2005), and described how the behaviour of anostostomatid wētā changed (Rufaut and Gibbs Citation2003; Watts et al. Citation2011) after mammals were controlled to low levels or eradicated. Other invertebrates, however, were reported to show no response to rodent control (Craddock Citation1997; van Aarde et al. Citation2004; Sinclair et al. Citation2005; Rate Citation2009). The overall indications are that interactions between invertebrates and insectivorous mammal densities are complex, so that it is difficult to predict how invertebrates respond when insectivorous mammals are removed. This led Watts et al. (Citation2014) to warn that invertebrates should not always be expected to increase in abundance after numbers of mammalian predators are reduced, although populations of some large-bodied invertebrates may increase (Watts et al. Citation2011; Byrom et al. Citation2016). One reason for this is that removing predatory mammals may result in increased abundance of insectivorous birds, and this may have a confounding effect on how invertebrates respond (Sinclair et al. Citation2005; Watts et al. Citation2014). The eradication of mammals from New Zealand forests is considered a major ecological intervention (Hobbs et al. Citation2011) so we should expect complex, varied, and possibly surprising outcomes for the invertebrate fauna and the ecosystem as a whole.
In 2004, the Maungatautari Ecological Island Trust and partners constructed a number of mammal-resistant fences and attempted to eradicate all introduced mammals from Maungatautari as part of a community-driven project with the ambitious intention to ‘Remove, forever, introduced mammalian pests and predators from Maungatautari, and to restore to the forest a healthy diversity of indigenous plants and animals not seen in our lifetime’ (Smuts-Kennedy and Parker Citation2013). This project provided an opportunity to investigate changes in the invertebrate fauna following mammal eradication. Previous studies have found that functional traits can explain why certain elements of the beetle community respond most to mammal removal. For example, Watts et al. (Citation2014) found some evidence that the large Tenebrionid beetle, Mimopeus opaculus (Bates, 1873), benefitted from mammal eradication at the fenced sanctuary Zealandia. The 2004–09 responses of Auckland tree wētā (Hemideina thoracica (White, 1846)) to mammal removal at Maungatautari have already been published in Watts et al. (Citation2011), so here we took the opportunity to analyse another four summers of wētā response data. Watts et al. (Citation2017) suggested that arboreal tree wētā (Hemideina species) are likely to be dependable population indicators for insects and other invertebrates that are susceptible to mammal predation, but research is required to confirm this. Having both beetle and wētā datasets gave us the opportunity to investigate whether wētā abundance provides a useful indicator of beetle abundance.
Objectives of the current study were to: (1) investigate the changes in the beetle community following mammal eradication on Maungatautari; (2) determine whether beetle functional traits can explain why certain elements of the beetle community responded, and specifically we predict that ‘larger’ beetles (> 13 mm) will be more prevalent at Maungatautari following mammal eradication; (3) examine how wētā responded to mammal eradication on Maungatautari between 2004 and 2013; and (4) investigate whether wētā abundance provides a reliable indicator of beetle abundance.
Methods
Study area and sampling design
Maungatautari (3400 ha) is a forested andesitic volcanic cone (797 m asl) surrounded by farmland in the Waikato, North Island, New Zealand. The vegetation on Maungatautari varies from lowland forest dominated by rimu (Dacrydium cupressinum Sol. ex Lamb.) and tawa (Beilschmiedia tawa (A.Cunn.) Kirk) to upland forest comprising of tawari (Ixerba brexioides A.Cunn.), kamahi (Weinmannia racemosa L.f.) and tawheowheo (Quintinia serrata A.Cunn.,1893) (Clarkson Citation2002).
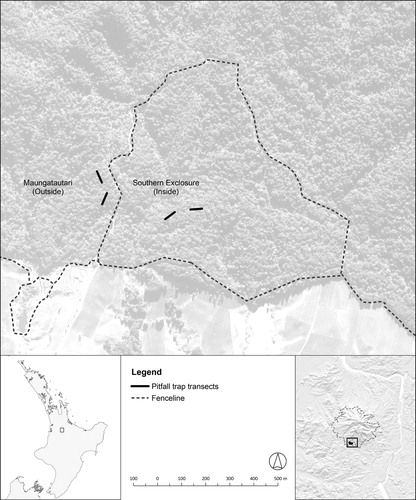
The restoration on Maungatautari proceeded in stages with the initial establishment of two pest-proof fenced exclosures on the northern (35 ha) and southern (65 ha) sides of Maungatautari (Speedy et al. Citation2007). During September–October 2004, mammals including mice were eradicated from these exclosures as a trial for the entire mountain (). In the southern exclosure, the focus of our study, four ship rats and five mice were detected and removed by trapping between November 2004 and May 2006 (Speedy et al. Citation2007). Between January 2007 and February 2013, there were no confirmed mammal incursions into the southern exclosure (). To eradicate mammals from the entire mountain, a pest-proof fence was built (completed by August 2006) and a prolonged mammal eradication operation started in November 2006 (Speedy et al. Citation2007). All mammals became very scarce, but mice were likely never eradicated from the entire reserve (Wilson et al. Citation2018). With ongoing mouse control becoming unsustainable, no further mouse control was attempted after February 2012 and since then they have become increasingly abundant (Geoff Churchill, Sanctuary Mountain, pers. comm. 2018; ).
Table 1. Timeline of fence completion, mammal eradication, detected mammal incursions, and native insectivorous bird introductions within the southern exclosure and in the entire Maungatautari fenced reserve from September 2004 to February 2013. The duration of the present study was December 2004 to February 2013.
In this study, we sampled beetles and wētā from two transects of pitfall traps situated within the southern exclosure (‘inside’ transects) and two outside the exclosure but inside the main fence (‘outside’ transects; ). Transects were placed within similar rimu-tawa-broadleaved forest and the transects within the exclosure were approximately 375 m away from the transects outside the exclosure. Sampling began approximately 6 weeks after the mammal eradication commenced in the southern exclosure, giving a before-after-control-impact (BACI) design where mammal removal occurred inside the southern exclosure, with the outer two transects being mammal-removal non-treatments for 2 years. The subsequent eradication of mammals from the entire mountain, starting in November 2006, allowed us to determine whether similar changes were detected on the outside transects.
Figure 1. Locations of the pitfall trap transects situated within the southern exclosure (‘inside’ transects) and outside the southern exclosure on Maungatautari (‘outside’ transects).
Beetle and wētā sampling and identification
Beetle and wētā were sampled using ten pitfall traps placed at 5-m intervals along each of the four 50-m transects, two inside and two outside the southern exclosure. Pitfall traps consisted of a 100-mm-deep plastic cup (105 mm diameter) containing 100 ml of 50% monopropylene glycol. Invertebrates were retrieved at monthly intervals from December to February for 8 years (2004/05–2012/13, excluding the summer of 2005/06) and stored in 70% ethanol.
Beetles were sorted on the basis of external morphology to recognisable taxonomic units (RTUs) and then, where possible, were identified to genus and species. Beetle species were classified into functional groups (herbivores, detritivores and predators) at family or subfamily level according to Klimaszewski and Watt (Citation1997) and from unpublished observations by ST. Additionally, each species was classified as ‘minute’ (<2 mm), ‘small’ (3–7 mm), ‘medium’ (8–12 mm) or ‘large’ (>13 mm). Beetles were classified as native or introduced according to MacFarlane et al. (Citation2010) and knowledge from ST.
Wētā caught in the pitfall traps were classified as adult H. thoracica, or as ‘other wētā’ that included subadult and juvenile H. thoracica and all age classes of ground wētā (Hemiandrus species) and cave wētā (Rhaphidophoridae species) (Watts et al. Citation2011).
Data analysis
Unless otherwise stated, data analysis was conducted using Genstat 19 (VSN International Citation2017). Probability values (p) less than 5% were considered statistically significant.
Beetle species richness and abundance
The beetle data set comprised the number of beetle species i collected from transect j, during summer t of the study. From this data, the number of unique beetle species collected (referred to as species richness) and the geometric mean species abundance were calculated for each transect every summer. The geometric mean, rather than the arithmetic mean, was analysed to ensure that the abundance measure was not dominated by the very abundant beetle species, Cholevinae spp. (Leiodidae), which accounted for nearly half of all beetles collected. Geometric mean abundance and species richness were analysed using repeated measures in order to assess whether they changed over time or differed between inside and outside the exclosure. The model was formulated as a linear mixed model and fitted using Residual Maximum Likelihood (REML). The correlation between observations on an individual transect over time was modelled using an AR1 model. The random model also allowed for additional uniform correlation within transects. The fixed model comprised factors for ‘summer’ (8 levels), ‘location’ (2 levels, inside or outside the southern exclosure), and the ‘summer × location’ interaction. Approximate F-tests were used to assess the significance of these terms. Protected approximate Least Significant Differences (LSDs) were used to compare the predicted means between inside and outside the exclosure for each summer.
Changes in geometric mean species abundance over time and, differences within each summer between inside and outside the exclosure, were also explored for the individual trophic groups (detritivore, herbivore, predator), size classes (large, medium, small, minute), and origin statuses (native, introduced) by independently analysing these subsets of data using the model described above.
Multivariate analyses of the beetle community composition
To assess the variation in beetle species composition and abundance between samples collected from inside and outside the southern exclosure, classification cluster analysis and ordination techniques were performed within the PATN multivariate analysis package (Belbin Citation1995). Species with only one specimen in the total dataset were omitted from the analysis. The procedures FUSE (Agglomerative Hierarchical Fusion) and SSH (Semi-Strong Hybrid Multidimensional Scaling) were implemented. A flexible Unweighted Pair-Group Method using UPGMA clustering method (with β = –0.1) where equal weight is given to objects, not groups, and the Bray–Curtis association measure, which consistently performed well in data testing (Faith et al. Citation1987), were selected. The resulting two-dimensional ordination with a stress value of 0.1867 was considered to summarise the data suitably (see Belbin Citation1995).
Number of wētā caught
The total numbers of adult H. thoracica and ‘other wētā’ caught each summer per transect were analysed separately using the repeated measures model described above, to assess whether the numbers caught changed over time, and whether there was a difference between inside and outside the exclosure.
Relationship between beetle and wētā abundance
To assess whether wētā abundance provides a reliable indicator of beetle abundance, the number of wētā caught was used to predict the geometric mean abundance of beetles. A linear mixed model was fitted to the geometric mean abundance with either the number of adult tree wētā caught, or the number of other wētā caught, as the explanatory variable. The correlation between observations on an individual transect over time was modelled using the AR1 model described above.
Results
Beetle species richness, abundance and ecological traits
Over the duration of the study (8 summers) a total of 56,173 beetles comprising 206 identifiable species were collected, of which 195 were native. Only 90 (0.2%) of the beetles collected were introduced. Due to the rarity of introduced beetles, the analysis of this subset of data is not presented. The majority of species collected were either small detritivores or large predators.
Beetle species richness ranged from 38 to 92 taxa collected per transect per summer. The average temporal trend in species richness differed between the inside and outside of the southern exclosure (test of the summer by location interaction; F7,8.6 = 4.53, p=0.022). During the summers of 2008/09, 2010/11 and 2012/13 average species richness inside the southern exclosure was significantly higher than outside (A).
Figure 2. Mean beetle A) species richness and B) geometric abundance per transect inside (circles with solid line) and outside (diamonds with dashed line) the southern exclosure. Time of mammal eradication in the southern exclosure is shown with a dashed vertical line, a solid vertical line for outside the southern exclosure, and a dotted vertical line for when mouse control ceased on Maungatautari. Stars indicate the summers where the mean was significantly different between inside and outside the southern exclosure. SED denotes the standard error of the difference used for comparing means within a summer.
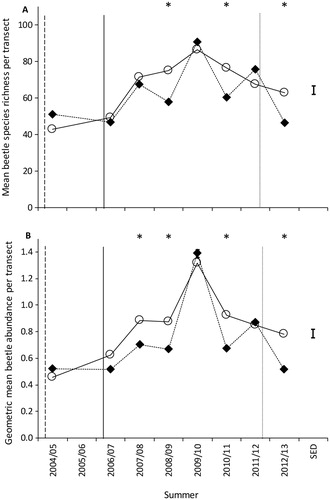
Geometric mean abundances ranged from 0.39–1.45 beetles per transect per summer. The average temporal trend in geometric mean abundance differed between inside and outside transects (test of the summer by location interaction; F7,8.1 = 5.25, p=0.016), with on average a higher geometric mean abundance inside the exclosure than outside during the summers of 2007/08, 2008/09, 2010/11 and 2012/13 (B). Similar trends were observed for native beetles (), which is to be expected as nearly all beetles collected were native. Differences in the average temporal trend in geometric mean abundance were also observed for herbivorous, predatory, large-sized and small-sized beetles (). During the summer of 2012/13, following the cessation of mouse control outside the exclosure, the geometric mean abundance of these groups was on average significantly higher inside than outside the exclosure. The average geometric mean abundance was also higher inside than outside during other summers for these groups (see ). For medium-sized species, although there was no evidence of an interaction between location and summer (p>0.05; ), there was evidence that on average the geometric mean abundance was higher inside than outside the exclosure (test of the location main effect; F7,7.0 = 30.92, p<0.001). No significant differences in the average geometric mean abundance between inside and outside the exclosure were observed for detritivorous or minute species; however, there were strong differences over time ().
Table 2. Sequential F statistics, denominator degrees of freedom (ddf), p-values, means, and standard errors of the difference for comparing locations within a summer (SED) from the analyses of geometric mean abundance for the trophic group (detritivore, herbivore, or predator), size class (large, medium, small or minute) and origin (native; introduced beetles are not presented due to the sparsity of data) subsets of data. Mammals were eradicated from the southern exclosure during September–October 2004 and from the entire Maungatautari mountain in November 2006. All mammals became scarce over Maungatautari, but mice were probably never eradicated from the entire mountain and, since February 2012 no further control was attempted, and they have become increasingly abundant. Refer to for further information.
Beetle community composition
Six groups with varying beetle species composition were identified by the FUSE classification analysis and were superimposed on the SSH ordination. These indicated that the beetle communities changed following mammal eradication and over time in response to mice densities increasing outside the southern exclosure (). There was a clear separation of groups in the ordination into two zones that correlated with the presence or absence of mammals (including mice alone) in a plot. Beetles collected from all plots before or in the first 2 summers after mammal eradication (inside summer 2004/05 and outside summer 2004/05 and 2006/07) had comparable beetle assemblages (group I; ). With increasing mouse densities, the beetles sampled from plots collected from outside the southern exclosure in summer 2012/13 (group II), were distinct from plots o collected in summer 2010/11 and 2011/12 (group III; ). The beetle communities collected after mammal eradication formed three distinct groups; Group IV consisted of all inside plots collected in February with the exception of 2010; Group V contained all plots collected in summer 2009/10, and Group VI contained all the remaining plots ().
Figure 3. Distribution of beetle species (+) caught at plots inside and outside the southern exclosure at Maungatautari Ecological Island defined by the two-dimensional SSH ordination analyses. Six groupings with similar beetle species composition identified by the FUSE clustering analysis have been superimposed as ellipses around plots. Closed symbols = outside the southern Exclosure, open circles = inside the southern Exclosure. Species codes are: Alespp = Aleocharinae spp.; Cteada = Ctenognathus adamsi; Torlin = Tormissus linsi; Rytsqu = Rytinotus squamulosus; Chospp = Cholevinae spp.; Odospp = Odontria spp.; and Sepspp = Sepedophilus spp.. The dashed line separates the two major groups of plots – those with and without pest mammals.
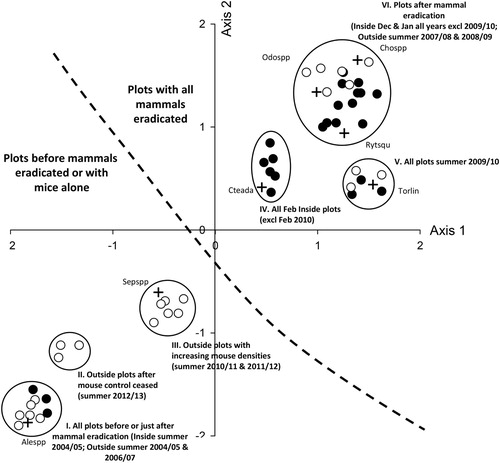
The abundances of eighty-nine taxa were significantly correlated with plots in relation to mammal eradication. Plots in Group I were dominated by large abundances of Aleocharinae spp. (Staphylinidae; ). Ctenognathus adamsi (Broun, 1886) (Carabidae), Tormissus linsi (Sharp, 1884) (Hydrophilidae), Rytinotus squamulosus Broun, 1880 (Zopheridae), and Cholevinae spp. were predominately associated with plots after mammal eradication (). Sepedophilus spp. (Staphylinidae) became dominant in plots outside the southern exclosure in years with increasing mouse densities ().
Number of wētā caught
A total of 3,088 wētā were caught, of which 969 were adult H. thoracica (470 female, 499 male). The total number of wētā caught per transect within a summer ranged from 6 to 161.
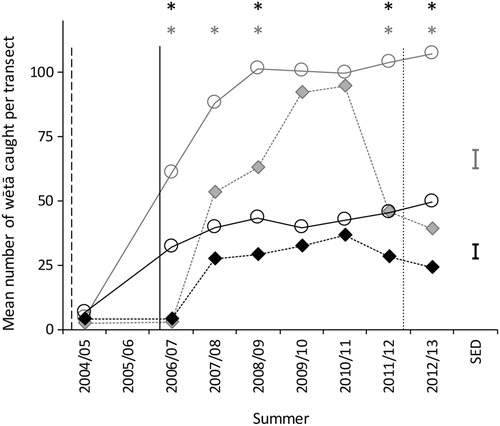
The temporal trend in the mean number of adult H. thoracica caught per transect differed between inside and outside the southern exclosure (test of the summer by location interaction; F7,11.7 = 2.92, p=0.05). The mean adult H. thoracica catch was significantly higher inside the exclosure than outside during during four of the eight summers (). The mean number of other wētā caught exhibited a similar temporal trend (test of the summer by location interaction; F7,10.9 = 13.85, p<0.001). For other wētā, the mean catch was also significantly higher inside the exclosure than outside during the summer of 2007/08 ().
Figure 4. Mean number of adult H. thoracica (black symbols and lines) and ‘other wētā’ (grey symbols and lines) caught per transect inside (circles with solid line) and outside (diamonds with dashed line) the southern exclosure. Time of mammal eradication in the southern exclosure is shown with a dashed vertical line, a solid vertical line for outside the southern exclosure, and a dotted vertical line for when mouse control ceased on Maungatautari. Stars indicate the summers where mean catch inside was statistically significantly different from the mean catch outside. SED denotes the standard error of the difference used for comparing means within a summer. The y-axis scale differs between graphs. Data presented from 2004/2005–2008/2009 are taken from Watts et al. (Citation2011).
Relationship between geometric mean beetle abundance and wētā caught
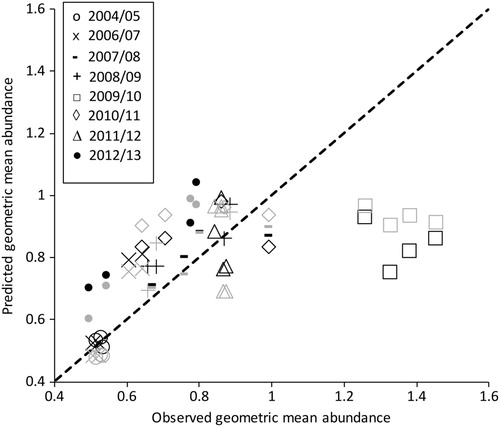
Both the number of adult H. thoracica caught (F1,30 = 12.96; p=0.001) and the number of all other wētā caught (F1,30 = 24.88; p<0.001) are statistically significant predictors of geometric mean beetle abundance. However, examination of the predicted values of geometric mean abundance plotted against the observed values reveals large discrepancies, particularly for data from the summer of 2009/10 (). In this year, the large increase in the geometric mean beetle abundance (B) is not reflected in the number of adult H. thoracica caught ().
Figure 5. Predicted geometric mean number of beetles plotted against the observed geometric mean where the explanatory variable is either the number of adult H. thoracica (black symbols) or number of ‘other wētā’ (grey symbols) caught per transect. Symbols are used to denote data from different summers.
Discussion
There have been limited data collected in New Zealand examining the effect of removing mammalian predators on the invertebrate fauna (but see Sinclair et al. Citation2005; Watts et al. Citation2011; and Watts et al. Citation2014). Although this study was based on a modest sample of pitfall traps dispersed through time, some interesting results have emerged. Our results repeatedly showed a strong year effect. This temporal noise is typical of invertebrate data and makes some of the results difficult to designate as predator driven with confidence. However, the data presented here are important, with the increasing number of conservation projects being established throughout New Zealand using predator-proof fences to exclude mammals following local eradication and the advent of PredatorFree 2050 (Russell et al. Citation2015; Parkes et al. Citation2017; Innes et al. Citation2019).
Beetle species richness, abundance, and community composition
Beetle abundance, but not species richness, increased inside the southern exclosure within 2 years after all mammals were eradicated. In the subsequent 5 years, during which all mammals except mice were also eradicated from the main Maungatautari reserve, beetle abundance and species richness were higher in four of six years within the mouse-free southern exclosure, which suggests mouse predation outside. Although complex interactions appear to be occurring, species richness and abundance certainly started to increase after predator control was implemented at the wider scale on Maungatautari, even inside the southern exclosure. It was assumed that the transects within the southern exclosure would have been sufficiently buffered from what was occurring outside the southern exclosure, but it is possible that insect communities are roaming more widely that we acknowledge and the response is much stronger later due to this wider buffer. Both sites showed a peak in beetle abundance and species richness in the summer of 2009/10, perhaps because drought-breaking rain occurred then. Examination of meteorological data from the closest NIWA weather station (23 km away) showed a significant drought event that lasted from November 2007 to April 2008 and then a dry spring in 2009 (Watts, unpublished data; https://www.waikatoregion.govt.nz/services/regional-services/regional-hazards-and-emergency-management/droughts accessed July 2018). In 2009/10, mice were still being targeted with control in the main reserve, so that the few mice present there were apparently unable to consume enough beetles to prevent beetle abundance from equalling that inside the mouse-free southern exclosure. If the 2009/10 year beetle results reflect an anomaly driven by environmental conditions, then overall beetle abundance and richness trends after predator control (between 2010 and 2013) is rather flat. This would support the discussion (see below) that this indicates a short period of mammal predator release curtailed by replacement with bird predation.
Bird communities have also been monitored on Maungatautari since fence emplacement and mammal eradication. Endemic bird species, particularly insectivorous species such as tomtit and whitehead (translocated in 2009; ), were more abundant and widespread on Maungatautari in 2014 than in pre-eradication surveys (Fitzgerald et al., unpublished data). These bird increases could account for the decrease in beetles after summer 2009/10.
The scenario of abundant mice after all other mammal species are eradicated within fenced areas is becoming commonplace in New Zealand. In another recent Maungatautari study, mice reduced the abundance and size of ground-dwelling invertebrates when they were the only mammal present (Watts et al. Citation2017). It could be that increasing bird and mouse abundances combined caused the decline in ground-dwelling beetles after summer 2009/10. In contrast, vegetation communities showed only small changes over 10 years; cover abundance of nine species increased significantly but basal area and density did not change; saplings of herbivore-preferred species (e.g. deer, possum, goats) only increased in plots with treefalls. This suggests that Maungatautari was not as degraded by pest mammals as other similar mainland forests at the time of fence completion and mammal eradication (B. Burns et al., unpublished data). We suggest that further research measuring environmental variables (e.g. litter depth, canopy density) that could be important habitat for invertebrates would be valuable. It is also possible that the time that the beetle community was monitored on Maungatautari was not long enough to detect the changes after mammal eradication. There is little known about the life histories of many New Zealand invertebrates, and it has been proposed that the responses of invertebrates (with multi-year developmental stages) to mammal eradication might only become obvious after at least 10 years (van Aarde et al. Citation2004; Watts et al. Citation2014). With the absence of mammals within the southern exclosure there is potential for the reestablishment of beetle taxa that have been lost from Maungatautari if they occur elsewhere (e.g. on mammal-free offshore island).
The ordination analyses indicated that beetle species composition changed after mammal eradication on Maungatautari and over time with increasing mouse densities outside the southern exclosure. Beetle assemblages were shown to be separated into two groups, distinguished by the presence or absence of predatory mammals. Some species benefited from mammal eradication. For example, very few specimens of the large beetles R. squamulosus and Odontria sp. 1 (Scarabaeidae) were collected when mammals were present, and their numbers increased after mammal eradication. The most common beetle sampled, Cholevinae sp. 1, was caught in low numbers before the eradication but increased thereafter. Cholevinae beetles are small native detritivores that feed in forest leaf litter at night, so they are likely to be susceptible to predation by small nocturnal mammals. Conversely, some taxa declined following mammal eradication, including the small rove beetle (Aleocharinae spp.), which was common when a suite of mammals was present and species of Sepedophilus, which were abundant when only mice were present. More detailed studies are required to determine why these taxa would increase. Watts et al. (Citation2014) similarly found that there were ‘winners’ and ‘losers’ in the beetle community at Zealandia after mammal eradication, with larger taxa benefitting from mammal eradication. Analysis of the beetle community from a functional trait perspective showed that large, predatory, and native beetles differed the most between inside and outside the southern exclosure over some years. The significant ‘native’ beetle result is likely to be a correlation with the ‘large’ and ‘predatory’ traits, since nearly all beetles caught were native. Of the 21 ‘large’ beetle taxa caught, 12 (57%) were predators. These data could indicate that a roaming predatory lifestyle may increase vulnerability to mammal predation. This warrants further research.
Wētā abundance inside versus outside the southern exclosure, over time
Wētā were more responsive to mammal removal than beetles. Watts et al. (Citation2011) reported a dramatic increase in wētā, both adult H. thoracia and other wētā, within 2 years of mammal eradication on Maungatautari. Consistent with this, the additional data collected in the present study showed that in the summers of 2009/10 and 2010/11, wētā abundance inside and outside the southern exclosure was similar when most mammals were eradicated, and mice were controlled. However, both adult H. thoracica and other wētā declined outside the southern exclosure in the 2 years after mouse control ceased (in February 2012). Also on Maungatautari, Watts et al. (Citation2017) found strong evidence that the tracking rates of adult H. thoracia and other wētā were inversely related to mouse tracking rates when they examined the impact of mice ‘alone’ on wētā. In addition, Byrom et al. (Citation2016) found that the only widespread insect species that has been shown to increase after mainland pest control is H. thoracica.
Are wētā effective invertebrate indicators?
Wētā, and in particular tree wētā, are one of New Zealand’s most comprehensively studied invertebrates and have been regarded as ‘bioindicators’ for monitoring the ‘health’ of forest ecosystems (Watts et al. Citation2011). More recently, Watts et al. (Citation2017) reviewed the suitability of tree wētā as a bioindicator for invertebrates and concluded that they were likely to be a reliable population indicator of individual taxa sensitive to mammalian predation pressure but not a dependable biodiversity or health indicator. In the present study, the number of adult H. thoracica and ‘other wētā’ caught were statistically significant predictors of geometric mean beetle abundance, but examination of the predicted values revealed substantial inconsistencies. This was particularly true for summer 2009/10 when the large increase in the geometric mean beetle abundance was not reflected in the number of adult H. thoracica caught. The data suggest that ‘other wētā’, especially those outside the southern exclosure, possibly behaved more like the beetle community. Therefore, we suggest that at a broad community level, tree wētā are not a consistent indicator but are probably more appropriate for representing taxa that are trait-wise comparable, such as large arboreal herbivores (e.g. stick insects; Watts et al. Citation2017).
Invertebrate sampling techniques
There are numerous techniques available for sampling invertebrate communities, including pitfall traps, malaise traps, visual searching, suction traps, insecticide fogging, sticky traps, light traps, and sweep-netting, which guarantee rapid acquisition of considerable collections and provide researchers with specimens (Southwood Citation1978; Brockie Citation1992; New Citation1998). However, monitoring invertebrates is often expensive, time-consuming, and restricted by expertise in diagnostics (Ward and Lariviere Citation2004; Watts et al. Citation2019). The method chosen for sampling often depends on the invertebrate group selected for study, and knowledge of the target invertebrates is critical. In the present study, pitfall traps were used to sample the ground-dwelling invertebrate fauna because they are cost effective to set up, inconspicuous, require little maintenance over a multi-year study, and sample taxa likely to be consumed by mammals and birds. In a recent study, Houghton et al. (Citation2019) found that pitfall traps collected the greatest abundance and richness of invertebrates compared with other methods (e.g. sweep netting, litter samples and searching habitat for 20 min), when monitoring the response of forest-dwelling invertebrate communities after vertebrate eradication on Macquarie Island. These results emphasize the need for the use of more than one sampling method for the study of forest invertebrates, as many invertebrates have different functional traits, preferred habitats, and behaviour/ecology (Moeed and Meads Citation1987; Watts et al. Citation2017). It is likely that if different invertebrate sampling techniques were deployed at Maungatautari, then the results found would be different. In addition, if different taxonomic groups were selected for analysis, then the outcomes would also likely be different. Towns et al. (Citation2009) investigated below-ground and litter-dwelling invertebrates after rat eradication and subtle changes in the associated nutrient cycling were detected. We do not know how invertebrates such as canopy-dwellers respond to mammal control and eradication. Taxonomic description of more invertebrate species is also required to enable interpretation of species and community responses to perturbations.
Synthesis: Mammal impacts on invertebrates, and benefits of mammal pest control
With the rapid increase throughout New Zealand in the establishment of conservation projects focused on maintaining mammal-free sanctuaries using pest-proof fences (Innes et al. Citation2019), our results are an important step in understanding how the beetle and wētā communities respond to mammal removal and the process of ecosystem adjustment. The responses of beetles, and invertebrates generally, to the eradication of mammals are not uniform. The abiotic and biotic factors affecting the invertebrate fauna are complex, and these interactions are poorly understood.
We should expect complex and diverse responses among invertebrates to mammal eradications because the groups we studied at a community level have different functional traits, preferred habitats, behaviour, and ecology. It is likely that the invertebrate taxa originally most affected by mammals are already extinct on Maungatautari, and generally on mainland New Zealand. Furthermore, the species that are extinct on the mainland may be less available for assisted recolonisation by translocation from mammal-free offshore islands than threatened birds.
In addition to the complexity of food-web dynamics, a lack of studies examining the impacts of mammal control or eradication on invertebrate populations in New Zealand hampers predictive scenarios for many invertebrate taxa. Emerging evidence from studies elsewhere in New Zealand indicates that major changes in invertebrate communities should not be expected after mammal predator control or eradication, although some taxa – especially large-bodied invertebrates – will benefit (Watts et al. Citation2011, Citation2014). Recently, analysis of ground-based control by TBfree New Zealand and conservation agencies found that the only widespread species that has been shown to increase after mainland pest control is H. thoracica, probably because it is a favoured prey of ship rats (Byrom et al. Citation2016). Monitoring large-bodied taxa, such as the tree wētā or large predatory ground beetles, could be possible way forward. Climate, and predation by native fauna such as birds, are likely to also be important factors. Another possibility is studying rare or threatened invertebrates, such as large weevils, that may have persisted in mainland refugia of any sort, as did Duvaucel’s gecko (Hoplodactylus duvaucelii (A.M.C. Duméril & Bibron, 1836)) on Maungatautari (Morgan-Richards et al. Citation2016). We currently have no or limited knowledge regarding how invertebrate-driven ecosystem processes, such as pollination or decomposition, respond after mammal control/eradication. Switching the focus of monitoring to these functions is worth investigation.
Acknowledgments
This research was supported by Strategic Science Investment Funding of the Ministry of Business, Innovation and Employment. We thank Robbie Price (Manaaki Whenua – Landcare Research) for creating Figure 1. Ian Stringer, Anne Austin, Chris Jones, Mandy Tocker and two anonymous reviewers provided useful comments on the manuscript.
Disclosure statement
No potential conflict of interest was reported by the authors.
Additional information
Funding
References
- Belbin L. 1995. PATN: Pattern analysis package. Technical reference. Canberra: CSIRO Division of Wildlife and Ecology.
- Brockie R. 1992. A living New Zealand Forest: A community of plants and animals. Auckland: David Bateman. 172 p.
- Byrom AE, Innes J, Binny RN. 2016. A review of biodiversity outcomes from possum-focused pest control in New Zealand. Wildlife Research. 43:228–253. doi: 10.1071/WR15132
- Clarkson B. 2002. Upland forests and special open habitats. In: Clarkson B, Merrett M, Downs T, editor. Botany of the Waikato. Waikato Botanical Society Inc: Hamilton; p. 82–90.
- Craddock P. 1997. Effect of rodent control on invertebrate communities on coastal forest near Auckland. Unpublished MSc thesis, University of Auckland, Auckland, New Zealand.
- Faith DP, Minchin PR, Belbin L. 1987. Compositional dissimilarity as a robust measure of ecological distance. Vegetatio. 69:57–68. doi: 10.1007/BF00038687
- Gibbs GW. 2009. The end of an 80-million year experiment: a review of evidence describing the impact of introduced rodents on New Zealand’s ‘mammal-free’ invertebrate fauna. Biological Invasions. 11:1587–1593. doi: 10.1007/s10530-008-9408-x
- Green CJ. 2002. Recovery of invertebrate populations on Tiritiri Matangi Island, New Zealand following eradication of Pacific rats (Rattus exculans) [abstract]. In: Veitch CR, Clout MN, editor. Turning the tide: the eradication of invasive species. Gland, Switzerland and Cambridge (UK): IUCN SSC Invasive Species Specialist Group; p. 407.
- Hadfield MG, Miller SE, Carwile AH. 1993. The decimation of endemic Hawai’ian tree snails by alien predators. American Zoologist. 33:610–622. doi: 10.1093/icb/33.6.610
- Hadfield MG, Saufler JE. 2009. The demographics of destruction: isolated populations of arboreal snails and sustained predation by rats on the island of Moloka’I 1982–2006. Biological Invasions. 11:1595–1609. doi: 10.1007/s10530-008-9409-9
- Hobbs RJ, Hallett LM, Ehrlich PR, Mooney HA. 2011. Intervention ecology: applying ecological science in the twenty-first century. BioScience. 61:442–450. doi: 10.1525/bio.2011.61.6.6
- Houghton M, Terauds A, Shaw J. 2019. Methods of monitoring invertebrate response to vertebrate eradication. In: Veitch CR, Clout MN, Martin AR, Russell JC, West CJ, editor. Island invasives: scaling up to meet the challenge. Occasional Paper SSC no. 62. Gland: Switzerland IUCN; p. 381–388.
- Hunt M, Sherley G, Wakelin M. 1998. Results of a pilot study to detect benefits to large-bodied invertebrates from sustained regular poisoning of rodents and possums at Karioi, Ohakune. Science for Conservation 102. Wellington: Department of Conservation. p. 18.
- Innes J, Fitzgerald N, Binny R, Byrom A, Pech R, Watts C, Gillies MM, Campbell-Hunt C, Burns B. 2019. New Zealand ecosanctuaries: types, attributes and outcomes. Journal of the Royal Society of New Zealand. 49:370–393. doi: 10.1080/03036758.2019.1620297
- Innes J, Kelly D, Overton JM, Gillies C. 2010. Predation and other factors currently limiting New Zealand forest birds. New Zealand Journal of Ecology. 34:86–114.
- King CM. 2005. The handbook of New Zealand mammals. Melbourne: Oxford University Press. p. 610.
- King PA. 2007. The effects of rodents on ground-dwelling arthropods in the Waitakere Ranges. Unpublished MSc thesis, Auckland University of Technology, Auckland, New Zealand. 179 p.
- Klimaszewski J, Watt JC. 1997. Coleoptera. Family-group review and keys to identification. Fauna of New Zealand 37. Lincoln: Manaaki Whenua Press. p. 199.
- MacFarlane RP, Maddison PA, Andrew IG, … Buckley TR. 2010. Phylum Arthopoda. Subphylum Hexapoda: Protura, springtails, Diplura, insects. In: Gordon DP, editor. New Zealand inventory of Biodiversity: Volume two Kingdom Animalia Chaetognatha, Ecdysozoa, Ichnofossils. Christchurch: Canterbury University Press; p. 233–467.
- Moeed A, Meads M. 1987. Seasonality of pitfall trapped invertebrates in three types of native forest, Orongorongo Valley, New Zealand. New Zealand Journal of Zoology. 12:17–53. doi: 10.1080/03014223.1985.10428264
- Morgan-Richards M, Hinlo A, Smuts-Kennedy C, Innes J, Ji W, Barry M, Brunton D, Hitchmough R. 2016. Identification of a rare gecko from North Island New Zealand, and genetic assessment of its possible origin: a novel mainland conservation priority? Journal of Herpetology. 50:77–86. doi: 10.1670/13-128
- New TR. 1998. Invertebrates surveys for conservation. Oxford: Oxford University Press.
- Parkes JP, Nugent G, Forsyth DM, Byrom AE, Pech RP, Warburton B, Choquenot D. 2017. Past, present and two potential futures for managing New Zealand’s mammalian pests. New Zealand Journal of Ecology. 41:151–162.
- Rate SR. 2009. Does rat control benefit forest invertebrates at Moehau, Coromandel Peninsula? DOC Research and Development Series 316, Department of Conservation, Wellington. p. 26.
- Rufaut CG, Gibbs GW. 2003. Response of a tree weta population (Hemideina crassidens) after eradication of the Polynesian rat from a New Zealand island. Restoration Ecology. 11:13–19. doi: 10.1046/j.1526-100X.2003.00058.x
- Ruscoe WA, Sweetapple PJ, Perry M, Duncan RP. 2013. Effects of spatially extensive control of invasive rats on abundance of native invertebrates in mainland New Zealand forests. Conservation Biology. 27:74–82. doi: 10.1111/j.1523-1739.2012.01932.x
- Russell JC, Innes JG, Brown PH, Byrom AE. 2015. Predator-free New Zealand: conservation country. Bioscience. 65:520–525. doi: 10.1093/biosci/biv012
- Sinclair L, McCartney J, Godfrey J, Pledger S, Wakelin M, Sherley G. 2005. How did invertebrates respond to eradication of rats from Kapiti Island, New Zealand? New Zealand Journal of Zoology. 32:293–315. doi: 10.1080/03014223.2005.9518421
- Smuts-Kennedy C, Parker K. 2013. Reconstructing avian biodiversity of Maungatautari. Notornis. 60:93–106.
- Southwood TRE. 1978. Ecological Methods, 2nd edition. London: Chapman & Hall. p. 575.
- Speedy C, Day T, Innes J. 2007. Pest eradication technology – the critical partner to pest exclusion technology: The Maungatautari experience. USDA National Wildlife research Center Symposia – managing Vertebrate Invasive species. Lincoln, USA: University of Nebraska.
- Spurr EB. 1996. Environmental effects of rodent Talon baiting. part II: Impacts on invertebrate populations. In: Science for Conservation 38. Wellington: Department of Conservation; p. 12–27.
- Tershy BR, Shen KW, Newton KM, Holmes ND, Croll DA. 2015. The importance of islands for the protection of biological and linguistic diversity. BioScience. 65:592–597. doi: 10.1093/biosci/biv031
- Towns DR, Atkinson IAE, Daugherty CH. 2006. Have the harmful effects of introduced rats on islands been exaggerated? Biological Invasions. 8:863–891. doi: 10.1007/s10530-005-0421-z
- Towns DR, Wardle DA, Mulder CPH, Yeates GW, Fitzgerald BM, Parrish GR, Bellingham PJ, Bonner KI. 2009. Predation of seabirds by invasive rats: multiple indirect consequences for invertebrate communities. Oikos. 118:420–430. doi: 10.1111/j.1600-0706.2008.17186.x
- van Aarde RJ, Ferreira SM, Wassenaar TD. 2004. Do feral house mice have an impact on invertebrate communities on sub Antarctic Marion Island? Austral Ecology. 29:215–224. doi: 10.1111/j.1442-9993.2004.01341.x
- VSN International. 2017. Genstat for Windows, 19th Edition. Hemel Hempstead, UK: VSN International.
- Ward DF. Ed. 2012. New Zealand Entomologist 35(2) Special Issue.
- Ward DF, Lariviere MC. 2004. Terrestrial invertebrate surveys and rapid biodiversity assessment in New Zealand: lessons from Australia. New Zealand Journal of Ecology. 28:151–159.
- Watts C, Armstrong DP, Innes J, Thornburrow D. 2011. Dramatic increases in weta (Orthoptera) following mammal eradication on Maungatautari – evidence from pitfalls and tracking tunnels. New Zealand Journal of Ecology. 35:261–272.
- Watts C, Dopheide A, Holdaway R, Davis C, Wood J, Thornburrow D, Dickie IA. 2019. DNA metabarcoding as a tool for invertebrate community monitoring: a case study comparison with conventional techniques. Austral Entomology. 58:675–686. doi: 10.1111/aen.12384
- Watts C, Innes J, Wilson D, Fitzgerald N, Bartlam S, Thornburrow D, Smale M, Barker G. 2017. Impacts of mice alone on biodiversity: final report of a Waikato field trial. Landcare Research Contract Report LC2747.
- Watts C, Thornburrow D, Cave V, Innes J. 2014. Beetle community changes following pest mammal control at two biodiversity sanctuaries in Wellington, New Zealand. Journal of the Royal Society of New Zealand. 44:61–87. doi: 10.1080/03036758.2013.875478
- Wilson DJ, Innes JG, Fitzgerald NB, Bartlam S, Watts C, Smale MC. 2018. Population dynamics of house mice without mammalian predators and competitors. New Zealand Journal of Ecology. 42:192–203. doi: 10.20417/nzjecol.42.25