
ABSTRACT
Dolphins are social animals that depend on sound to communicate, navigate, and find food. The aim of our research was to describe dolphin whistle characteristics and compare whistles between two isolated populations of bottlenose dolphins in New Zealand. We focused on three aspects of dolphin bioacoustics (1) classification of whistles; (2) comparison of the whistles of two discrete bottlenose dolphin populations; and (3) comparison of whistles of dolphin populations from around the world. At Great Barrier Island, the most common type of whistle was upsweep followed by sine, while at Doubtful Sound, convex and sine whistles were the most common whistle types. Random Forest models discriminated between whistles from the two populations with an estimated accuracy of 90%. The key differences were whistle-type contour, duration, and end frequency. Linear Mixed models show that whistle acoustic parameters were influenced by location but not by group size or the presence of immatures. Whistle parameters of both populations fell within the range of multiple populations from around the world. This studyprovides a benchmark for future research into drivers of geographic variation in dolphin vocal communication.
Introduction
Many social vertebrate species use acoustic signals to convey and gather information about identity, location, food, and behavioural state (Vasconcelos et al. Citation2012; Wilkins et al. Citation2013; King and Janik Citation2015). In marine environments, acoustic forms of communication can provide advantages over other transmission modes. Dolphins, in particular, are highly vocal animals and depend on sound to communicate, navigate, and find food (Clark and Clark Citation1980). Toothed whales can produce sounds that can be classified into three structural categories: clicks or pulsed signals, burst-pulsed sounds, and whistles or tonal signals (Au and Hastings Citation2008; Janik Citation2009). Clicks are short broadband sounds with frequencies between 10 and 200 kHz and are used for echolocation but can also be used in conspecific communication (Au and Hastings Citation2008; Janik Citation2009). Burst-pulsed sounds are broadband pulses consisting mainly of clicks with most of their energy focused on low-frequency trains (Au and Hastings Citation2008; Janik Citation2009). Whistles are narrowband frequency-modulated sounds with a harmonic structure. Whistles can have frequencies between 3 and 36 kHz (Hiley et al. Citation2017), and a duration between 100 ms and 4 s (Buckstaff Citation2004). Whistles in free-ranging bottlenose dolphins have been recorded reaching up to ∼169 dB re. 1μPa (Janik Citation2000). With few exceptions (e.g. genus Cephalorhynchus, Kogia, Neophocena, Phocoena, Phocoenoides and Physeter; Au and Hastings Citation2008), all odontocetes can produce whistles.
Whistles are used for group cohesion (Janik and Slater Citation1998), group coordination (Acevedo-Gutiérrez and Stienessen Citation2004), individual identification (Janik et al. Citation2006; Janik and Slater Citation1998), and to maintain distance between dolphins (May-Collado and Wartzok Citation2008). Dolphins produce two types of whistles; signature and non-signature or variant whistles (Caldwell and Caldwell Citation1979; Janik et al. Citation2006; Sayigh et al. Citation2007). Signature whistles (SW) are defined as whistles characterised by stereotyped, distinctive frequency-modulated patterns and are thought to convey information about the individual for recognition (Caldwell and Caldwell Citation1979; Janik and Sayigh Citation2013; Gridley et al. Citation2014; King and Janik Citation2015; Sayigh et al. Citation1995). Signature whistles are particular to individuals and it has been suggested that they work similarly to human names (Janik and Sayigh Citation2013). Non-signature whistles or variant whistles are defined as other whistles without distinctive frequency-modulated patterns (Caldwell and Caldwell Citation1979; Janik and Sayigh Citation2013). When the same contour areobserved to be repeated consecutively in aspectrogram, theyareconsidered to be SW. . Here, we focused only on non-signature whistles. Whistle characteristics of bottlenose dolphins have been described from populations around the world (Díaz López Citation2011; Gridley et al. Citation2012; Hawkins and Gartside Citation2010; Hernández et al. Citation2010; Hiley et al. Citation2017; Ward et al. Citation2016) and variability among populations, although limited, have demonstrated the vocal plasticity of this species (Bazúa-Durán Citation2004; Hawkins Citation2010; La Manna et al. Citation2017; Lima et al. Citation2020; Luís et al. Citation2021; May-Collado and Wartzok Citation2008; Morisaka et al. Citation2005b; Papale et al. Citation2014).
Geographic differences in whistles parameters have been reported in several species of odontocetes including bottlenose dolphins Tursiops truncatus (La Manna et al. Citation2020; Luís et al. Citation2021) and Indo-Pacific bottlenose dolphins T. aduncus (Hawkins Citation2010; Morisaka et al. Citation2005b). Lima and colleagues (Citation2020) analysed whistle characteristics of three neighbouring populations of bottlenose dolphin Tursiops truncatus gephyreus in southern Brazil and Uruguay. They compared frequency parameters, duration, and inflexion points among the populations and found variations only in frequency parameters (Lima et al. Citation2020). Hawkins (Citation2010) compared whistle characteristics between bottlenose dolphins from the east and the west coasts of Australia. Their results indicated that whistle acoustic parameters vary between groups based on their tonal class and the acoustic parameter being assessed, and that these differences were most likely motivated by specific environmental factors, such as ambient noise from shipping and boating activities, in addition to varying behavioural circumstances and group sizes (Hawkins Citation2010). Different populations of dolphins may have developed their unique whistle repertoire to maintain group cohesion and individual recognition, thus improving social bonds and cooperation (Chereskin et al. Citation2022). Other proposed advantages include avoidance of inbreeding (Dutchen Citation2021), and adaptation to local physical conditions (Yuan et al. Citation2021). Finally, geographic variation in acoustic signals can results as a by-product of cultural evolution. Furthermore, environmental factors such as water depth, temperature, and salinity can affect the transmission and reception of sound, which can also influence the development of dolphin whistles. For example, dolphins in shallow water may use higher frequency whistles that can travel shorter distances, while dolphins in deeper water may use lower frequency whistles that can travel further (Quintana-Rizzo et al. Citation2006).
Bottlenose dolphins are one of the most well-studied marine mammal species (Chilvers and Corkeron Citation2002) and are widely distributed around the world. This species can be found in almost all warm temperate and tropical seas (Rice Citation1998; Wells et al. Citation2019; Wells and Scott Citation2009). Bottlenose dolphins are primarily coastal, but they can also occur in pelagic waters (Wells et al. Citation2019). In New Zealand waters, there are four discrete populations of coastal bottlenose dolphins, found in the north-east coast of the North Island, Marlborough Sounds, Fiordland, and Stewart Island (Baker et al. Citation2019; Bräger and Schneider Citation1998; Brough et al. Citation2015; Constantine Citation2002; Tezanos-Pinto Citation2009). Genetic analyses show low gene flow among at least three of the populations (excluding the Stewart Island population, which was not included in this analysis; Tezanos-Pinto Citation2009). In recent years, new hotspots for the species have been identified around New Zealand at Great Barrier Island (GBI) (Dwyer et al. Citation2014), Stewart Island (Brough et al. Citation2015), and the Kermadec Islands (Baker et al. Citation2010, Citation2019). Bottlenose dolphins are classified as Nationally Endangered in New Zealand waters due to the decline in the abundance of the populations in the Bay of Islands and in Doubtful Sound, areas where dolphins have been monitored long-term (Constantine Citation2002; Currey et al. Citation2007; Hamilton Citation2013; Hartel et al. Citation2015; Tezanos-Pinto et al. Citation2013). Currently, there is an estimate of around 1000 bottlenose dolphins in New Zealand (Baker et al. Citation2019).
In this study, we focused on two populations of bottlenose dolphin: those present at Great Barrier Island (GBI), which are part of the north-eastern population, and those present in Doubtful Sound (DS), Fiordland. These two populations differ in factors such as habitat type, social organisation, population size, and anthropogenic pressures. GBI is characterised by moderately exposed to sheltered bays, inlets, and a rocky shoreline (Nichol et al. Citation2003). An estimation of abundance in this area was 60–131 dolphins, depending on the season (Dwyer Citation2014). Dolphins in GBI associate in groups that change in size and composition frequently. In contrast, DS is characterised by shores formed by almost vertical rock walls that can reach a depth of up to 100 m (Elliott et al. Citation2011). The population residing in DS is composed of approximately 60 dolphins (Brough et al. Citation2016) that form large, mixed-sex groups where all members are closely associated and community structure is temporally stable (Johnston et al. Citation2017; Lusseau et al. Citation2003).
Here we compare whistle types and acoustic characteristics of two geographically and genetically isolated populations of bottlenose in New Zealand for the first time. We predict that the vocal characteristics of the two populations will differ due to differences in geographic location. We report on three aspects of dolphin bioacoustics: (1) the classification of whistles of two populations using seven time-frequency parameters; (2) a comparison of whistles of two discrete bottlenose dolphin populations; one at GBI in North-east North Island, the other at DS in Fiordland, and (3) a comparison of whistle characteristics of New Zealand bottlenose dolphin populations with others from around the world.
Materials and methods
Study site
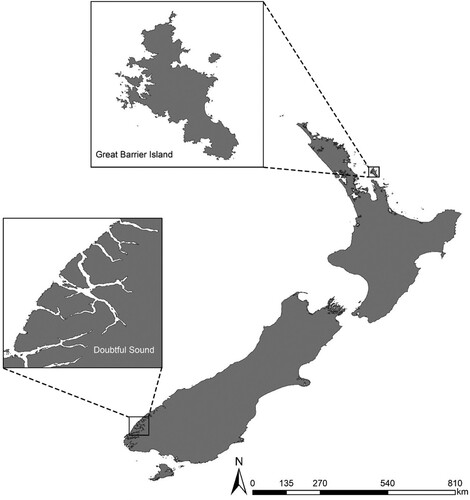
The bottlenose dolphin populations at GBI (36°12′S 175°25′E) and DS (45°30S, 167°00E) are approximately 1,200 km apart () with little, if any, gene flow (Tezanos-Pinto et al. Citation2009). Great Barrier Island is situated in the outer Hauraki Gulf, approximately 80 km east of Auckland, New Zealand. Acoustic data were collected from dolphins in and around the bays and rocky outcrops on the western side of the island. Water depth is up to 60 m (Chart NZ 522, Land Information New Zealand) and sea water temperatures range from 15°C in August to 22°C in February. Although, GBI is the largest island in the Hauraki Gulf, human population density is low, and there are no commercial marine mammal tourism operations in the area (Dwyer et al. Citation2014). Doubtful Sound is the second longest sound (40.3 km) in Fiordland National Park and has two main openings to the Tasman Sea. It is bounded by edges of almost vertical rock walls that can reach depths of 100 m (Elliott et al. Citation2011). During winter and spring, the average sea water temperature reaches 13°C while during summer and autumn the average is 15°C.
Figure 1. Map of New Zealand showing the locations where acoustic data was collected. Inset: Doubtful Sound, bottom, and Great Barrier Island, top.
Acoustic data collection
Acoustic recordings at GBI were collected during boat-based surveys between November 2017 and May 2019, when weather conditions were suitable (i.e. good visibility and a sea state of Beaufort ≤ 3). When a group of dolphins was sighted, boat speed was decreased and a slow approach to the group was made. The following information was recorded in every encounter: date, time of day, group composition (adult, juveniles, calf, and neonate), group size, and GPS location. The same approach method was used for Doubtful Sound recordings.
Acoustic recordings at GBI were made using a C55 hydrophone (Cetacean Research Technology, Seattle, USA) in November 2017 and a SoundTrap 300 HF (Ocean Instrument, Auckland, New Zealand) for the rest of the study. The C55 hydrophone had an effective sensitivity of −165 dB re 1 V/μPa and sounds were recorded using a TASCAM DR-44WL 4-track Portable Digital Recorder with a frequency response up to 96 kHz/24-bit resolution Broadcast WAV Format File for 4 channels (two channels were used for recording). The SoundTrap 300 HF is a self-contained hydrophone set to record continuously at a high gain (+12 dB) with a sample rate of 576 kHz and with 16-bit resolution. Settings also included a high pass filter (400 Hz), effective sensitivity of −171 dB re 1 V/µPa, and a flat frequency response of 400 Hz–150 kHz ± 3 dB. Hydrophones were deployed during the observations and were recording continuously with the boat engine off while the dolphins stayed in a bay or if they stayed within 100 m from the research vessel. Recordings lasted between 2 and 4 h.
Acoustic recordings from DS were collected between December 2011 to November 2012 during systematic surveys of the Doubtful Sound complex using a custom-built stereo-hydrophone array consisting of two hydrophone elements separated by 5 m and towed by a 50 m cable behind the research vessel (Guerra et al. Citation2014). The recorder had two hydrophone elements, each recorded on separate channels. Each hydrophone node contained a 40 dB pre-amplifier with a 3 dB/octave high-pass filter (corner frequency: 3.39 kHz). Sounds were recorded using an Edirol R44 digital recorder with a frequency response up to 48 kHz/16-bit. Recordings for DS typically lasted 2 h (see Guerra et al. Citation2014 for more details).
Acoustic analysis
Recordings were inspected visually and aurally using Raven Pro 1.6 (Cornell Lab of Ornithology, Ithaca, USA). Spectrograms were created to visualise the whistles using a Hann window (Bopardikar et al. Citation2018; Dong et al. Citation2021; Kaplan and Reiss Citation2017; Luís et al. Citation2021) with Fast Fourier Transformations (FFT) of 1024 and 50% overlap (Luís et al. Citation2021) and a frequency range from 0 to 46 kHz. The whistles were selected within the spectrograms and measured using Raven Pro 1.6. Whistles were defined as narrow-band tonal signals longer than 0.1 s in duration, often with harmonics (Gridley et al. Citation2015; Janik and Sayigh Citation2013; Neves Citation2013) and where at least part of the fundamental frequency is above 3 kHz (Gridley et al. Citation2012). Whistles were graded as (1) signal is faint but visible on the spectrogram; (2) signal is clear and unambiguous; (3) signal is prominent and dominates (Gridley et al. Citation2015) based on their signal-to-noise ratio (SNR). Sounds graded 2 and 3 were included in our analyses. Whistles were also discarded if they overlapped with other whistles, the contours were unclear (especially start and end points), or clipped (Bazúa-Durán and Au Citation2002). Whistles were considered separate units if the gap between other vocalisations was >200 ms (Bazúa-Durán and Au Citation2002).
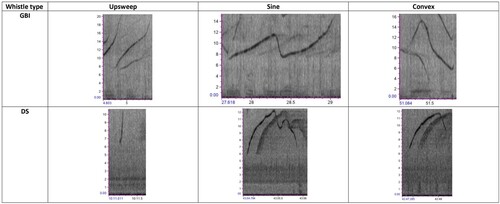
Seven parameters were measured for every whistle selected for analysis: Minimum frequency (MinF in Hz), maximum frequency (MaxF in Hz), frequency range (FR in Hz), start frequency (SF in Hz), end frequency (EF in Hz), number of inflection points (IF), and duration (D in seconds). Whistles were assigned to one of six published whistle types (Bazúa-Durán and Au Citation2002; Dong et al. Citation2021) by JPP an experienced dolphin bioacoustician. Whistle type category based on fundamental time-frequency contours were as follows: (1) Constant Frequency whistle, where the frequency changed by <25% over the duration of the signal; (2) Upsweep whistle, where the frequency is modulated and with the instantaneous frequency increasing over time with no large inflection points; (3) Downsweep whistle, have frequency modulated but with the instantaneous frequency decreasing with no large inflection points; (4) Convex whistle, with the frequency initially decreasing to an inflection point, and then increasing; (5) Concave whistle, with the frequency initially increasing to an inflection point, then decreasing; and (6) Sine whistle is frequency modulated with more than one repetition of a hill or a valley and the contour similar to a sinusoidal signal with at least two inflection points. Examples of the whistle types are shown in .
Figure 2. Examples of non-signature whistles found in the studied populations. Y-axis units kHz; X-axis units s.
Statistical analysis
All analyses were carried out using R statistical software version 4.1.0. (R core Team 2017). Minimum values, maximum values, standard deviations (SD), and coefficient of variations (CV) for each whistle parameter were calculated for each population to describe inter- and intra-population variability. A Kruskal-Wallis test was used to assess the difference between acoustic parameters for each whistle type (May-Collado and Wartzok Citation2008). To compare different whistle parameters among the different populations, a two tailed t-test (t) for equal variances and a Cochran-Cox t-test (t′) for unequal variances were employed using the mean value, standard deviation (SD) and sample size (n) of each population to calculate the p value. To classify whistles to a specific population, I used Random Forest (RF) analysis (Oswald et al. Citation2021; Rankin et al. Citation2017; Webster et al. Citation2016) using the ‘randomForest()’ function in the RF package (Liaw and Wiener Citation2002). Random Forest is a machine-learning method that creates a series of decision trees that work collectively to identify underlying relationships between the features and the target variable and is widely used in acoustic studies (Papale et al. Citation2021; Rankin et al. Citation2013; Serra et al. Citation2020; Webster et al. Citation2016; Yang et al. Citation2020). Each individual decision tree produces a class prediction and the class prediction with most ‘votes’ becomes the model’s prediction (Breiman Citation2001). The advantage of RF analysis is its capacity to model complex interactions among variables and provide high classification accuracy (Webster et al. Citation2016). Any bias arising due to low samples sizes is mitigated by creating bootstrap samples within the RF function.
In our study, 66.6% of the data were used to train the supervised RF model and the remaining data were used to validate the model. Study area was used as the response variable; hence, each tree was grown using a classification method (the response variable is categorical), and our seven acoustic parameters and whistle type was used as a predictor variable. The number of predictor variables to be searched at each node (mtry) was three and the number of bootstrap replicates or trees to grow (ntree) was set to 500. ‘Out-of-bag’ (OOB) estimates were used to monitor error from the bootstrap training set. Bagging is useful since this enhances accuracy when random features are used. Also, bagging may be used to provide continuous estimates of the generalisation error of the combined ensemble of trees, as well as estimates of strength and correlation (Breiman Citation2001). We used the Gini Variable Importance Index to understand the contribution of each variable to the model prediction (Breiman Citation2001; Oswald et al. Citation2021) and mean decrease in accuracy to understand what variables provide more accuracy to the models. Whereby, higher values of mean decrease accuracy or mean decrease Gini score, the greater the importance of the variable in the model (Breiman Citation2001).
Since acoustic variables are highly correlated, we used a principal component analysis (PCA) to reduce the number of variables (La Manna et al. Citation2020). We used a Non-linear Iterative Partial Least Squares (NIPALS) algorithm to generate the principal components as this algorithm allows for incomplete data to remain in the analysis (Stacklies et al. Citation2007). We used the package ‘ade4’ (Dray and Siberchicot Citation2020) for these analyses. Two components of the PCA (PC1 and PC2) were retained for further analysis and together these explained 99.99% of the total variance. We used linear mixed effects models to test the association between PC1 and PC2 and geographical area and social variables (group size and presence of juveniles and calves) with a Gaussian distribution (La Manna et al. Citation2020). Group size was used as the random variable in the models. Previous studies have shown that the number of individuals can influence signal modulation (Papale et al. Citation2020). Asindividuals can belong to different group sizes, we assumed that dolphins could have different whistle characteristics. We used the package ‘lme4’ (Bates et al. Citation2007) to develop the models.
To test for differences in the level of variation in acoustic parameters of our target populations of bottlenose dolphins with others from around the world, we compared the coefficients of variations from the current study and published studies from New Zealand and elsewhere. We used summary statistics (mean, SD, and sample size) as raw measurement data were not available for all studies. We compared the level of variation in six whistles parameters between populations using the function ‘asymptotic()’ in the package ‘cvequality’ (Marwick and Krishnamoorthy Citation2019) in R. A hierarchical cluster analysis was performed to visualise differences or similarities among populations using the squared Euclidean distance matrix to compute the distance between each pair of rows, and Ward’s method (Dong et al. Citation2021) that minimises the total within cluster variance and attempts to create equal size clusters. The mean values of six whistle acoustic parameters were used for the hierarchical cluster analysis: minimum, maximum, start and end frequency, frequency range and duration. The analysis was done using the ‘hclust’ function in the ‘stats’ package (v.4.1.0., R core Team, 2017).
Results
Recordings of bottlenose dolphins were obtained from the GBI location during nine encounters, totalling 34 h and 48 min. In DS, recordings were obtained from 25 dolphin encounters totalling 60 h and 15 min. For analysis, 577 whistles were selected from GBI and 509 whistles from DS. Group size and composition varied with location. For GBI, group size averaged 49 dolphins (range 7–81) and the average number of immatures present in groups was 3.7 juveniles and 2.9 calves. For DS, group size averaged 24 dolphins (range 6–54) and the average number of immatures present in groups was 2.3 juveniles and 0.48 calves (Guerra Citation2013). All the groups sampled at GBI contained at least one immature, hence, we were not able to compare whistles characteristics of groups with and without calves.
Description of whistle parameters at GBI and DS
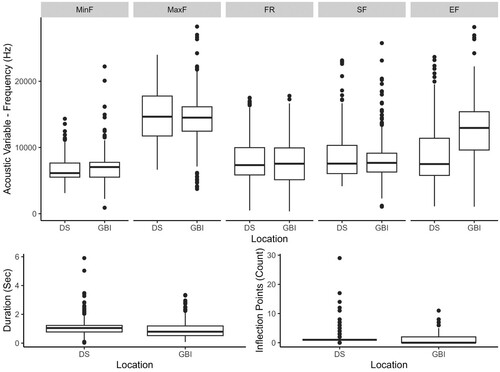
Dolphin whistles at GBI averaged 0.9 s in duration (range 0.082 s to 3.34 s). Whistle MinF averaged 6.9 kHz and MaxF averaged 14.4 kHz (). Twenty-six whistles (4.5%) had a MaxF over 20 kHz (ultrasonic range). Whistles without inflexion points accounted for 42.8% (n = 247) of the total whistles, the remaining whistles (n = 330) had between one and 11 inflection points. In comparison, whistles from DS were slightly longer, with an average 1.1 s in duration and lasting between 0.03 and 5.9 s (t-test, p < 0.05). Mean values of MaxF and MinF were similar between both populations (t-test, p > 0.4 and p > 0.05, respectively), but SF and EF were lower at GBI (t-test, p < 0.05) while FR was higher (t-test, p < 0.05). The DS population presented whistles with considerably more inflexion points than GBI (29 and 11 inflection points, respectively: ).
Figure 3. Graphical representation (box and whisker plot) of the variation of whistle parameters measured at two locations in New Zealand. DS: Doubtful Sound and GBI: Great Barrier Island. MinF: Minimum frequency; MaxF: Maximum frequency; FR: Frequency range; SF: Start frequency; and EF: End frequency. The box represents the middle 50% of each data set, the lines are median values, and the whiskers indicate the range of the data. Outliers are indicated by dots.
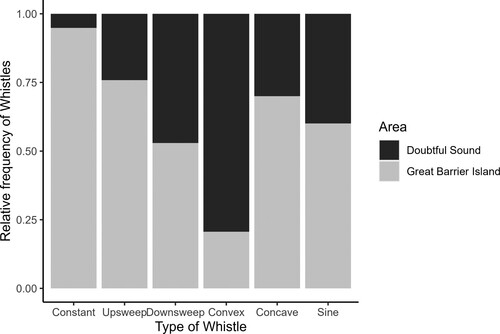
All six whistle types were found in both populations. In GBI, upsweep whistles were the most common type, accounting for 43.1% (n = 248) of all whistles. This was followed by sine whistles (26.4%, n = 152), then convex (12.5%, n = 72), downsweep (7.8%, n = 45), constant (6.4%, n = 37), and concave (3.6%, n = 21) types (). For DS, convex whistles comprised more than half of all whistles (54.5%, n = 277), followed by sine (19.9%, n = 101), upsweep (15.6%, n = 79), and concave (1.8%, n = 9) and constant (0.4%, n = 2) whistles. All whistle parameters varied between the six whistle contours analysed at both GBI and DS (Kruskal- Wallis tests, p < 0.05 for both areas). Upsweep whistles at GBI had higher mean values in all the parameters measured (frequency characteristics, duration, and number of inflection points) compared to other whistle types, whereas downsweep had higher values in all the parameters at DS. Convex whistles had similar values in both populations in MinF, MaxF and FR, but SF and D were higher at DS. Mean values for concave whistles were higher for GBI except for MinF. Lastly, for sine whistles, MaxF, FR, SF and D mean values were higher at DS than GBI. Appendices 1a and 1b presents a summary of the descriptive statistics for all the acoustic parameters measured per whistle type for each location.
Figure 4. Relative frequency of whistle type at Doubtful Sounds = DS (n = 509) and Great Barrier Island = GBI (n = 577).
Assigning bottlenose dolphins whistles to GBI or DS using Random Forest models
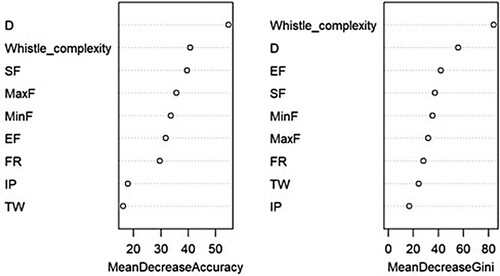
Random forest (RF) models correctly assigned dolphin whistles to location with 90% accuracy. The most important variables for classification were whistle type contour, duration, and end frequency (). Whistle characteristics with high mean decrease accuracy (i.e. duration, whistle complexity, and start frequency) contribute to differentiating between populations (Appendix 2).
Figure 5. Random Forest variable importance plot. On the left, mean decrease accuracy where the points represent the loss of accuracy in the model if a variable is removed. On the right, mean decrease Gini value indicates the importance of each variable in the model.
We obtained two principal components from the NIPALS PCA analysis (). The first principal component (PC1) explained 55.6% of the variance and is mainly influenced by MaxF. The second component (PC2) explained 44.4% of the variance and is influenced by MinF and duration (). We built LMMs using PC1 and PC2 as response variables to assess the effect of location, group size, and presence of immatures (i.e. juveniles and calves). We developed two models using PC1 and PC2 as response variables with location and presence of immatures as fixed effects and group size as the random effect. PC1 was not different between locations or with the presence of immatures. However, PC2 suggests MinF is higher, and duration is lower in GBI than DS (GLM Location estimate = 0.52, SD = 0.22, t = 2.4, d.f. = 21.1, p = 0.02).
Figure 6. Distribution of the mean whistle parameters along Principal Component 1 and Principal Component 2. Doubtful Sound = DS, Great Barrier Island = GBI. Refer to and the Acoustic analysis section of the Methods for details of the seven acoustic parameters used in the PCA
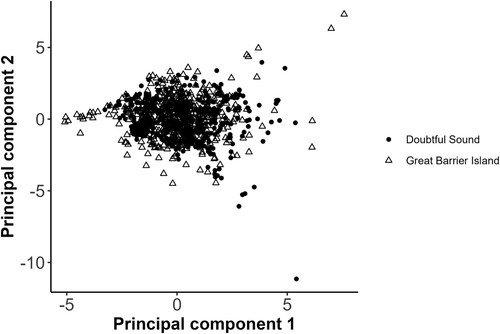
Table 1. Loading scores, total variance explained and eigen values from a NIPALS PCA of acoustics parameters in whistles of bottlenose dolphins from GBI and DS.
Global comparison of bottlenose dolphin whistles
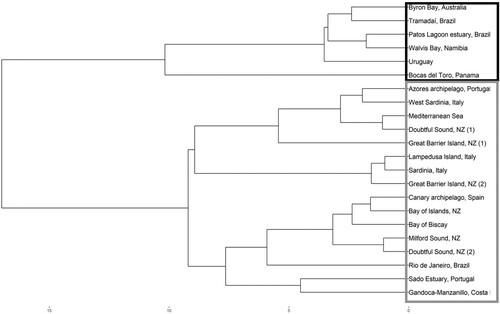
We used a hierarchical cluster analysis to visualise similarities in bottlenose whistle parameters (duration and five frequency parameters–MinF, MaxF, FR, SF, and EF) among 21 populations of bottlenose dolphins worldwide (Appendix 3). Twenty were published studies and one (GB2) from an earlier unpublished study of the GBI population (Outhwaite Citation2018). A dendrogram of the populations shows a split into two main clusters (). One cluster contains only populations from the Southern Hemisphere and the equatorial (albeit Northern hemisphere) population of Bocas del Toro, Panama, while the other cluster contains primarily populations from the northern hemisphere, one population from Brazil and all of the New Zealand populations.
Figure 7. Hierarchical cluster visualisation of population similarity based on the mean values of six time-frequency parameters for 21 populations of bottlenose. Coloured rectangles show two main clusters. The Byron Bay population corresponds to Tursiops aduncus and it was used as external group for the analyses.
Note: (1) This study (2) Previous studies carried out in the study areas.
Discussion
The acoustic parameters measured for our New Zealand populations of bottlenose dolphins fall within the range of those described for this species globally. However, at a local scale, our study populations exhibited significant acoustic differences and our Random Forest analysis achieved a 90% accuracy in assigning whistles to the respective population based the parameters we measured. Whistles from DS were longer in duration and had more inflection points than whistles from GBI. At a global scale, the acoustic parameters of the whistles from the New Zealand populations clustered with populations found in the Northern Hemisphere, rather than to those in the Southern Hemisphere.
Bottlenose dolphin whistles recorded at GBI ranged in frequency from 0.9 to 28.3 kHz, with most of the whistles occurring between 5 and 18 kHz. In contrast, the DS dolphin whistles were at frequencies from 3.1 to > 24.0 kHz (upper limit set by equipment). Although, whistles have usually been described as occurring from 2 to 20 kHz, it is known that dolphins can hear whistles as low as 100 Hz and produce whistles up to 200 kHz (Herzing Citation1996; Johnson Citation1968; Turl Citation1993). Ultrasonic whistles (>20 kHz) have been reported in some bottlenose dolphins population (Hiley et al. Citation2017). Furthermore, the GBI dolphin population exhibited different whistle characteristics compared to other north-eastern bottlenose dolphin populations. For example, in the Bay of Islands, coastal bottlenose dolphins exhibit whistles with higher mean frequency values in maximum frequency, start frequency, and end frequency, compared to GBI (Peters Citation2018). Variations in the whistle parameters may be attributed to behavioural state (Díaz López Citation2011), differences in data collection methods, annual variation, and anthropogenic pressures, but two widely supported hypotheses have been proposed to explain larger scale differences: the acoustic adaptation hypothesis and social complexity hypothesis.
Geographic variations can be explained by the acoustic adaptation hypothesis, where animal acoustic signals are adapted to their environment to minimise degradation and maximise signal transmission and long-range communication (Hardt and Benedict Citation2021). This hypothesis could potentially apply to the differences we found between GBI and DS populations where habitat characteristics, such as depth, differ significantly between study sites. For example, Bonato et al. (Citation2015) found correlations between whistle parameters and depth in a population of spinner dolphins. Similarly, water temperature and salinity are different between GBI and DS and, considering that the speed of sound increases with increasing temperature or salinity, further studies should investigate the influence of these variables on the frequency parameters of whistles. In addition, dolphins at DS are subject tohigher levels of boat activity compared to GBI, an activity that elsewhere has been demonstrated to result in dolphins modifying their vocalisations and vocal behaviour (May-Collado and Quiñones-Lebrón Citation2014; Pérez-Ortega et al. Citation2021). Guerra et al. (Citation2014) also found that major changes in the duration, lower, and upper frequencies of whistles of bottlenose dolphins at DS occurred in the presence of boats.
The social complexity hypothesis predicts that with increasingly complex social structure it is necessary to increase communication complexity (Blumstein Citation2003; Freeberg et al. Citation2012). Social factors such as presence of immature animals and the social characteristics of a population can influence acoustic signals (Gridley et al. Citation2016; La Manna et al. Citation2020; Quick and Janik Citation2008; Romeu et al. Citation2017). Guerra et al. (Citation2014) found that at DS, groups of dolphins exposed to boat noise behave differently depending on the presence or absence of calves. They also found that dolphin groups with calves generally produced whistles with higher frequencies and had longer whistles than groups without calves. It has been hypothesised that longer whistles might help group cohesion in social groups (May-Collado et al. Citation2007). The social structure of our two geographically distinct populations differed. The DS population exhibits one of the highest levels of association among its members for a bottlenose dolphin population worldwide (Lusseau et al. Citation2003). However, we were not able to statistically test for the effect of group composition (presence/absence of calves) on whistles characteristics as all GBI groups contained at least one immature. Nonetheless, bottlenose dolphins at GBI exhibit a more fluid, but structured population (Patiño-Pérez Citation2022) than the DS population (Guerra Citation2013). Interestingly, the DS population was found to have more complex whistle structures with whistles with one or more inflection points, although we can only speculate that this represents higher communication complexity. Whistles at GBI had a higher minimum frequency and shorter duration than those from DS. Further sampling of a range of groups with more diverse social composition is required to understand the effects of the presence of immature dolphins on whistle parameters.
Cultural transmission occurs when a behaviour is learned from conspecifics (Enggist-Dueblin and Pfister Citation2002) and has been suggested as a mechanism of variability in acoustic parameters (Luís et al. Citation2021). Cultural transmission is responsible for geographic variation in acoustic signals and has been reported in a diversity of marine mammal species including humpback whales (Noad et al. Citation2000; Rendell and Whitehead Citation2001), orcas (Deecke et al. Citation2000) and grey seals Halichoerus grypus (Stansbury and Janik Citation2021). Bottlenose dolphins are known for their ability to learn new vocalisations (Tyack Citation1998) and whistle types can be shared within or between social groups (McCowan and Reiss Citation1997). Studies of bottlenose dolphins have also found indications of sex-specific pathways of cultural transmission (Sayigh et al. Citation1995). We speculate that the high degree of plasticity in whistle forms are likely to culturally evolve in isolated populations and this may explain the difference between GBI and DS and the clustering of these isolated populations with those from the Northern Hemisphere. We were unable to assign a single driver for the acoustic variation among whistles sampled from the two populations of bottlenose dolphins. Multiple factors are likely to influence both local and geographic variation. Nonetheless, our research provides a benchmark for future research. Further understanding of the role of vocal plasticity is needed through more field-based studies focused on sound transmission and the processes that drive variation.
The study of vocalisations by group living marine animals have inherent limitations. For example, from hydrophone-based recordings, it is not possible to know what specific dolphin produced a particular sound, and results are based on group results. This limitation hinders understanding the individual contribution of dolphins to the patterns observed. Furthermore, due to the limitations in the recording equipment used at Doubtful Sound, the upper frequency of the whistles was often clipped making them unusable for some of our analyses. Only selected social factors (i.e. group size and presence of immatures) were taken into consideration to explain the geographic variation in both populations. Factors such as behaviour, presence of boats, water temperature and depth, among others have been suggested as sources of variability but they were not considered, and future research should assess the influence of these variables. Finally, Great Barrier Island is just one of the areas where bottlenose dolphins are found in the North Island, therefore, this study only included a portion of dolphins making up the North Island population and efforts should be made to integrate all the information available and identify the gaps with the aim of improving the management of this species in this area.
To further understand the changes between populations it would be ideal to study the full acoustic repertoire of bottlenose dolphins and to include the population located within the Marlborough Sounds; a population yet to be studied. In addition, acoustic data could be combined with studies of the distribution of the species to better understand the causes of signal variation in this population. Peters (Citation2018) studied the distribution and acoustic behaviour of bottlenose dolphins in the most northern part of New Zealand, but, again, this is only a small part of the distribution of the species in New Zealand. Expanding the geographic coverage of acoustic sampling is challenging, and one approach is to standardise recording methodology and develop a combined database of acoustic information through the New Zealand bottlenose dolphin’s range.
Authors have suggested that genetically distinct populations exhibit acoustic variability (La Manna et al. Citation2020). However, the genetic diversity of bottlenose dolphins in New Zealand is poorly understood. Genetic studies need to be carried out in the North Island, and together with acoustic data, they will tell us more about the dynamics of the population. Nonetheless, many questions about distribution, movements, social and genetic structure, and acoustic differentiation between the northeastern bottlenose dolphin population have arisen. This information will help to determine the population status and will have implications for the management strategies of this endangered species. It is important to continue studying the variation of acoustic signals of cetaceans and future studies should include those factors suggested earlier that were not included in this study.
Supplemental material
Download MS Word (32.4 KB)Acknowledgments
We thank to Motu Kaikoura Trust for the logistic support provided during the field work seasons. We also would like to thank the volunteers that helped during data collection for this study.
Disclosure statement
No potential conflict of interest was reported by the author(s).
Data availability statement
The datasets analysed during the current study are available from the corresponding author.
Additional information
Funding
References
- Acevedo-Gutiérrez A, Stienessen SC. 2004. Bottlenose dolphins (Tursiops truncatus) increase number of whistles when feeding. Aquatic Mammals. 30(3):357–362. doi:10.1578/AM.30.3.2004.357.
- Au WWL, Hastings MC. 2008. Principles of marine bioacoustics. (Vol. 510). New York: Springer.
- Baker CS, Boren L, Childerhouse S, Constantine R, Van Helden A, Lundquist D, Rayment W, Rolfe JR. 2019. Conservation status of New Zealand marine mammals, 2019. www.doc.govt.nz.
- Baker CS, Chilvers BL, Constantine R, DuFresne S, Mattlin RH, Van Helden A, Hitchmough R. 2010. Conservation status of New Zealand marine mammals (suborders Cetacea and Pinnipedia), 2009. New Zealand Journal of Marine and Freshwater Research. 44(2):101–115. doi:10.1080/00288330.2010.482970.
- Bates D, Sarkar D, Bates MD, Matrix L. 2007. The lme4 package. R Package Version. 2(1):74.
- Bazúa-Durán C. 2004. Differences in the whistle characteristics and repertoire of Bottlenose and Spinner Dolphins. Anais da Academia Brasileira de Ciências. 76:386–392. doi:10.1590/S0001-37652004000200030.
- Bazúa-Durán C, Au WWL. 2002. The whistles of Hawaiian spinner dolphins. The Journal of the Acoustical Society of America. 112(6):3064–3072. doi:10.1121/1.1508785.
- Blumstein DT. 2003. Social complexity but not the acoustic environment is responsible for the evolution of complex alarm communication. Adaptive Strategies and Diversity in Marmots. 31–38.
- Bonato M, Papale E, Pingitore G, Ricca S, Attoumane A, Ouledi A, Giacoma C. 2015. Whistle characteristics of the spinner dolphin population in the Comoros Archipelago. The Journal of the Acoustical Society of America. 138(5):3262–3271. doi:10.1121/1.4935518.
- Bopardikar I, Sutaria D, Sule M, Jog K, Patankar V, Klinck H. 2018. Description and classification of Indian Ocean humpback dolphin (Sousa plumbea) whistles recorded off the Sindhudurg coast of Maharashtra, India. Marine Mammal Science. 34(3):755–776. doi:10.1111/mms.12479.
- Bräger S, Schneider K. 1998. Near-shore distribution and abundance of dolphins along the West Coast of the South Island, New Zealand. New Zealand Journal of Marine and Freshwater Research. 32(1):105–112. doi:10.1080/00288330.1998.9516809.
- Breiman L. 2001. Random forests. Machine Learning. 45(1):5–32. doi:10.1023/A:1010933404324.
- Brough TE, Guerra M, Dawson SM. 2015. Photo-identification of bottlenose dolphins in the far south of New Zealand indicates a ‘new’, previously unstudied population. New Zealand Journal of Marine and Freshwater Research. 49(1):150–158. doi:10.1080/00288330.2014.984728.
- Brough TE, Henderson S, Guerra M, Dawson SM. 2016. Factors influencing heterogeneity in female reproductive success in a critically endangered population of bottlenose dolphins. Endangered Species Research. 29(3):255–270. doi:10.3354/esr00715.
- Buckstaff KC. 2004. Effects of watercraft noise on the acoustic behavior of bottlenose dolphins, Tursiops truncatus, in Sarasota Bay, Florida. Marine Mammal Science. 20(4):709–725. doi:10.1111/j.1748-7692.2004.tb01189.x.
- Caldwell MC, Caldwell DK. 1979. The whistle of the Atlantic bottlenosed dolphin (Tursiops truncatus)—ontogeny. In: Behavior of marine animals: current perspectives in research. Boston, MA: Springer US; p. 369–401.
- Chereskin E, Connor RC, Friedman WR, Jensen FH, Allen SJ, Sørensen PM, King SL, et al. 2022. Allied male dolphins use vocal exchanges to “bond at a distance”. Current Biology. 32(7):1657–1663. doi:10.1016/j.cub.2022.02.019.
- Chilvers BL, Corkeron PJ. 2002. Association patterns of bottlenose dolphins (Tursiops aduncus) off Point Lookout, Queensland, Australia. Canadian Journal of Zoology. 80(6):973–979. doi:10.1139/z02-075.
- Clark CW, Clark JM. 1980. Sound playback experiments with southern right whales (Eubalaena australis). Science. 207(4431):663–665. doi:10.1126/science.207.4431.663.
- Constantine R. 2002. The behavioural ecology of the bottlenose dolphins (Tursiops truncatus) of northeastern New Zealand: a population exposed to tourism [Doctoral dissertation]. ResearchSpace@ Auckland.
- Currey RJC, Dawson SM, Slooten E. 2007. New abundance estimates suggest DS bottlenose dolphins are declining. Pacific Conservation Biology. 13(4):265–273.
- Deecke VB, Ford JKB, Spong P. 2000. Dialect change in resident killer whales: implications for vocal learning and cultural transmission. Animal Behaviour. 60(5):629–638. doi:10.1006/anbe.2000.1454.
- Díaz López B. 2011. Whistle characteristics in free-ranging bottlenose dolphins (Tursiops truncatus) in the Mediterranean Sea: influence of behaviour. Mammalian Biology. 76(2):180–189. doi:10.1016/j.mambio.2010.06.006.
- Dong L, Caruso F, Dong J, Liu M, Lin M, Li S. 2021. Whistle characteristics of a newly recorded Indo-Pacific humpback dolphin (Sousa chinensis) population in waters southwest of Hainan Island, China, differ from other humpback dolphin populations. Marine Mammal Science. 37(4):1341–1362. doi:10.1111/mms.12816.
- Dray S, Siberchicot MA. 2020. Package ‘ade4’.. Lyon: Université de Lyon, France.
- Dutchen R. 2021. Pre-and post-partum observations of signature whistle characteristics of the bottlenose dolphin (Tursiops truncatus).
- Dwyer SL. 2014. Spatial ecology and conservation of cetaceans using the Hauraki Gulf, New Zealand [Doctoral dissertation]. Massey University.
- Dwyer SL, Tezanos-Pinto G, Visser IN, Pawley MDM, Meissner AM, Berghan J, Stockin KA. 2014. Overlooking a potential hotspot at GBI for the nationally endangered bottlenose dolphin of New Zealand. Endangered Species Research. 25(2):97–114. doi:10.3354/esr00613.
- Elliott RG, Dawson SM, Henderson S. 2011. Acoustic monitoring of habitat use by bottlenose dolphins in DS, New Zealand. New Zealand Journal of Marine and Freshwater Research. 45(4):637–649. doi:10.1080/00288330.2011.570351.
- Enggist-Dueblin P, Pfister U. 2002. Cultural transmission of vocalizations in ravens, Corvus corax. Animal Behaviour. 64(6):831–841. doi:10.1006/anbe.2002.2016.
- Freeberg TM, Dunbar RIM, Ord TJ. 2012. Social complexity as a proximate and ultimate factor in communicative complexity. Philosophical Transactions of the Royal Society B: Biological Sciences. 367(1597):1785–1801. doi:10.1098/rstb.2011.0213.
- Gridley T, Berggren P, Cockcroft VG, Janik VM. 2012. Whistle vocalizations of Indo-Pacific bottlenose dolphins (Tursiops aduncus) inhabiting the south-west Indian Ocean. The Journal of the Acoustical Society of America. 132(6):4032–4040. doi:10.1121/1.4763990.
- Gridley T, Cockcroft VG, Hawkins ER, Blewitt ML, Morisaka T, Janik VM. 2014. Signature whistles in free-ranging populations of Indo-Pacific bottlenose dolphins, Tursiops aduncus. Marine Mammal Science. 30(2):512–527. doi:10.1111/mms.12054.
- Gridley T, Elwen SH, Rashley G, Badenas Krakauer A, Heiler J. 2016, July. Bottlenose dolphins change their whistling characteristics in relation to vessel presence, surface behavior and group composition. Proceedings of Meetings on Acoustics 4ENAL. Vol. 27. Acoustical Society of America. p. 010030.
- Gridley T, Nastasi A, Kriesell HJ, Elwen SH. 2015. The acoustic repertoire of wild common bottlenose dolphins (Tursiops truncatus) in Walvis Bay, Namibia. Bioacoustics. 24(2):153–174. doi:10.1080/09524622.2015.1014851.
- Guerra M. 2013. Effects of vessels on the surface and vocal behaviour of bottlenose dolphins in DS, New Zealand [Master thesis]. University of Otago.
- Guerra M, Dawson SM, Brough TE, Rayment WJ. 2014. Effects of boats on the surface and acoustic behaviour of an endangered population of bottlenose dolphins. Endangered Species Research. 24(3):221–236. doi:10.3354/esr00598.
- Hamilton ON. 2013. Abundance, population dynamics, and social structure of bottlenose dolphins (Tursiops truncatus) in the Bay of Islands, New Zealand [Master thesis]. University of Auckland.
- Hardt B, Benedict L. 2021. Can you hear me now? A review of signal transmission and experimental evidence for the acoustic adaptation hypothesis. Bioacoustics. 30(6):716–742. doi:10.1080/09524622.2020.1858448.
- Hartel EF, Constantine R, Torres LG. 2015. Changes in habitat use patterns by bottlenose dolphins over a 10-year period render static management boundaries ineffective. Aquatic Conservation: Marine and Freshwater Ecosystems. 25(5):562–572. doi:10.1002/aqc.2465.
- Hawkins ER. 2010. Geographic variations in the whistles of bottlenose dolphins (Tursiops aduncus) along the east and west coasts of Australia. The Journal of the Acoustical Society of America. 128(2):924–935. doi:10.1121/1.3459837.
- Hawkins ER, Gartside DF. 2010. Whistle emissions of Indo-Pacific bottlenose dolphins (Tursiops aduncus) differ with group composition and surface behaviors. The Journal of the Acoustical Society of America. 127(4):2652–2663. doi:10.1121/1.3308465.
- Hernández EN, Solangi M, Kuczaj SA. 2010. Time and frequency parameters of bottlenose dolphin whistles as predictors of surface behavior in the Mississippi Sound. The Journal of the Acoustical Society of America. 127(5):3232–3238. doi:10.1121/1.3365254.
- Herzing DL. 1996. Vocalizations and associated underwater behavior of free-ranging Atlantic spotted dolphins, Stenella frontalis and bottlenose dolphins, Tursiops truncatus. Aquatic Mammals. 22:61–80.
- Hiley HM, Perry S, Hartley S, King SL. 2017. What’s occurring? Ultrasonic signature whistle use in Welsh bottlenose dolphins (Tursiops truncatus). Bioacoustics. 26(1):25–35. doi:10.1080/09524622.2016.1174885.
- Janik VM. 2000. Source levels and the estimated active space of bottlenose dolphin (Tursiops truncatus) whistles in the Moray Firth, Scotland. Journal of Comparative Physiology A. 186(7–8):673–680. doi:10.1007/s003590000120.
- Janik VM. 2009. Acoustic communication in delphinids. Advances in the Study of Behavior. 40:123–157. doi:10.1016/S0065-3454(09)40004-4.
- Janik VM, Sayigh LS. 2013. Communication in bottlenose dolphins: 50 years of signature whistle research. Journal of Comparative Physiology A. 199(6):479–489. doi:10.1007/s00359-013-0817-7.
- Janik VM, Sayigh LS, Wells RS. 2006. Signature whistle shape conveys identity information to bottlenose dolphins. Proceedings of the National Academy of Sciences. 103(21):8293–8297. doi:10.1073/pnas.0509918103.
- Janik VM, Slater PJB. 1998. Context-specific use suggests that bottlenose dolphin signature whistles are cohesion calls. Animal Behaviour. 56(4):829–838. doi:10.1006/anbe.1998.0881.
- Johnson CS. 1968. Masked tonal thresholds in the bottlenosed porpoise. The Journal of the Acoustical Society of America. 44(4):965–967. doi:10.1121/1.1911236.
- Johnston DR, Rayment W, Slooten E, Dawson SM. 2017. A time-based method for defining associations using photo-identification. Behaviour. 154(9–10):1029–1050. doi:10.1163/1568539X-00003455.
- Kaplan DJ, Reiss D. 2017. Whistle acoustic parameters in Atlantic spotted dolphins (Stenella frontalis) and bottlenose dolphins (Tursiops truncatus) in two locations in the bahamas and comparisons with other populations. Aquatic Mammals. 43(4):364–377. doi:10.1578/AM.43.4.2017.364.
- King SL, Janik VM. 2015. Come dine with me: food-associated social signalling in wild bottlenose dolphins (Tursiops truncatus). Animal Cognition. 18(4):969–974. doi:10.1007/s10071-015-0851-7.
- La Manna G, Rako Gospić N, Manghi M, Picciulin M, Sarà G. 2017. Assessing geographical variation on whistle acoustic structure of three Mediterranean populations of common bottlenose dolphin (Tursiops truncatus). Behaviour. 154(5):583–607. doi:10.1163/1568539X-00003435.
- La Manna G, Rako-Gospić N, Sarà G, Gatti F, Bonizzoni S, Ceccherelli G. 2020. Whistle variation in Mediterranean common bottlenose dolphin: The role of geographical, anthropogenic, social, and behavioral factors. Ecology and Evolution. 10(4):1971–1987. doi:10.1002/ece3.6029.
- Liaw A, Wiener M. 2002. Classification and regression by randomForest. R News. 2(3):18–22.
- Lima IMS, Venuto R, Menchaca C, Hoffmann LS, Dalla Rosa L, Genoves R, Fruet PF, Milanelli A, Laporta P, Tassino B, et al. 2020. Geographic variation in the whistles of bottlenose dolphins (Tursiops spp.) in the southwestern Atlantic Ocean. Marine Mammal Science. 36(3):1058–1067. doi:10.1111/mms.12690.
- Luís AR, May-Collado LJ, Rako-Gospić N, Gridley T, Papale E, Azevedo A, Silva MA, Buscaino G, Herzing D, dos Santos ME. 2021. Vocal universals and geographic variations in the acoustic repertoire of the common bottlenose dolphin. Scientific Reports. 11(1):11847. doi:10.1038/s41598-021-90710-9.
- Lusseau D, Schneider K, Boisseau OJ, Haase P, Slooten E, Dawson SM. 2003. The bottlenose dolphin community of DS features a large proportion of long-lasting associations: can geographic isolation explain this unique trait? Behavioral Ecology and Sociobiology. 54(4):396–405. doi:10.1007/s00265-003-0651-y.
- Marwick B, Krishnamoorthy K. 2019. Cvequality: tests for the equality of coefficients of variation from multiple groups. R Package Version 0.2. 0.
- May-Collado LJ, Agnarsson I, Wartzok D. 2007. Phylogenetic review of tonal sound production in whales in relation to sociality. BMC Evolutionary Biology. 7(1):1–20. doi:10.1186/1471-2148-7-136.
- May-Collado LJ, Quiñones-Lebrón SG. 2014. Dolphin changes in whistle structure with watercraft activity depends on their behavioral state. The Journal of the Acoustical Society of America. 135(4):EL193–EL198. doi:10.1121/1.4869255.
- May-Collado LJ, Wartzok D. 2008. A comparison of bottlenose dolphin whistles in the Atlantic Ocean: factors promoting whistle variation. Journal of Mammalogy. 89(5):1229–1240. doi:10.1644/07-MAMM-A-310.1.
- McCowan B, Reiss D. 1997. Vocal learning in captive bottlenose dolphins: a comparison with humans and nonhuman animals.
- Morisaka T, Shinohara M, Nakahara F, Akamatsu T. 2005b. Geographic variations in the whistles among three Indo-Pacific bottlenose dolphin Tursiops aduncus populations in Japan. Fisheries Science. 71:568–576. doi:10.1111/j.1444-2906.2005.01001.x.
- Neves S. 2013. Acoustic behaviour of Risso’s dolphins, Grampus griseus, in the Canary Islands, Spain [Doctoral dissertation]. University of St Andrews.
- Nichol SL, Lian OB, Carter CH. 2003. Sheet-gravel evidence for a late Holocene tsunami run-up on beach dunes, Great Barrier Island, New Zealand. Sedimentary Geology. 155(1–2):129–145. doi:10.1016/S0037-0738(02)00191-4.
- Noad MJ, Cato DH, Bryden MM, Jenner M-N, Jenner KCS. 2000. Cultural revolution in whale songs. Nature. 408(6812):537. doi:10.1038/35046199.
- Oswald JN, Walmsley SF, Casey C, Fregosi S, Southall B, Janik VM. 2021. Species information in whistle frequency modulation patterns of common dolphins. Philosophical Transactions of the Royal Society B: Biological Sciences. 376(1836):20210046. doi:10.1098/rstb.2021.0046.
- Outhwaite B. 2018. The ecology of bottlenose dolphins (Tursiops truncatus) in the Hauraki Gulf, New Zealand [Master thesis]. Massey University.
- Papale E, Azzolin M, Cascão I, Gannier A, Lammers MO, Martin VM, Oswald J, Perez-Gil M, Prieto R, Silva MA, Giacoma C. 2014. Acoustic divergence between bottlenose dolphin whistles from the Central–Eastern North Atlantic and Mediterranean Sea. Acta Ethologica. 17(3):155–165. doi:10.1007/s10211-013-0172-2.
- Papale E, Fanizza C, Buscaino G, Ceraulo M, Cipriano G, Crugliano R, Carlucci R, et al. 2020. The social role of vocal complexity in striped dolphins. Frontiers in Marine Science. 7:584301. doi:10.3389/fmars.2020.584301.
- Papale EB, Azzolin MA, Cascão I, Gannier A, Lammers MO, Martin VM, Oswald JN, Perez-Gil M, Prieto R, Silva MA, et al. 2021. Dolphin whistles can be useful tools in identifying units of conservation. BMC Zoology. 6(1):1–13. doi:10.1186/s40850-021-00085-7.
- Patiño-Pérez J. 2022. Social interactions in New Zealand common bottlenose dolphins (Tursiops truncatus): association dynamics, skin diseases and aggressive injuries, and variations in vocal signals [Doctoral dissertation]. Massey University.
- Pérez-Ortega B, Daw R, Paradee B, Gimbrere E, May-Collado LJ. 2021. Dolphin-watching boats affect whistle frequency modulation in bottlenose dolphins. Frontiers in Marine Science. 8:102. doi:10.3389/fmars.2021.618420.
- Peters CH. 2018. Context-specific signal plasticity of two common bottlenose dolphin ecotypes (Tursiops truncatus) in Far North waters, New Zealand [Doctoral dissertation]. Massey University.
- Quick NJ, Janik VM. 2008. Whistle rates of wild bottlenose dolphins (Tursiops truncatus): Influences of group size and behavior. Journal of Comparative Psychology. 122(3):305. doi:10.1037/0735-7036.122.3.305.
- Quintana-Rizzo E, Mann DA, Wells RS. 2006. Estimated communication range of social sounds used by bottlenose dolphins (Tursiops truncatus). The Journal of the Acoustical Society of America. 120(3):1671–1683. doi:10.1121/1.2226559.
- Rankin S, Archer F, Barlow J. 2013. Vocal activity of tropical dolphins is inhibited by the presence of killer whales, Orcinus orca. Marine Mammal Science. 29(4):679–690. doi:10.1111/j.1748-7692.2012.00613.x.
- Rankin S, Archer F, Keating JL, Oswald JN, Oswald M, Curtis A, Barlow J. 2017. Acoustic classification of dolphins in the California current using whistles, echolocation clicks, and burst pulses. Marine Mammal Science. 33(2):520–540. doi:10.1111/mms.12381.
- R Core Team, 2016. R: A language and environment for statistical computing, Vienna, Austria. Available at: https://www.Rproject.org/.
- Rendell L, Whitehead H. 2001. Culture in whales and dolphins. Behavioral and Brain Sciences. 24(2):309–324. doi:10.1017/S0140525X0100396X.
- Rice DW. 1998. Marine mammals of the world: systematics and distribution. Society for Marine Mammalogy. 4:1–231.
- Romeu B, Cantor M, Bezamat C, Simões-Lopes PC, Daura-Jorge FG. 2017. Bottlenose dolphins that forage with artisanal fishermen whistle differently. Ethology. 123(12):906–915. doi:10.1111/eth.12665.
- Sayigh LS, Esch HC, Wells RS, Janik VM. 2007. Facts about signature whistles of bottlenose dolphins, Tursiops truncatus. Animal Behaviour. 74(6):1631–1642. doi:10.1016/j.anbehav.2007.02.018.
- Sayigh LS, Tyack PL, Wells RS, Scott MD, Irvine AB. 1995. Sex difference in signature whistle production of free-ranging bottlenose dolphins, Tursiops truncates. Behavioral Ecology and Sociobiology. 36(3):171–177. doi:10.1007/BF00177793.
- Serra OM, Martins FPR, Padovese LR. 2020. Active contour-based detection of estuarine dolphin whistles in spectrogram images. Ecological Informatics. 55:101036. doi:10.1016/j.ecoinf.2019.101036.
- Stacklies W, Redestig H, Scholz M, Walther D, Selbig J. 2007. pcaMethods—a bioconductor package providing PCA methods for incomplete data. Bioinformatics. 23(9):1164–1167. doi:10.1093/bioinformatics/btm069.
- Stansbury AL, Janik VM. 2021. The role of vocal learning in call acquisition of wild grey seal pups. Philosophical Transactions of the Royal Society B: Biological Sciences. 376(1836):20200251. doi:10.1098/rstb.2020.0251.
- Tezanos-Pinto G. 2009. Population structure, abundance and reproductive parameters of bottlenose dolphins (Tursiops truncatus) in the Bay of Islands (Northland, New Zealand) [Doctoral dissertation]. University of Auckland.
- Tezanos-Pinto G, Baker CS, Russell K, Martien K, Baird RW, Hutt A, Stone G, Mignucci-Giannoni AA, Caballero S, Endo T, et al. 2009. A worldwide perspective on the population structure and genetic diversity of bottlenose dolphins (Tursiops truncatus) in New Zealand. Journal of Heredity. 100(1):11–24. doi:10.1093/jhered/esn039.
- Tezanos-Pinto G, Constantine R, Brooks L, Jackson JA, Mourão F, Wells S, Scott Baker C. 2013. Decline in local abundance of bottlenose dolphins (Tursiops truncatus) in the Bay of Islands, New Zealand. Marine Mammal Science. 29(4):E390–E410. doi:10.1111/mms.12008.
- Turl CW. 1993. Low-frequency sound detection by a bottlenose dolphin. The Journal of the Acoustical Society of America. 94(5):3006–3008. doi:10.1121/1.407333.
- Tyack PL. 1998. Acoustic communication under the sea. In: Animal acoustic communication: sound analysis and research method. Berlin, Heidelberg: Springer; p. 163–220.
- Vasconcelos RO, Carriço R, Ramos A, Modesto T, Fonseca PJ, Amorim MCP. 2012. Vocal behavior predicts reproductive success in a teleost fish. Behavioral Ecology. 23(2):375–383. doi:10.1093/beheco/arr199.
- Ward R, Parnum I, Erbe C, Salgado-Kent C. 2016. Whistle characteristics of indo-pacific bottlenose dolphins (Tursiops aduncus) in the Fremantle Inner Harbour, Western Australia. Acoustics Australia. 44(1):159–169. doi:10.1007/s40857-015-0041-4.
- Webster TA, Dawson SM, Rayment WJ, Parks SE, Van Parijs SM. 2016. Quantitative analysis of the acoustic repertoire of southern right whales in New Zealand. The Journal of the Acoustical Society of America. 140(1):322–333. doi:10.1121/1.4955066.
- Wells RS, Natoli A, Braulik G. 2019. Tursiops truncatus (errata version published in 2019). IUCN Red List Threat. Species, 8235, e-T22563A156932432.
- Wells RS, Scott MD. 2009. Common bottlenose dolphin Tursiops truncatus. In: Perrin W, Wursig B, Thewissen JGM, editors. Encyclopedia of marine mammals. 2nd ed. Academic Press; p. 249–255.
- Wilkins MR, Seddon N, Safran RJ. 2013. Evolutionary divergence in acoustic signals: causes and consequences. Trends in Ecology & Evolution. 28(3):156–166. doi:10.1016/j.tree.2012.10.002.
- Yang L, Sharpe M, Temple AJ, Jiddawi N, Xu X, Berggren P. 2020. Description and classification of echolocation clicks of Indian Ocean humpback (Sousa plumbea) and Indo-Pacific bottlenose (Tursiops aduncus) dolphins from Menai Bay, Zanzibar, East Africa. PLoS ONE. 15(3):e0230319. doi:10.1371/journal.pone.0230319.
- Yuan J, Wang Z, Duan P, Xiao Y, Zhang H, Huang Z, Wang D, et al. 2021. Whistle signal variations among three Indo-Pacific humpback dolphin populations in the South China Sea: a combined effect of the Qiongzhou Strait's geographical barrier function and local ambient noise? Integrative Zoology. 16(4):499–511. doi:10.1111/1749-4877.12531.