
 ?Mathematical formulae have been encoded as MathML and are displayed in this HTML version using MathJax in order to improve their display. Uncheck the box to turn MathJax off. This feature requires Javascript. Click on a formula to zoom.
ABSTRACT
Low-density steels are considered an attractive potential replacement for conventional steel in industries such as the automotive sector. However, there are several issues that need to be overcome before they become commercially useful grades. A significant constraint is in their processability, for example, a large as-cast grain size means these steels are prone to hot cracking. This paper explores how compositional variations affect the as-cast grain size in 12 low-density steels cast at solidification rates representative of near net shape casting. It is shown that while mushy zone width is a good indicator of the cast grain size, using a mushy zone width from liquidus to 85% solidified fraction gives a better correlation. It was found that the as-cast grain size of a 7 wt-% Al steel can be reduced from 736 to 244 µm through the addition of 1.5 wt-% Si which acts to increase the mushy zone width by 19°C.
Introduction
The automotive industry still relies on steel for many components owing to its low cost, good specific strength and formability, and its recyclability. However, with the increasing demands the automotive industry faces to meet CO2 emissions regulations, lower mass components are becoming increasingly critical.
Although cars are now being manufactured from a wide range of materials, certain components need a combination of good specific modulus (for stiffness) and strength as well as having certain geometrical constraints/optimisations which reduces the possible material options. Recent development of low-density steels offers the potential advantages of the excellent mechanical properties associated with steel (yield stresses up to 1 GPa and elongation as high as 100% have been reported [Citation1]) and lower mass components (reduction in density of 1.3% per weight per cent of aluminium). Of particular interest are the bake hardenable (BH) low-density steels which would be suitable for car body panels. These BH low-density steels are fully ferritic owing to their high-aluminium content (typically >6% Al) and low-carbon content.
One of the inherent problems with the fully ferritic low-density steels is their large grain size [Citation2,Citation3]. As these steels do not undergo any phase transformation after solidification there is no grain refinement other than through recrystallisation. However, it has also been reported that Al increases the recrystallisation stop temperature in these steels, therefore reducing the number of rolling passes that contribute to grain refinement through recrystallisation [Citation1,Citation4]. The final properties in these steels therefore are heavily dependent on the as-cast microstructure, and efforts need to be made in order to minimise the cast grain size.
Near net shape casting technologies, such as belt casting, have been shown to offer many advantages that would benefit low-density steels [Citation5–9]. The high cooling rates (>50°C/s) will help reduce grain size [Citation10], while the process route reduces the stresses imparted on to the steel during the casting process therefore reducing the likelihood of hot tearing [Citation5,Citation6,Citation9]. This paper examines the influence of composition on the as-cast grain size through its effect on solidification parameters (liquidus temperature, segregation, mushy zone width, etc.) at high cooling rates representative of those seen in belt casting (>50°C/s).
Experimental
Twelve alloys were chosen to investigate the influence composition has on the as-cast grain size and have been summarised in . The compositions of these alloys were quantified by EDX on a Zeiss Sigma FEG-SEM and by an Oxford Instruments Foundry Master Pro Optical Emission Spectrometer (for more accurate carbon measurements).
Table 1. Summary of alloys cast in the strip cast simulator.
These alloys were chosen for two reasons; first they offer a systematic analysis into the influence of the two major elemental additions to reduce density in steel (i.e. Al, Si). Second in the quantities chosen, the cast ferritic grains are stable to room temperature and thus the cast grain size can be more easily determined. The alloys allow a fundamental understanding of the compositional effects on solidification grain structure and are not intended as commercial systems.
The alloys were fabricated using a Topcast TMF10P induction furnace. Approximately 500 g of electrolytically pure iron was melted before adding the relevant ferro-alloy additions needed to achieve the target composition. The molten steel was then held at 20°C above its predicted liquidus temperature before casting into the mould seen in . Both a thermocouple and thermal imaging camera were used to measure cooling rate. In all cases the cooling rate through solidification was 150°C/s (±10°C/s). This high cooling rate both acts to more closely replicate the solidification conditions in near net shape casting (belt casting >50°C/s, strip casting >150°C/s), as well as ensuring subsequent solid state grain growth is limited allowing the as-cast grain structure to be measured.
Figure 1. Schematic diagram show the mould used to replicate the accelerated cooling rates seen in near net shape castings.
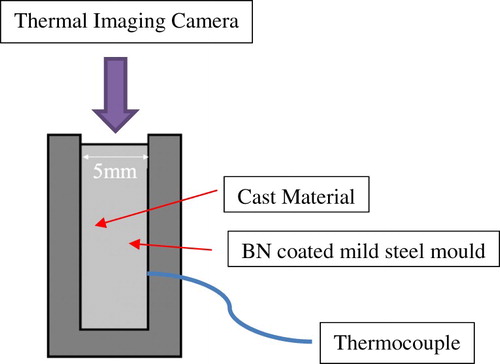
Cross-sections of the casting were taken at the mid-height and quarter-width position for each of the alloys and prepared for optical metallography by grinding and polishing to a final 0.25 μm finish. Swabbing with Graf-Sargent Reagent for 15 s was used to reveal the grain structure. The columnar grain widths were measured 1 mm away from the cast surface on both sides in order to achieve a minimum of 150 grain measurements per cast while outside of the direct chill region.
Results and discussion
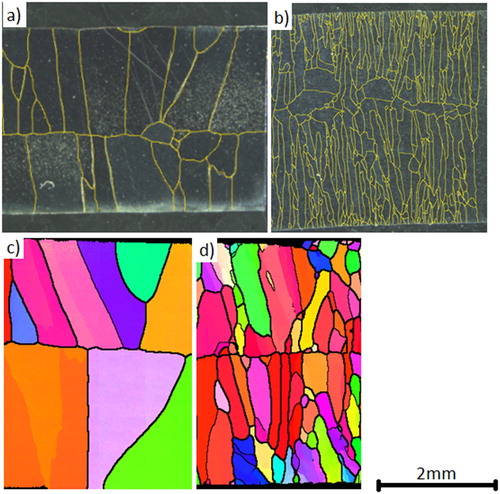
shows typical optical micrographs and Electron Backscatter Diffraction (EBSD) scans taken from these casts. As it can be seen, a strongly columnar grain structure exists with very few equiaxed grains at the centre of the casting; the lack of any substantial equiaxed zone is owing to the thin (5 mm) casting and is representative of the microstructure expected during near net shape casting [Citation11–13].
Figure 2. (a) and (b) Optical micrograph of cast numbers 1 and 9, respectively. (b) and (c) EBSD scans of casts 2 and 12, respectively.
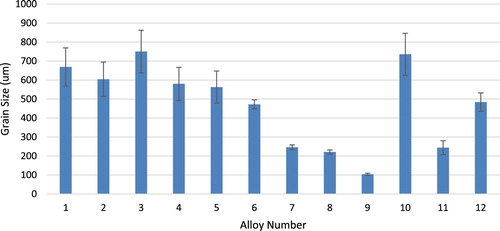
shows the measured grain size for the alloys listed in , significant differences in grain size are seen despite the constant cooling rate therefore showing a clear dependence on the compositional differences. Alloys 1–5 have increasing amounts of aluminium however show very little variation in grain size, while alloys 6–8 have increasing amounts of Si and a clear dependence can be seen in the grain size. The role of the alloying elements will be discussed below.
Figure 3. Measured grain size for the range of alloys fabricated in this study.
The growth restriction factor (GRF) is an analytical method that has been used in the aluminium industry [Citation14] and has been shown to provide a good correlation with the cast grain size [Citation15], albeit predominantly for binary systems used in conjunction with inoculants. The GRF can be calculated by the following equation:(1)
(1) where the mi is the gradient of the liquidus line for a given compositional addition (i), Coi is the initial composition of element i and ki is the partition coefficient.
This equation can be adapted for a multicomponent system by summing the individual contributions of all the elemental additions present [Citation16,Citation17]. Several assumptions are made in the calculation of the GRF; first it is assumed that no thermal gradient exists at the solidified front, second that (where ΔTc is the level of undercooling, Tm is the melting point of the pure element and T0 is the liquidus of the bulk alloy). Equation (1) has been correlated with grain size primarily of equiaxed grains, however, as seen in the grain structure in these casts is dominated by the columnar grains that formed in the high-thermal gradient during casting. shows the relationship between GRF and grain size for the alloys tested in this study using the input parameters seen in . No significant correlation can be seen, which suggests that the GRF in its current form is not suitably transferable from its current use in processing of aluminium alloys to steel compositions such as those seen in this study. This may be caused by the non-linear values of ki and mi in these materials as well as potential synergistic interactions for the alloying elements.
Figure 4. Correlation between the GRF and grain size for the steel composition in .
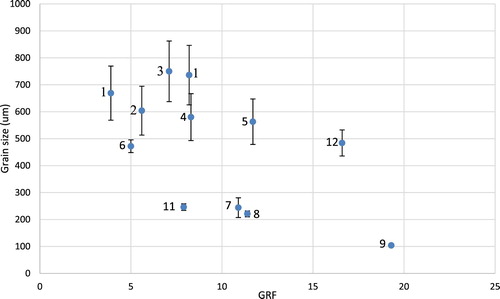
Table 2. Summary of the liquidus and partition coefficients of the alloying elements used in this study [Citation18,Citation19].
In addition the assumption that may also not be valid for all these steels. Tm of pure iron is around 1538°C and for many of the Al alloyed steels T0 falls in the region of 1545–1530°C and therefore in some cases it is possible to have a ΔTc less than a zero. Therefore the scatter in the plot may come from the value of T0 lowering and thus becoming more compliant to the GRF criteria.
In the case of thin casts such as the ones produced in this study and near net shape casting, the grain size is highly dependent on the number of nucleation points and the subsequent growth. In order to control grain width then it is important to determine the growth in the direction normal to the thermal gradient. For fast growing grains (or slow nucleating grains) more potential nucleation sites will be consumed by already established grains before further nucleation/growth of less favourable nucleated grains, which will result in a large cast grain structure. An approximation of grain growth velocity during solidification can be calculated via Equation (2) [Citation20]. It should be noted that this equation does not include a thermal gradient parameter, but as the growth direction of interest in this study is perpendicular to the thermal gradient this is not required.(2)
(2) where V is the velocity of the growth front, D is the diffusivity of solute elements in the liquid, Γ is the Gibbs-Thomson coefficient, R is the radius of the dendrite tip and
is the mushy zone width.
From this equation it is evident that several factors can influence the velocity of the interface and it is therefore important to understand which are composition dependent. The diffusivity of an alloy in the liquid and Gibbs-Thomson coefficient are both relatively insensitive to composition [Citation19]. k has been seen to vary by no more than 2× for a given alloy addition [Citation18] and R also is most heavily dependent on the growth velocity and temperature gradient again varying no more than 2× within the dendritic solidification regime [Citation21]. The mushy zone width is a key variable in determining the velocity of the growth front. Steels can show a large range of mushy zone widths, with low-alloy steels showing ΔT0 of just a couple of degrees [Citation22] to stainless/high-alloy steels which have ΔT0 > 80°C [Citation23,Citation24]. shows the correlation between mushy zone width and grain size for the steels cast in this study. ThermoCalc 2017a (TCFE9) was used to calculate the ΔT0 in these steels using the composition given in . The x-axis error bars refer to the uncertainly in EDX measurement of the residual elements found in these steels (P, S and C all typically <0.005 unless intentionally added).
Figure 5. Comparison between the as-cast grain size and mushy zone width calculated via ThermoCalc. The y-axis error bars refer to the standard deviation of the grain size measurements and the x-axis error bars refer to the uncertainly in the level of residual elements present in steels. Alloy 12, highlighted, does not fit well with the general trend of decreasing grain size with increasing mushy zone width.
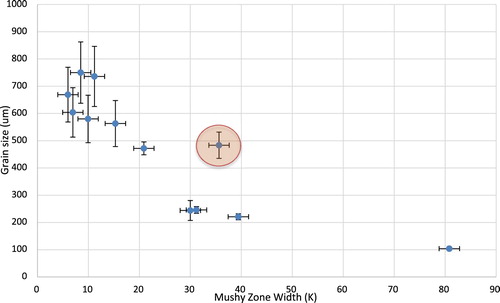
(and summarised in ) shows a clear trend between the grain size and ΔT0, with a much stronger correlation being seen than between the GRF and grain size (), although there is one alloy in particular (Alloy 12, highlighted in ) that can be seen to deviate from a good fit.
It can be seen in that for the addition of Al up to 10.7 wt-% (Casts 1–5) the mushy zone width increases only slightly, this results in a similar grain size across these samples. A small mushy zone width gives a fast interface velocity such that the distance a grain can grow will be highly dependent on the probability of another favourable nucleation event happening locally in this short period of time, and thus a larger scatter in the grain size is expected, as seen by the large standard deviation values in for these steels. Considering the Si grades (Casts 6–8) then the increase in Si content has a much more marked influence on ΔT0 and thus grain size with an increase of Si from 2.9 to 6.2 wt-% more than halving the cast grain size. The slower growth velocity associated with the larger mushy zone width allows a longer time for another local nucleation event to occur and hence another grain to develop and therefore produces a smaller and much more uniform grain size distribution, as shown by the smaller standard deviation value for these steels in .
Phosphorus has a significant influence on the ΔT0 and thus Cast 9 was produced with 0.3 wt-% P addition compared to Cast 8 to show the effect of P on the grain size. It can be seen that the addition of 0.3 wt-% P results in the grain size decreasing by more than half owing to the large increase in ΔT0.
Cast 10 has a composition similar to that found in ferritic automotive low-density steel grades and has a large cast grain size (736 µm) which is known to cause problems during continuous casting [Citation1,Citation3]. Cast 11 shows that through the addition of 1.5 wt-% Si then this grain size (under the same casting conditions) can be reduced to around a third of its size (244 µm).
Table 3. Summary of the casts used in this study, the measured grain size and the predicted mushy zone width.
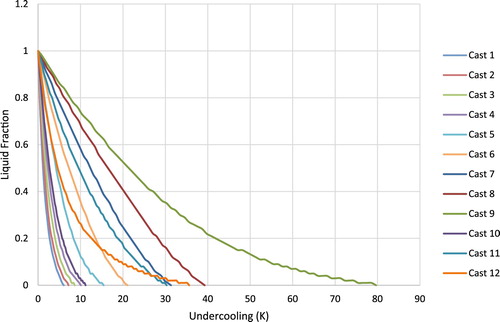
From all the casts show a consistent trend between mushy zone width and grain size (accounting for scatter) except for Cast 12, which contains 0.1 wt-% C. It has a ΔT0 that would be expected to give a smaller grain size than measured, hence this alloy does not fit the trend seen for the other alloys in . shows the predicted fraction liquid for each alloy against the amount of undercooling from its liquidus temperature. It can be seen that the majority of the alloys have a relatively linear relationship between liquid fraction and undercooling. However, Cast 12 (and to some extent Cast 9) shows a much less linear relationship. Up until 50% solidified Cast 12 behaves similar to that of Cast 5 (Fe–10.7Al), however, the rate of solidification for the remaining liquid slows quite dramatically. Using the full mushy zone width as an indicator of grain size assumes that the grain size is determined equally throughout solidification. This is not likely to be the case, nucleation and growth at the beginning of solidification will have a larger influence on the final microstructure as any nucleation events that occur in the final fraction of liquid will only have a limited impact on the grain size as these nucleated grains will not be able to grow significantly and will be unstable and hence are likely to be consumed by growing grains after final solidification. While a rapid cooling rate is seen for the thin castings it might be expected that very small grains will be lost.
Figure 6. Solidification with undercooling under equilibrium conditions for all 12 casts.
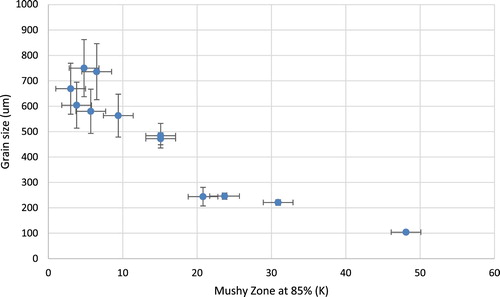
To determine whether better correlation between the grain size and mushy zone can be obtained an optimisation process was carried out between the mushy zone width at different liquid fractions and grain size. When looking at this correlation then the best fit was seen when at a solid fraction of 85% and suggests that any grains formed in the last 15% are too small to remain stable (as this is in mainly interdendritic regions), and are quickly annihilated. The non-linearity of casts 9 and 12 means that the new mushy zone at 85% is much smaller than that of 100%. shows the relationship between grain size and the mushy zone width determined from the liquidus temperature to the 85% solid temperature. It can be seen that a much less scatter exists compared to that when using the 100% solid temperature, .
Figure 7. Grain size as a function of the mushy zone width determined from the liquidus to 85% solidified fraction temperatures.
Conclusions
Twelve alloys of varying compositions have been cast with cooling conditions representative of those during near net shape casting (approximately 150°C/s through solidification) to investigate the relationship between as-cast grain size and solidification parameters influenced by composition. The alloys contain either Al or Si to allow a ferritic microstructure to be maintained to room temperature, which means the as-cast grain size can be analysed. The following conclusions can be made.
The growth restriction parameter commonly used in the aluminium industry shows a poor correlation with the as-cast grain size in the steel alloys investigated.
Mushy zone width shows a clear trend with cast grain size for the majority of alloys investigated, although the alloy containing carbon deviated from the general trend.
Using the mushy zone width determined from the liquidus to 85% solid fraction temperature range instead of the full mushy zone width gave a better correlation with cast grain size, in particular for the carbon containing alloy.
Aluminium was seen to have a very limited influence on the mushy zone width and therefore as-cast grain size. Silicon showed a much more pronounced influence with phosphorus showing the greatest impact.
An increase in 19°C (from 11°C to 30°C) in mushy zone width through the addition of 1.5 wt-% Si was found to reduce the average grain size from 736 to 244 µm in a 7 wt-% Al 0.5 wt-% Mn steel.
Acknowledgements
The authors would like to thank Tata Steel for providing the steel samples used in this research, EPSRC for funding (grant number EP/P01206X/1), and WMG for the use of their facilities.
Disclosure statement
No potential conflict of interest was reported by the authors.
ORCID
Carl Slater http://orcid.org/0000-0002-7491-4919
Additional information
Funding
References
- Chen S, Rana R, Haldar A, et al. Current state of Fe-Mn-Al-C low density steels. Prog Mater Sci. 2017;89:345–391. doi:10.1016/j.pmatsci.2017.05.002.
- Rana R, Liu C, Ray RK. Low-density low-carbon Fe–Al ferritic steels. Scr Mater. 2013;68:354–359. doi:10.1016/j.scriptamat.2012.10.004.
- Rana R. Low-density steels. JOM. 2014;66:1730–1733. doi:10.1007/s11837-014-1137-2.
- English AT, Backofen W. Recrystallization in hot-worked silicon-iron. Trans Metall Soc AIME. 1964;230:396–407.
- Ge S., Isac M, Guthrie RIL. Progress in strip casting technologies for steel; technical developments. n.d. [cited 2014 April 4]. Available from: https://www.jstage.jst.go.jp/article/isijinternational/53/5/53_729/_article
- Ge S, Isac M, Guthrie RIL. Progress of strip casting technology for steel; historical developments. ISIJ Int. 2012;52:2109–2122. doi:10.2355/isijinternational.52.2109.
- Wans J, Geerkens C, Cremers H, et al. Belt casting technology – experiences based on the worldwide first BCT caster authors key words the first industrial-scale BCT ® caster. 2015:15–19.
- Gerber AG, Sousa ACM. A parametric study of the Hazelett thin-slab casting process. J Mater Process Technol. 1995;49:41–56. doi: 10.1016/0924-0136(94)01335-X
- Isac M, Guthrie RIL. The design of a new casting process: from fundamentals to practice. In: Treatise on process metallurgy. Elsevier. 2014: 555–583. doi:10.1016/B978-0-08-096984-8.00013-6.
- Easton M, Davidson C, StJohn D. Grain morphology of As-cast wrought aluminium alloys. Mater Trans. 2011;52:842–847. doi:10.2320/matertrans.L-MZ201118.
- Daamen M, Haase C, Dierdorf J, et al. Twin-roll strip casting: a competitive alternative for the production of high-manganese steels with advanced mechanical properties. Mater Sci Eng A. 2015;627:72–81. doi:10.1016/j.msea.2014.12.069.
- Daamen M, Nessen W, Pinard PT, et al. Deformation behavior of high-manganese TWIP steels produced by twin-roll strip casting. Procedia Eng. 2014;81:1535–1540. doi: 10.1016/j.proeng.2014.10.186
- Wang Y, Xu Y-B, Zhang Y-X, et al. Effect of annealing after strip casting on texture development in grain oriented silicon steel produced by twin roll casting. Mater Charact. 2015;107:79–84. doi:10.1016/j.matchar.2015.07.001.
- Chen Z, He Z, Jie W. Growth restriction effects during solidification of aluminium alloys. Trans Nonferrous Met Soc China (English Ed). 2009;19:410–413. doi:10.1016/S1003-6326(08)60287-3.
- St John DH, Qian M, Easton Ma, et al. The interdependence theory: the relationship between grain formation and nucleant selection. Acta Mater. 2011;59:4907–4921. doi:10.1016/j.actamat.2011.04.035.
- Quested TE, Dinsdale AT, Greer AL. Thermodynamic modelling of growth-restriction effects in aluminium alloys. Acta Mater. 2005;53:1323–1334. doi:10.1016/j.actamat.2004.11.024.
- Mitrašinović AM, Robles Hernández FC. Determination of the growth restriction factor and grain size for aluminium alloys by a quasi-binary equivalent method. Mater Sci Eng A. 2012;540:63–69. doi:10.1016/j.msea.2012.01.072.
- Battle TP, Pehlke RD. Equilibrium partition coefficients in iron-based alloys. Metall Mater Trans B. 1989;20:149–160. doi:10.1007/BF02825596.
- Thermo-Calc Software TCFE7 Steels/Fe-alloys database version 7; n.d. [cited 2016 Jan 08].
- Kurz W, Fisher D. Fundamentals of solidification. 4th ed. Switzerland-Germany-UK-USA: Trans Tech; 1986.
- Kurz W, Fisher DJ. Dendrite growth at the limit of stability: tip radius and spacing. Acta Metall. 1981;29:11–20. doi:10.1016/0001-6160(81)90082-1.
- Sugden AAB, Bhadeshia HKDH. Thermodynamic estimation of liquidus, solidus, Ae3 temperatures, and phase compositions for low alloy multicomponent steels. Mater Sci Technol. 1989;5:977–984. doi: 10.1179/026708389790339592
- Gryc K, Smetana B, Žaludová M, et al. Determination of the solidus and liquidus temperatures of the real-steel grades with dynamic thermal-analysis methods. Mater Technol. 2013;47:569–575.
- www.matweb.com, Matweb: Material Property Data; 2012.