?Mathematical formulae have been encoded as MathML and are displayed in this HTML version using MathJax in order to improve their display. Uncheck the box to turn MathJax off. This feature requires Javascript. Click on a formula to zoom.
ABSTRACT
This study examines the impact and implications of the East African Community and the Common Market for Eastern and Southern Africa preferential trade agreements on coffee export performance of eight East and Southern African countries. The analysis employed a static and dynamic gravity modelling framework for the period 1998–2013. Following several robustness checks, the study found that regional trade agreements play a vital role in increasing coffee trading in East and Southern African countries. Factors including geographical distances, income, and population size in importing and exporting countries are also statistically significant determinants of coffee exports. The study also found that the exporting countries are currently under-performing with respect to their maximum potential to the global market indicating room for improvement.
1. Introduction
Green coffee bean is one of the major cash crops in East and Southern African countries mainly produced for export purposes (Salami, Kamara, and Brixiova Citation2010). This crop constitutes a significant share of total export value in countries such as Ethiopia, Burundi, and Uganda, making the sector vital to their economy. The sector is also important in Kenya, Malawi, Rwanda, Tanzania, and Zambia in creating substantial employment and income generation opportunities for the farmers (FAO Citation2016). The sectoral role to the economy could further be enhanced through the elimination of various forms of trade barriers among coffee trading countries. With the initiation of the African Union (AU), countries across the continent have been working towards the formation of common trade areas by ratifying an agreement called the “African Continental Free Trade Area (AfCFTA) pact” which is expected to increase the trade flows between countries across the continent (African Union Citation2018).
There has been literature examining the coffee export performance in the East African countries (see, e.g., Bellemare, Barrett, and Just Citation2013; Boansi and Crentsil Citation2013; Jaramillo et al. Citation2011). These studies suggested that factors including climate variability, price volatility and declining competitiveness in the international coffee market have been contributing to the existing poor sectoral performance. Other studies also examined the coffee sector performance from individual country perspectives, and results indicated that absence of standards, supply chain constraints, lack of cooperatives, and poor coffee quality are the main determinants (see, e.g., Chiputwa, Spielman, and Qaim Citation2015; Minten et al. Citation2014; Mujawamariya, D’Haese, and Speelman Citation2013). The existing literature on the performance of the East African coffee sector, however, is mainly focused on the production side challenges such as climate variability, supply chain constraints, and modern technology adaption issues, while less attention has been put on the importance of regional trade agreements (RTA). Such a research gap in the current literature should be filled in order to allow effective trade policy design and implementation in the coffee sector.
Trade economist suggested that establishing common trade agreements and free economic zones can increase trade volume and improves the societal welfare among the traders through removal of different trade barriers (Baier, Bergstrand, and Mariutto Citation2014; Baier and Bergstrand Citation2007; Carrere Citation2006; Krueger Citation1997; Schott, Jung, and Cimino Citation2015; Whalley Citation1998). Notably, these agreements can create an open market, lower trade costs, eliminate trade barriers such as tariffs and customs duties, enhance jobs and ultimately improves the trade performances. In East and Southern Africa, the intra-industry trade has been initiated following the creation of trade agreements among countries in the region. These include the East African Community (EAC) and Common Markets for East and Southern Africa (COMESA). The ECA aims to bring custom union, common market, monetary union and finally political federation among member states, while COMESA has prior objectives of forming a free trade area (FTA), customs union (CU), trade promotion (TP) and bringing economic prosperity through regional integration among the member states. These economic communities encompass one of the largest markets in the region, with COMESA member countries alone accounting for around 500 million population.
Therefore, this study aims to investigate the impact of RTA among East and Southern African countries, i.e. COMESA and EAC, and other trade determinants such as internal market size, geographical distances, and cultural differences on coffee trade performance. Our analysis employs both the static and dynamic gravity modelling framework with consideration of the Multilateral Resistance Terms (MRT) (e.g. see, Anderson and Van Wincoop Citation2003; Baldwin Citation2006; Gallego, Rodríguez-Serrano, and Casanueva Citation2019; Olivero and Yotov Citation2012). In order to achieve these goals, we employed a panel data for eight East and Southern African countries for the period of 1998–2013. These data sets are obtained from the world development indicators (World Bank Citation2015) and “Centre d’Etudes Prospectives et d’ Informations Internationales” (CEPII) database (CEPII Citation2015).
The key contribution of this study is twofold. First, the study provides valuable empirical contributions to the existing literature by analysing how RTA could improve the coffee trade performance in East and Southern African exporting countries. Second, results from the study are expected to provide empirical support for policy design and implementation in the coffee sector that aims to increase trade performance through the creation of RTA. The study finally concludes by highlighting the prevailing trade barriers, performances, and potentials of the East and Southern African coffee exporting countries.
2. Review of the coffee farming sector
2.1 State of production at a global scale
Coffee is produced in more than 50 developing countries, providing income for approximately 25 million farmers (Petit Citation2007). This makes coffee production one of the main cash crop sector and a significant source of livelihood, employment and foreign exchange in most of developing countries. There are countries known for coffee production on a global scale. In this respect, countries from Latin America, Asia, and Sub-Saharan Africa constitute the largest producers of green coffee in terms of value and quantity, as illustrated in (FAO Citation2016). The figure illustrates that Brazil is the main producer of green coffee beans in 2013, followed by Vietnam, Indonesia, Colombia, and India. Importantly, the coffee sector accounts for a significant proportion of foreign earnings in some of the countries listed. For instance, in countries such as Ethiopia, Uganda, and Burundi, the share of coffee exports relative to total export earnings exceeded 10% in 2013, although the importance of coffee for other countries is still lower (FAO Citation2016; World Bank Citation2015).
Figure 1. Top green coffee producing countries of the world in 2013.
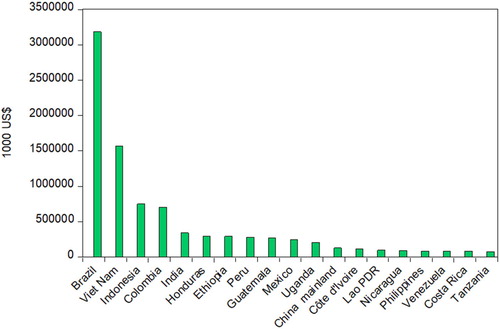
However, in those countries with more diversified agricultural export sectors, such as Vietnam, Brazil, Kenya, and Indonesia, the share becomes low in relative terms. summarises the share of coffee relative to total export earnings in some of the world’s main coffee exporting countries.
Figure 2. Share of coffee export in the total agricultural export earnings for selected countries in 2013.
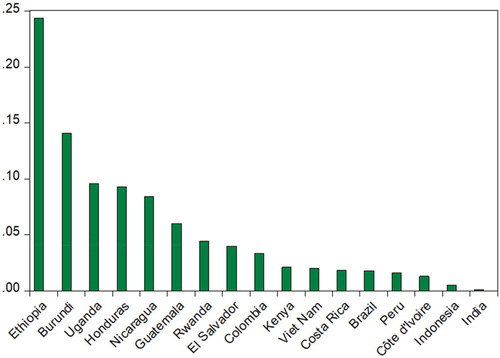
From the above figures, it is clear that coffee export constitutes a significant share in Ethiopia and Burundi, reflecting the importance of the sector to the economy. In Rwanda, the sector has a minimal export share value despite that the country’s agricultural landscape employs around 400,000 active coffee producers (Mujawamariya, D’Haese, and Speelman Citation2013).
In the context of East African countries, the agricultural sector continues to be the main contributor of foreign earnings (Salami, Kamara, and Brixiova Citation2010). The sector is mainly characterised by the export of green coffee bean to the rest of the world (Nyangito and Omare Citation2004). One of the key features of the coffee plantation in these countries is the predominance of small-scale farmers, with exception of Kenya where there are coffee estates (Lukanima and Swaray Citation2014). These farmers are mainly characterised by organic farms with the utilisation of traditional agricultural tools, while estates are cooperative farms with better utilisation of modern technologies and large farm size.
Some studies indicated that dominance of small-scale farmers could minimise the coffee sector’s influence on the world market due to constraints associated with a low supply chain scheme and marketing infrastructure (Bacon Citation2005; Bolwig, Gibbon, and Jones Citation2009; Ha and Shively Citation2008; ICC Citation2015; Jaramillo et al. Citation2011; Lee, Gereffi, and Beauvais Citation2012). The implication is that being a small-scale producer makes most farmers vulnerable to various forms of shocks, including climate variability, price volatility, low farm productivity, slow adoption of new technologies, limited access to finance and lack of market access. Weak price transmission signals between spatially separated markets and between different levels in the value chain are also mentioned as some of the other obstacles to a well-functioning commodity market (Abdulai Citation2007).
At the global market, the emergence of competitiveness could favour exporters such as Brazil, Vietnam, and Colombia in deciding the world market price due to lower production cost in the respective countries (Ponte Citation2002). This adversely affects the export performance of coffee exporting countries in East Africa. Similarly, the collapse of the International Coffee Agreement, which was intended to promote cooperation between exporting and importing countries, resulted in a persistent fall of the international coffee price (Parrish, Luzadis, and Bentley Citation2005; Were et al. Citation2002).
2.2 Trends and trade patterns of the African coffee sector
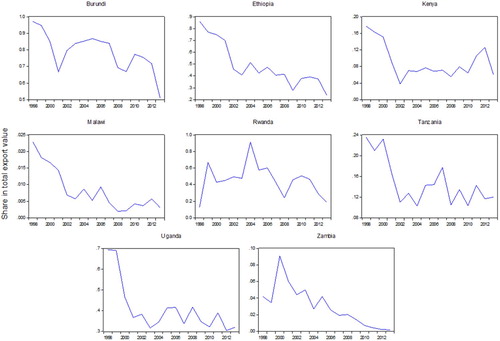
Improving coffee trade performance in East African countries could have a substantial effect on the national economy of the respective countries. For instance, coffee exports alone generated about 26% and 22% of total export revenues in Ethiopia and Rwanda in the year 2009, respectively (Mafusire et al. Citation2010). Export revenue from the coffee sector constitutes a substantial share of total foreign trade in East African countries. For instance, official statistics by the Food and Agricultural Organisation (FAO) indicated that the coffee export value has increased by 55%, 21%, and 10% between 1998 and 2013 in Rwanda, Uganda and Ethiopia respectively (FAO Citation2016). Similarly, countries such as Burundi, Kenya, Malawi, Tanzania, and Zambia recorded an average coffee export growth of 4%, 8%, 4%, 7%, and 1% respectively, during the same period of time. The volume of coffee exports (in 1000 US$) between 1998 and 2013 for eight East African countries is illustrated in .
Figure 3. Coffee exports from East African countries.
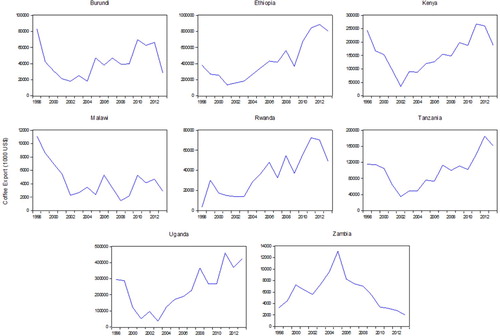
Despite increasing trends in coffee export values, its share in total agricultural exports significantly declined between 1998 and 2013, by an average of 6%, 4%, and 10% in Ethiopia, Uganda, and Zambia respectively. This decline is mainly associated with a rise in the relative export share of other commodities to the rest of the world (Nyangito and Omare Citation2004; World Bank Citation2015) and booming domestic coffee consumption (ICC Citation2015). However, the share of coffee in total agricultural export revenue has shown an increasing trend in Kenya and Rwanda, with an average growth of 1% and 27%, respectively. In particular, the significant increase in the share of coffee exports in Rwanda is mainly associated with government intervention in creating cooperatives with a legal and statutory framework that helps the sector function well (Mujawamariya, D’Haese, and Speelman Citation2013). demonstrates the share of coffee exports relative to total agricultural trade in East African countries.
Figure 4. Share of coffee export value from total agricultural export value.
2.3 RTA in East and Southern Africa
2.3.1 Common Market for Eastern and Southern Africa
The COMESA was initially established in 1981 as the Preferential Trade Area for Eastern and Southern Africa (PTA) under the AU’s framework of Lagos Action Plan and the Final Act of Lagos (COMESA Citation2009). The PTA was transformed into COMESA in 1994 to take advantage of larger market size, to share the region’s common heritage and destiny and to allow greater social and economic co-operation. This trading block accounts currently 21 countries including Burundi, Comoros, Democratic Republic of Congo (DR Congo), Djibouti, Egypt, Eritrea, Ethiopia, Kenya, Libya, Madagascar, Malawi, Mauritius, Rwanda, Seychelles, Somalia, Sudan, Swaziland, Tunisia, Uganda, Zambia, and Zimbabwe (COMESA Citation2017). This economic block is believed to bring economic prosperity through regional integration for its 540 million of the population with global trade in goods worth of US$ 235 billion.
The prominent objective of COMESA is to form a large economic and trading unit that is capable of overcoming some of the trading barriers faced by the individual member states. To achieve this objective, COMESA has set up key priority development areas. These include FTA, CU and TP among member states. In terms of FTA, the trade agreement was officially achieved in October 2000 when nine of the member statesFootnote1 eliminated their tariffs on COMESA originating products (COMESA Citation2017). On the CU and TP, member states have been implementing various trade regulations including, adopting a road map that outlines programmes, liberalise trade and customs co-operation such as the introduction of a unified digitalised customs network across the region, improving the administration of transport and communications sector, and finally to harmonising macro-economic and monetary policies throughout the region.
The trade volume among COMESA member states has shown an increasing pattern in the past few years. For instance, the intra-trade among members have successively increased from the US$ 4 billion in 2007 to roughly US$ 9.6 billion in 2015 (COMESA Citation2017). Furthermore, there has been a promising development in infrastructural projects within the individual countries including Kenya, Ethiopia, Rwanda, and Mauritius, which is expected to stimulate trade exchange in the region.
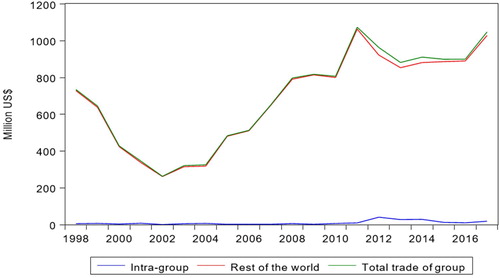
illustrates the volume (million US$) and trends of coffee trading among and to rest of the world in COMESA member countries using the official statistics from the UNECTAD (UNECTAD Citation2019). The figure indicated that there has been an increasing pattern in coffee trading between the member countries and to the rest of the world. Notably, the figure showed a higher rate of increase to the rest of the world, relative to trading between the member states.
2.3.2 East African Community
EAC is a regional intergovernmental organisation of six States, namely the Republics of Burundi, Kenya, Rwanda, South Sudan, the United Republic of Tanzania, and the Republic of Uganda, with its headquarters in Arusha, Tanzania. These states accommodate around 172 million inhabitants, of which over 22% are dwelling in the urban areas. With a land area of 2.5 million square kilometres and a combined Gross Domestic Product (GDP) of US$ 172 billion, ECA bears great strategic and geopolitical significance for the member states to form an economic block (ECA Citation2015). The main objectives of EAC are to develop policies and programmes aimed at widening and deepening cooperation among the partner states in political, economic, social and cultural fields, research and technology, defense, security and legal affairs for their mutual benefit (EAC Citation2014).
Official reports indicated that both intra-trade among member states have significantly grown over the last few years with the total exports from the intra-EAC trade amounted to US$ 3207 million while the total imports amounted to US$ 1533 million, thus giving an intra-trade surplus of US$ 1678 million (EAC Citation2016). Furthermore, the export structure has also been changed over the course of the community’s regional integration. For instance, the share in the total exports of primary products fell from 53% in 2002–2004 to 44% in 2010–2012, while the export of the manufactured products has been growing steadily. Export markets also shifted towards other markets in sub-Saharan African countries (SSA) and Asian countries (UNCTAD Citation2018). Notably, the share of SSA in EAC exports has increased from 30% in 2002–2004 to 36% in 2010–2012, while the share of Asian countries in EAC exports has increased from 17% to 26% over the same period. Despite this progresses, the contribution of intra-EAC trade remains limited, accounting for only 19% of EAC exports in 2010–2012 (UNCTAD Citation2018).
illustrates the volume (million US$) and trends of coffee trading among and to rest of the world in EAC member countries using the official statistics from the UNECTAD (UNECTAD Citation2019). The figure indicated that there has been an increasing pattern in coffee trading between the member countries and to the rest of the world. Notably, the figure showeda higher rate of increase to the rest of the world, relative to trading between the member states.
3. Methodological framework
3.1 Empirical strategy – the gravity model
Following the work of Tinbergen (Citation1962) and Pöyhönen (Citation1963), the gravity model has been widely used to examine trade performance in different contexts. Thus, our empirical strategy also utilises the augmented gravity modelling framework as an instrument to examine the impact of RTA on coffee export performance. The traditional gravity modelling approach links trade flow to various economic indicators and distances such as the national income of trading countries and the physical distances between the trading countries. Meanwhile, recent studies have rigorously expanded the model by incorporating other economically meaningful variables such as potential markets (instrumented by population size), trading block, country integration, community membership and other sets of dummies representing shared cultural and historical characteristics (e.g. see, Dal Bianco et al. Citation2015; Head and Mayer Citation2014; Martínez-Zarzoso Citation2013; Melitz Citation2003; Saggi, Stoyanov, and Yildiz Citation2018). Therefore, we started by defining the standard gravity model as follows:(1)
(1) where
is the value of trade flow from exporting country i to importing country j,
and
represent the incomes in i and j,
and
are the market size in country i and j which is denoted by the population size in the respective countries. The term
explains the transport cost with the distance between trading pairs (in kilometres). Taking log-linearisation, the gravity model becomes:
(2)
(2)
The term is a vector of 1×M matrix capturing the effects of cultural and historical ties between the trading pairs including contiguity, common language, colony, official common language and regional trading agreement. We have also considered the time fixed effects,
and the idiosyncratic error term,
in our model. The terms,
and
are country and time dummies, respectively, representing a time-varying MRT. Introducing these terms in the gravity modelling framework minimises bias linked to incorrect deflation of trade (e.g. see, Baldwin Citation2006). Meanwhile, the approach by Helpman, Melitz, and Rubinstein (Citation2008) suggested that including a country and time fixed effects in order to address the issues of MRT needs to estimate 2NT dummies for unconditional trade and this will lead to 240 dummies in our case. Therefore, we followed a two-stage estimation approach, i.e. selecting an equation in the first step and specifying the trade flow equation in the second step. This approach is expected to consider the potential bias due to omission of the extensive margin in the standard gravity model which is represented by the number of exporters. Considering these premises, the first step model specifies the log of bilateral exports from country i to country j as a function of distance, common language, country level fixed effects,
Footnote2 and other socio economic determinants is given as:
(3)
(3)
Equation (4) provides the second step estimation with a latent variable specification for the trade flow i.e. one if the country i trades with country j as follows:(4)
(4) where
with
(5)
(5) with
standing for a vector of all covariates given in Equation (4). Considering
in our final model provides a basis for the coefficients that account for potential trade barriers, such as
on distance
to be interpreted as elasticity estimates of the country’s trade with respect to distance (Helpman, Melitz, and Rubinstein Citation2008). The other issue in estimating Equation (3) is related to the exclusion of zero trade flows. In this respect, Helpman, Melitz, and Rubinstein (Citation2008) indicated that the selection effect may induce a significant relationship between the unobserved
and the trade barriers,
in which trade pairs with large observed trade barriers, i.e. high
are likely to have low unobserved trade barriers denoted by high
. We also assumed that the idiosyncratic term is normally distributed and given by
. Our final explanation is related to addressing the selection and heterogeneity bias in the sample we have used. These empirical challenges are addressed in the second stage specification by implementing a non-linear estimation of the predicted values of the latent variable,
with
, where
is the predicted probability of exports from country i to j from Equation (5), and
(.) is the cumulative density function with a unit normal distribution (Helpman, Melitz, and Rubinstein Citation2008; Martínez-Zarzoso, Felicitas, and Horsewood Citation2009). At the end, we have used a panel fully modified ordinary least squares estimator (see Phillips and Hansen Citation1990) to derive parameter for the static model. This estimator robust to issues of endogeneity and serial correlation problems even in the absence of priori cointegration relations test.
3.2 Dynamic gravity model specification
Our previous gravity model in Equation (3) is specified in a static panel setup which is expected to capture contemporaneous exogenous effects on trade. Meanwhile, it is suggested that trade and trade effect are dynamic processes, where the past trade values have an effect on the current level (e.g. Gallego, Rodríguez-Serrano, and Casanueva Citation2019; Olivero and Yotov Citation2012; Santeramo Citation2015). Therefore, we specified the dynamic gravity model by including lagged dependent variable in Equation (6) as:(6)
(6) where
is year fixed effects,
is exporting country fixed effects, and
is importing country fixed effects. The estimate
, i.e. provides an information on the effect of previous year trade performance and its dynamic adjustment over time. Estimating Equation (6), however, has an empirical challenge as the included lagged trade value could induce endogeneity issues that the current trade flows might be correlated with an idiosyncratic error term over time. In this context, the fixed effects estimator could give a biased estimate, specifically when there are a large N and small T (Martínez-Zarzoso, Felicitas, and Horsewood Citation2009). To account for these challenges, we implemented a system GMM estimator that uses the internal instrument to address the endogeneity issues (e.g. Arellano and Bover Citation1995; Blundell and Bond Citation1998). Consistency of the estimator requires fulfilment of two key assumptions, i.e. selected instruments should be free from serial correlation and the over-identification restriction must hold.
3.3 Trade potentials
The values of trade potentials of coffee exports for EAC and/or COMESA at the intensive margin are computed by a method of sample predictions applied after deriving parameter estimates from coffee trading gravity model. After we obtain the estimated results of the gravity model for bilateral coffee trade flows, we use the parameter estimates derived from the previous section to predict coffee trade between EAC and COMESA and the rest of the world captured in our sample. The ratio of the predicted trade values (T) derived by dynamic model and the actual trade values (A), i.e. , is then used to examine the East and Southern African’s coffee global trade potential. Any East and Southern African coffee exporting country (e) has a trade potential with another importing country (i), if the value of
is positive and therefore, the exporting countries may attempt to expand the coffee trades with their respective partners.
3.4 Data description
This study uses a balanced panel data for the period 1998-2013 in eight East and Southern African, i.e. Burundi, Ethiopia, Kenya, Malawi, Rwanda, Tanzania, Uganda, and Zambia, and 139 worldwide coffee trading partners. These exporting countries a member of the COMESA and EAC trade unions or both. The data sets are extracted from two sources. First, real GDP (constant US$ 2010 which is a proxy for income) and population size that represent the magnitude of coffee producers and consumers in paired trading countries are taken from World Development Indicators (World Bank Citation2015). Second, the value of coffee export (US$ 1000) to the rest of trading partners, the distance between trading countries (expressed in kilometres), dummies representing contiguity, common language, colony, common colony, and common official language are taken from “Centre d’Etudes Prospectives et d’Informations Internationales” (CEPII) database (CEPII Citation2015). We also obtained information on the membership status of the trading unions, i.e. COMESA and EAC from the respective institution (COMESA Citation2015; ECA Citation2015).
illustrates the descriptive statistics and definitions of the variables. The contiguity dummy was used to control for the effect when the trading pairs were contiguous countries. The dummy variable denoted by common language captures the effect of having the same official language in the trading partners. The impact of common official language on coffee trade performance is captured by a dummy, as with the trading pairs. Comlang_ethno is included as a dummy to control for the effect of having at least 9% of the total population in a trading partner speaking the same language.
Table 1. Definitions of variables and descriptive statistics.
Furthermore, the variable Colony is used as a dummy if pairs ever lived in a colonial relationship. A dummy representing a common colony is also used to capture the trade relationship if both had a common coloniser post-1945. RTA are captured in two dummies, COMESA used if the country is a COMESA member state, while EAC accounts for the EAC membership. All the continuous variables (population and national income in trade pairs, distance, and trade value are transformed) are linearised using log-transformation as it handles the influence of outliers on the estimates (e.g. see Melitz Citation2003; Porojan Citation2001).
4. Results and discussions
The analysis begins by estimating Equation (3) using a pooled least square estimator as the baseline regression. Under this estimator, we pooled our sample in a different time period in order to see different possible events that may occasionally influence coffee trading (see ). In and , we present estimates corresponding to the static and dynamic specifications, respectively. Each specification considers key determinants of the coffee export value such as population, GDP in both trading countries and simple distance. We also presented estimates for a set of dummies to account for cultural and historical ties between trading partners and finally, we provided estimates for coffee trade potentials.
Table 2. Baseline estimates.
Table 3. Estimates for the static model.
Table 4. Dynamic model estimates.
4.1 Baseline model estimates
Baseline estimates based on a pooled least square estimator are presented in . We have used a log-linear specification of the gravity model given by Equation (2) for a single time period, i.e. for the years 2000, 2004, 2008, 2010, and the whole sample period (1998–2013) without including the MRT. Each of the selected years are characterised by specific events in COMESA and EAC member countries that cold originally induce some change in coffee trading among member states. For instance, there was a new treaty for the Establishment of the EAC and the United Republic of Tanzania officially left the COMESA block in the year 2000. Rwanda and Burundi also entered the COMESA and EAC blocks in 2004 and 2008 respectively. In the year 2010, the Republic of Seychelles officially entered the COMESA block. The corresponding results indicated that the coefficients representing the size of consumers in importing countries were negative and statistically significantFootnote3 under all pooled least square specifications. The negative coefficient could be linked to the inconsistency of pooled OLS estimates that will be addressed in the dynamic specification. Coefficients representing the population size in the exporting countries are positive which are similar to estimates reported in the previous literature.
The national income parameters for coffee importers and exporters were positive and statistically significant in most specifications. This suggests that an average increase in income of trading partner countries could positively affect the volume of coffee export. On the other hand, the estimates for physical distance between trading partners shows a negative sign in all specifications, indicating the higher transport cost could reduce the coffee export volume. The estimates for contiguity, colony and common colony have a positive association with coffee export, while the estimate for a common official language and common national language have a mixed coefficient (see ). Interestingly, coefficients for COMESA and EAC have a positive sign in all specifications, suggesting regional trade agreement could have a positive impact on the coffee export performance. Overall, most of the pooled least square estimates show the expected result, while some of them have an ambiguous coefficient. This could be related to the case that estimating a gravity model using pooled least square estimator is limited in capturing the effects of any unobserved factors that could be fixed or varies across country and time period (e.g. Baier and Bergstrand Citation2007). Furthermore, it has been indicated that estimates for RTA dummies could be highly unstable in the case of single country estimate over a period of time (Baier and Bergstrand Citation2007; Saggi, Stoyanov, and Yildiz Citation2018).
4.2 Static model estimates
Results for the static gravity model are presented in . Columns (1) and (2) show estimates based on group of years, i.e. between 1998–2006 and 2007–2013 respectively, while column (3) provides estimates for the whole sample. The idea behind classifying the whole sample before and after the year 2006 is to consider the global coffee market situation in connection to the world financial crises. Similar to the baseline specifications, we have controlled market size (population size) and national income in both importing and exporting countries, distance in kilometres, and other control variables. Population size in coffee exporting countries has a positive and statistically significant coefficient.
Estimates for GDP in importing and exporting countries have a mixed coefficient sign. Before, the financial crises, the sign becomes positive while negative after the financial crises. This could reflect the potential adverse effects of the global economic environment on coffee export performance of the countries. GDP in the exporting countries have a positive and statistically insignificant effect. Apparently, it has a negative and statistically significant estimate in the case of importing countries. The effect of distance between trading pairs is negative and different from zero in each specification, indicating that distance is of the critical determinants of coffee export.
An increase in distance by one kilometre between trading partners results in a 1.7% decrease in export value. Eventually, this indicates that being distant from the exporting countries to importing countries reduces significant influences on coffee trade performance in East and Southern African countries. Looking at the overall results in column (3), our study provides interesting findings on the effects ECA and COMESA membership on coffee export performance. Specifically, the EAC membership indicates significant positive contributions on intra-coffee trading in all specifications. Unlike in the second column, the intra-trade of coffee among COMESA members exhibit positive effect of RTA. The impact of population size in exporting country is positive and statistically significant at 1% level, suggesting that a 1% increase in population size results in a 1.94% increase in coffee export value. Similarly, if the trading countries are sharing a common border which is controlled by contiguity have a positive effect on coffee export value. In this regard, the coffee export value is 2.30% higher if the trading pairs have a common geographical border compared to those trading partners without a common border.
To deal with the issue of country heterogeneity and bias of self-selection, we use a two-stage estimation technique as shown in Equations (3)–(5), and we follow a similar approach by Helpman, Melitz, and Rubinstein (Citation2008). The results are also provided in . Both coefficients from the second stage predicted standard errors and inverse mills ratios are negative and not statistically different from zero. These findings simply imply that there is no evidence of self-selection effects. The overall estimate under static specifications shows the expected result in terms coefficient sign with the exception of GDP and population size in the importing countries. This could be attached to the dynamic nature of coffee trade that consideration of past trade is required. We have estimated the dynamic gravity model and results are presented the subsequent subsection.
4.3 Dynamic model estimates
Estimates from dynamic specifications are reported in . Similar to the static specifications, we have classified the sample in columns (1) and (2) for the period trade between 1998–2006 and 2007–2013 respectively, while column (3) gives estimates for the whole sample. The Arellano–Bond test for serial correlation in the first difference, AR(2) is failed to be rejected in all specifications, indicating the absence of serial correlation in the error term. Besides, the Sargan–Hansen tests for joint exogeneity of the instruments indicted by Wald test statistics is not rejected at least at 10% significance level which suggests exogeneity of the instruments.
Estimates in column (1) represent the sub-sample period 1998–2006 and the estimated coefficient for lagged trade flows is statistically significant at the 1% level, indicating a dynamic process in our gravity modelling analysis. The estimate denoting population and GDP for importing countries becomes statistically significant. Column (2) presents the estimates for the sample period between 2007 and 2013. In this specification, the estimated coefficient for lagged trade flows is still statistically significant at the 1% level, indicating a dynamic process in coffee export from East African countries. Except for variable representing the colonial relationship, all variables are statistically significant at least 10% level in explaining coffee export performance. Importantly, estimates for ECA and COMESA variables are positive and statistically significant at 1% level suggesting, the positive effect of the RTA on coffee export performance.
The last column in represents the overall sample period i.e. 1998–2013. In this specification, all variable, except for contiguity and common colony, are statistically significant in explaining coffee export performance. The lagged dependent variable is statistically significant at the 1% level. Importantly, the statistics for Arellano–Bond test for AR(2) in first differences is not rejected confirming the absence of autocorrelation. Besides, the Hansen test for exogeneity of the instruments, as indicated by the Wald test statistics, is not rejected that the exogeneity condition is fulfilled. Overall, the estimates under dynamic specification provide estimates with the expected sign and relatively lower standard errors, implying that the predicted values become more robust. This reduces the issue of model misspecification elaborated by Martínez-Zarzoso, Felicitas, and Horsewood (Citation2009) that could result in a biased estimate. Therefore, results from the dynamic specifications showed that examining the effects of bilateral trade agreements on coffee export performance provides a more robust estimate that can be exploited for the enhancement of trade policy in the sector.
4.4 Analysis of trade potentials
Another essential aspect of trade analysis using gravity modelling is that it can be used to analyse the trade potentials of the exporting countries. In this regard, we have computed the trade potentials over time by taking the difference between predicted and actual trade flows for exporting countries. The results are reported across eight exporting countries over the study period. The prediction indicated that exporting countries still have opportunities to exploit the international market (see ). The gap between the actual and predicted lines indicates coffee trade potentials from the East and Southern African region.
Figure 5. Coffee trade potentials of the Eastern and Southern African African countries.
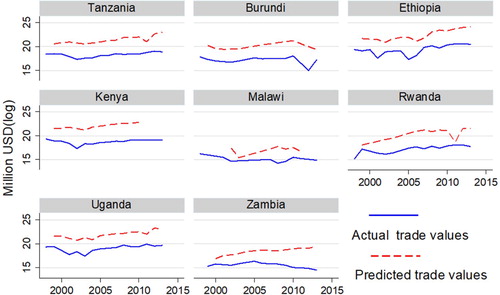
The figure also shows that most of the trade potentials are strictly positive, an indication that the countries in the regions still have significant opportunities to expand their coffee export at the international market. Notably, countries like Zambia, Tanzania, Kenya, Uganda, and Ethiopia have a substantial opportunity for the possible expansion of coffee exports as the gap between the two curves are relatively large and widen over time. However, countries such as Burundi and Malawi have a very narrowed and declining coffee trade potentials but still positive.
4.5 Comparative analysis of the results
In this subsection, we provide comparative analysis of the results from our study in relation to previous studies. From the final model estimates in , we find that the coefficient values from national income (proxied by GDP) and distance between trade partners are statistically different from zero with expected signs, positive and negative, respectively. The elasticities derived from GDP are relatively large but less than a unit. These results are in line with Silva and Tenreyro (Citation2006) who suggested that the parameter estimates on exporter and importer’s national income tend to be large, even sometimes more than a unit.
We further looked at how the physical distance affects coffee export. In this regard, we found that the estimates from pooled and static models are larger compared to the estimates from the dynamic estimator. Notably, the estimated elasticity is always negative and close to 0.75, while the dynamic estimate is relatively lower (0.37). Comparing with the existing literature such as Dal Bianco et al. (Citation2015) and Disdier and Head (Citation2008), the geographical distance might have a trivial effect on coffee trade.
It is also worthy to mention that the pooled and static estimates overestimate the impact of geographical distance which is consistent with the previous study by Dal Bianco et al. (Citation2015).We can therefore conclude that the cost of transport induces a minimal role in affecting bilateral trading. The parameter estimates of the lagged coffee trade values from are all statistically significant (at 1% level) showing the dynamic nature of coffee export performance.
Using the dynamic model, we also derive other interesting results of the parameter estimates on RTA’S, including EAC and COMESA. The estimated coefficients on these RTA are positive in all specifications. In the last column of , the EAC and COMESA estimates indicates that the elasticities of 1.82 and 0.79 showing RTA can improve the export volume around 182 and 80% respectively. This result also complements with the study by Parra, Martínez-Zarzoso, and Suarez-Burguet (Citation2016) that the RTA’s have substantial impact on coffee global market integrations. Our results also complement the studies by Martínez-Zarzoso, Felicitas, and Horsewood (Citation2009) and Carrere (Citation2006). Accordingly, Martínez-Zarzoso, Felicitas, and Horsewood (Citation2009) evaluated the effects of preferential trade agreements between EU members and non-members using static and dynamic gravity models and found significant effects if RTA. The study by de Santis, De Benedictis, and Vicarelli (Citation2005) analyses the impacts of intra-periphery free trade agreements in eight Eastern European countries using a dynamic gravity model, while Carrere (Citation2006) used a static gravity model to analyse regional trade agreement (RTA) effects. In all these studies, the authors obtained similar results regarding positive and statistically significant intra-trade block effects (in the present case the EAC and COMESA trade blocks are positively and statistically significant).
Although this study found strong evidence that RTA’s significantly influence the coffee trade performance, less attention was put on the potential effects of Non-Trade Measures (NTM’s). In this regard, previous studies have shown that NTM’s may play an important role in coffee trading, especially when trading with developed and emerging economies, where the later may friction or facilitate trade (Gebrehiwet, Ngqangweni, and Kirsten Citation2007; Grant and Arita Citation2017; Santeramo Citation2015; Santeramo et al. Citation2019). For instance, those high-income countries may impose NTM’s of sanitary and phytosanitary standards, to mitigate risk in consumption and protect human health from risks linked with imported agricultural commodities. Although in this study, we attempt to account the potential effect of NTM’s through country-pair specific fixed effects, we suggest future study to specifically examine the potential role of NTM’s on coffee trade dynamics.
5. Conclusions and policy implications
This paper identifies the major factors influencing coffee export performance in eight East and Southern African countries. Both static and dynamic gravity model specifications were used to examine the effects of trade agreements on social-economic growth. Importantly, two dummies defining trade flows were generated to analyse the potential implications of both coffee intra-trade within blocks and the rest of the world. The EAC dummy was used to control for the effects of coffee trade flows if the pairs are EAC members, and COMESA was a dummy when trading pairs have COMESA trade agreements.
The results from the dynamic specification found that preferential trade agreements under COMESA and EAC have a positive effect on coffee export performance of the East and Southern African countries. Specifically, the exporting country could increase their trade value by an average of up to 80% given the country is a COMESA member, while the export value could rise by 182% if the country is an EAC member. The variation in the magnitude of the two estimates could be linked to an case that the stage of market integration in the EAC is relatively high. For instance, there is a free trade preferential agreement, i.e. zero duty on import of goods and services among member countries while achieving free trade preferential agreement is in due process in the case of COMESA block (COMESA Citation2009; EAC Citation2014).
The overall results also supported the recent initiative of the AU to create the largest continental FTA through the treaty called, the AfCFTA 44 countries across the continent (African Union Citation2018). According to the agreement, signatories are agreed to create a single continental market for goods and services, with free movement of business persons and investments, and thus paving the way for accelerating the establishment of the Continental CU and the African CU. Therefore, policy makers should consider the role of free trade agreements for the coffee sector as an essential path towards coffee sector development. Interestingly, the trade potentials from the study revealed that there are substantial opportunities for the region to exploit the available markets as the countries are still under-exporting compared to the coffee market needs.
Acknowledgements
We would like to thank the anonymous reviewers for their critical comments and suggestions during the review process. In addition, we would like to thank Professor Carl-Johan Lagerkvist for his feedback at the early stages of the manuscript.
Disclosure statement
No potential conflict of interest was reported by the authors.
ORCID
Aimable Nsabimana http://orcid.org/0000-0002-1573-9233
Wondmagegn Tafesse Tirkaso http://orcid.org/0000-0002-3945-6115
Notes
1 These are Djibouti, Kenya, Madagascar, Malawi, Mauritius, Sudan, Zambia and Zimbabwe.
2 This term is an increasing function that controls a fraction of exporting countries i to importing countries j with consideration of zero values.
3 These estimates were derived from the partial differentiations of and
in the coffee trading partners.
References
- Abdulai, A. 2007. Spatial and vertical price transmission in food staples market chains in Eastern and Southern Africa: What is the evidence? In FAO trade and markets division workshop on staple food trade and market policy options for promoting development in Eastern and Southern Africa, Rome, 1–2.
- Anderson, J.E., and E. Van Wincoop. 2003. Gravity with gravitas: A solution to the border puzzle. American Economic Review 93 no. 1: 170–92. doi: 10.1257/000282803321455214
- Arellano, M., and O. Bover. 1995. Another look at the instrumental variable estimation of error-components models. Journal of Econometrics 68 no. 1: 29–51. doi: 10.1016/0304-4076(94)01642-D
- African Union. 2018. Agreement establishing the African continental free trade area. Technical report, The African Union, Kigali. https://au.int/en/treaties/agreement-establishing-african-continental-free-trade-area.
- Bacon, C. 2005. Confronting the coffee crisis: Can fair trade, organic, and specialty coffee reduce small-scale farmer vulnerability in northern Nicaragua? World Development 33 no. 3: 497–511. doi: 10.1016/j.worlddev.2004.10.002
- Baier, S.L., and J.H. Bergstrand. 2007. Do free trade agreements actually increase members’ international trade? Journal of International Economics 71 no. 1: 72–95. doi: 10.1016/j.jinteco.2006.02.005
- Baier, S.L., J.H. Bergstrand, and R. Mariutto. 2014. Economic determinants of free trade agreements revisited: Distinguishing sources of interdependence. Review of International Economics 22 no. 1: 31–58. doi: 10.1111/roie.12095
- Baldwin, R. 2006. The Euro’s trade effects. Working Paper Series 594, European Central Bank. Working Paper Series No 594. https://ssrn.com/abstract=886260.
- Bellemare, M.F., C.B. Barrett, and D.R. Just. 2013. The welfare impacts of commodity price volatility: Evidence from rural Ethiopia. American Journal of Agricultural Economics 95 no. 4: 877–99. doi: 10.1093/ajae/aat018
- Blundell, R., and S. Bond. 1998. Initial conditions and moment restrictions in dynamic panel data models. Journal of Econometrics 87 no. 1: 115–43. doi: 10.1016/S0304-4076(98)00009-8
- Boansi, D., and C. Crentsil. 2013. Competitiveness and determinants of coffee exports producer price and production for Ethiopia. Journal of Advanced Research in Economics and International Business 1 no. 1: 31–45.
- Bolwig, S., P. Gibbon, and S. Jones. 2009. The economics of smallholder organic contract farming in tropical Africa. World Development 37 no. 6: 1094–104. doi: 10.1016/j.worlddev.2008.09.012
- Carrere, C. 2006. Revisiting the effects of regional trade agreements on trade flows with proper specification of the gravity model. European Economic Review 50 no. 2: 223–47. doi: 10.1016/j.euroecorev.2004.06.001
- CEPII. 2015. CEPII Database - Centre d’Etudes Prospectives et d’Informations Internationales. http://www.cepii.fr/CEPII/en/welcome.asp.
- Chiputwa, B., D.J. Spielman, and M. Qaim. 2015. Food standards, certification, and poverty among coffee farmers in Uganda. World Development 66: 400–12. doi: 10.1016/j.worlddev.2014.09.006
- COMESA. 2009. COMESA - Common Market for Eastern and Southern Africa. Technical report, Common Market for Eastern and Southern Africa (COMESA) Secretariat, Lusaka, Zambia.
- COMESA. 2015. Common market for Eastern and Southern Africa. https://www.comesa.int/.
- COMESA. 2017. Common market for Eastern and Southern Africa. Technical report, Biennial report, 2016-17, Lusaka, Tanzania. Availbale at: https://www.comesa.int/2019/02/21/comesa-biannual-report-2016_17_en/.
- Dal Bianco, A., V.L. Boatto, F. Caracciolo, and F.G. Santeramo. 2015. Tariffs and non-tariff frictions in the world wine trade. European Review of Agricultural Economics 43 no. 1: 31–57. doi: 10.1093/erae/jbv008
- de Santis, R., L. De Benedictis, and C. Vicarelli. 2005. Hub-and-spoke or else? Free trade agreements in the ‘Enlarged’. European Union. The European Journal of Comparative Economics 2 no. 2: 245–60.
- Disdier, A.C., and K. Head. 2008. The puzzling persistence of the distance effect on bilateral trade. The Review of Economics and Statistics 90 no. 1: 37–48. doi: 10.1162/rest.90.1.37
- EAC. 2014. East African Community Annual Report 2013-2014. Technical report, EAC Secretariat., Arusha, Tanzania. https://www.eac.int/documents/category/key-documents.
- EAC. 2016. East African Community Facts and Figures Report 2016. Technical report, East African Community (EAC), Arusha, Tanzania.
- ECA. 2015. East African Community. http://www.eac.int/.
- FAO. 2016. FAOSTAT - Food and Agriculture Organization of the United Nations. http://www.fao.org/faostat/en/#home.
- Gallego, Á, M.Á. Rodríguez-Serrano, and C. Casanueva. 2019. Dynamic panel data models in tourism. Current Issues in Tourism 22 no. 4: 379–99. doi: 10.1080/13683500.2018.1467386
- Gebrehiwet, Y., S. Ngqangweni, and J.F. Kirsten. 2007. Quantifying the trade effect of sanitary and phytosanitary regulations of OECD countries on South African food exports. Agrekon 46 no. 1: 1–17. doi: 10.1080/03031853.2007.9523759
- Grant, J., and S. Arita. 2017. Sanitary and phyto-sanitary measures: Assessment, measurement, and impact. (Technical report No. 938-2017-1828).
- Ha, D.T., and G. Shively. 2008. Coffee boom, coffee bust and smallholder response in Vietnam’s Central Highlands. Review of Development Economics 12 no. 2: 312–26. doi: 10.1111/j.1467-9361.2007.00391.x
- Head, K., and T. Mayer. 2014. Chapter 3 - gravity equations: Workhorse, toolkit and cookbook. In Handbook of international economics, 4, ed. G. Gopinath, E. Helpman, and K. Rogoff, 131–195. North Holland: Elsevier.
- Helpman, E., M. Melitz, and Y. Rubinstein. 2008. Estimating trade flows: Trading partners and trading volumes. Quarterly Journal of Economics 123 no. 2: 441–87. doi: 10.1162/qjec.2008.123.2.441
- ICC. 2015. Sustainability of the coffee sector in Africa. Technical report, International Coffee Council, Milan, Italy. http://www.ico.org/documents/cy2014-15/icc-114-5-r1e-overview-coffee-sector-africa.pdf.
- Jaramillo, J., E. Muchugu, F.E. Vega, A. Davis, C. Borgemeister, and A. Chabi-Olaye. 2011. Some like it hot: The influence and implications of climate change on coffee berry borer (hypothenemus hampei) and coffee production in East Africa. PLoS One 6 no. 9: e24528. doi: 10.1371/journal.pone.0024528
- Krueger, A.O. 1997. Free trade agreements versus customs unions. Journal of Development Economics 54 no. 1: 169–87. doi: 10.1016/S0304-3878(97)00032-1
- Lee, J., G. Gereffi, and J. Beauvais. 2012. Global value chains and agrifood standards: Challenges and possibilities for smallholders in developing countries. Proceedings of the National Academy of Sciences 109 no. 31: 12326–331. doi: 10.1073/pnas.0913714108
- Lukanima, B., and R. Swaray. 2014. Market reforms and commodity price volatility: The case of East African coffee market. The World Economy 37 no. 8: 1152–185. doi: 10.1111/twec.12124
- Mafusire, A., A. Salami, A. Kamara, and F. Lawson. 2010. Coffee production in Africa and the global market situation. Commodity Market Brief 1 no. 2: 1–9.
- Martínez-Zarzoso, I., N.-L.D. Felicitas, and N. Horsewood. 2009. Are regional trading agreements beneficial? Static and dynamic panel gravity models. The North American Journal of Economics and Finance 20 no. 1: 46–65. doi: 10.1016/j.najef.2008.10.001
- Martínez-Zarzoso, I. 2013. The log of gravity revisited. Applied Economics 45 no. 3: 311–27. doi: 10.1080/00036846.2011.599786
- Melitz, M.J. 2003. The impact of trade on intra-industry reallocations and aggregate industry productivity. Econometrica 71 no. 6: 1695–725. doi: 10.1111/1468-0262.00467
- Minten, B., S. Tamru, T. Kuma, and Y. Nyarko. 2014. Structure and performance of Ethiopia’s coffee export sector. Working Papers.
- Mujawamariya, G., M. D’Haese, and S. Speelman. 2013. Exploring double side-selling in cooperatives, case study of four coffee cooperatives in Rwanda. Food Policy 39: 72–83. doi: 10.1016/j.foodpol.2012.12.008
- Nyangito and Omare, H. 2004. Performance of African agricultural exports and external market access conditions under international trade reforms. 2004 Inaugural Symposium, December 6-8, 2004, Nairobi, Kenya.
- Olivero, M.P., and Y.V. Yotov. 2012. Dynamic gravity: Endogenous country size and asset accumulation. Canadian Journal of Economics 45 no. 1: 64–92. doi: 10.1111/j.1540-5982.2011.01687.x
- Parra, M.D., I. Martínez-Zarzoso, and C. Suarez-Burguet. 2016. The impact of FTAs on MENA trade in agricultural and industrial products. Applied Economics 48 no. 25: 2341–353. doi: 10.1080/00036846.2015.1119792
- Parrish, B.D., V.A. Luzadis, and W.R. Bentley. 2005. What Tanzania’s coffee farmers can teach the world: A performance-based look at the fair trade-free trade debate. Sustainable Development 13 no. 3: 177–189. doi: 10.1002/sd.276
- Petit, N. 2007. Ethiopia’s coffee sector: A bitter or better future? Journal of Agrarian Change 7 no. 2: 225–63. doi: 10.1111/j.1471-0366.2007.00145.x
- Phillips, P.C.B., and B.E. Hansen. 1990. Statistical inference in instrumental variables regression with I(1) processes. The Review of Economic Studies 57 no. 1: 99. doi: 10.2307/2297545
- Ponte, S. 2002. The ‘Latte revolution’? Regulation, markets and consumption in the global coffee chain. World Development 30 no. 7: 1099–122. doi: 10.1016/S0305-750X(02)00032-3
- Porojan, A. 2001. Trade flows and spatial effects: The gravity model revisited. Open Economies Review 12 no. 3: 265–80. doi: 10.1023/A:1011129422190
- Pöyhönen, P. 1963. A tentative model for the volume of trade between countries. https://www.jstor.org/stable/40436776.
- Saggi, K., A. Stoyanov, and H.M. Yildiz. 2018. Do free trade agreements affect tariffs of nonmember countries? A theoretical and empirical investigation. American Economic Journal: Applied Economics 10 no. 3: 128–70.
- Salami, A., A.B. Kamara, and Z. Brixiova. 2010. Smallholder agriculture in East Africa: Trends, constraints and opportunities. African Development Bank Tunis.
- Santeramo, F.G. 2015. Research note: Promoting the international demand for agri-tourism: Empirical evidence from a dynamic panel data model. Tourism Economics 21 no. 4: 907–16. doi: 10.5367/te.2014.0397
- Santeramo, F.G., E. Lamonaca, G. Nardone, and A. Seccia. 2019. The benefits of country-specific non-tariff measures in world wine trade. Wine Economics and Policy 8 no. 1: 28–37. doi: 10.1016/j.wep.2018.12.001
- Schott, J.J., E. Jung, and C. Cimino. 2015. An Assessment of the Korea-China Free Trade Agreement. Policy Briefs PB15-24, Peterson Institute for International Economics.
- Silva, J.M.C.S., and S. Tenreyro. 2006. The log of gravity. The Review of Economics and Statistics 88 no. 4: 641–58. doi: 10.1162/rest.88.4.641
- Tinbergen, J. 1962. Shaping the world economy: Suggestions for an international economic policy. New York: The Twentieth Century Fund.
- UNCTAD. 2018. East African community regional integration: Trade and gender implications. Technical report, United Nations Conference on Trade and Development, Geneva, Switzerland.
- UNECTAD. 2019. UNCTADstat - United Nations Conference on Trade and Development. https://unctadstat.unctad.org/EN/Index.html.
- Were, M., N.S. Ndung’u, A. Geda, and S.N. Karingi. 2002. Analysis of Kenya’s export performance: An empirical evaluation. Technical report, Kenya Institute for Public Policy Research and Analysis, Nairobi, Kenya.
- Whalley, J. 1998. Why do countries seek regional trade agreements? In The regionalization of the world economy, 63–90. University of Chicago Press, NBER Working Paper Series, Massachusetts Avenue.
- World Bank. 2015. World Development Indicators (WDI) - Data Catalog. https://datacatalog.worldbank.org/dataset/world-development-indicators.
Appendix
Figure A1. Intra-trade and extra-trade in coffee among COMESA member countries.
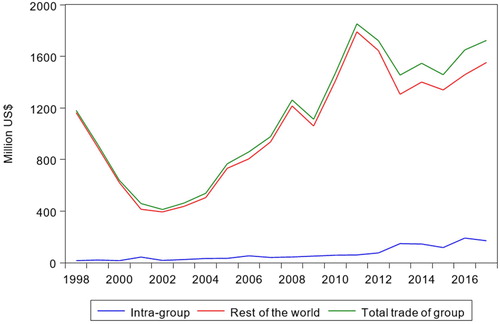
Figure A2. Intra-trade and extra-trade in coffee among EAC member countries.