
ABSTRACT
The literature on political exclusion and conflict tends to treat grievance-based mechanisms with broad-brush strokes and does not differentiate between types of political exclusion. This study disaggregates politically-excluded groups into two subgroups: groups that experience political discrimination from the state, and groups without political power that are not explicitly discriminated against. We posit that discriminated groups are more likely to experience grievances and therefore are more prone to conflict than excluded groups that are not actively discriminated against. We further posit that the effect of discrimination on conflict is moderated by interactions with economic inequalities and the share of elites. Using dyadic data for 155 ethnic groups in 28 Sub-Saharan African countries, we find that among politically-excluded groups it is indeed discriminated groups that are responsible for most of the association between political exclusion and conflict. Groups that face active, intentional, and targeted discrimination by the state are significantly more likely to be involved in conflict than excluded groups who do not face this explicit form of discrimination. Additionally, we find that discriminated groups who also experience economic inequalities are less likely to engage in conflict, whilst an increased presence of elites within discriminated groups can precipitate the chances of conflict.
In his seminal study, ‘Why Minorities Rebel’, Gurr (Citation1993) posits that economic and political differences between groups can foster collective grievances, but that deeper grievances will only occur if the disadvantaged group has been forcibly discriminated against. The latter point has often been overlooked in empirical studies of political exclusion and conflict. Scholars frequently note the importance of discrimination in fostering collective grievances (Stewart Citation2008; Wucherpfennig et al. Citation2012). However, in their empirical analysis, they do not distinguish discriminated groups from groups that are excluded but not political discriminated against (i.e., Cederman, Weidmann, and Gleditsch Citation2011; Deiwiks, Cederman, and Gleditsch Citation2012; Wimmer, Cederman, and Min Citation2009).Footnote1 In this way, studies examining the relationship between political exclusion and conflict tend to rely more on arguments about relative deprivation, than arguments about the repressive and discriminatory policies of states.
In this article, we return to Gurr’s original grievance argument. Recent scholarship has explained the likelihood of group conflict by looking at political exclusion as the main explanatory variable (Buhaug, Cederman, and Rød Citation2008; Cederman, Gleditsch, and Buhaug Citation2013; Cederman, Wimmer, and Min Citation2010; Deiwiks, Cederman, and Gleditsch Citation2012). In contrast, we focus on discrimination by the state, arguing that exclusion alone may not be enough to incite violence. In our analysis, we distinguish between two types of politically-excluded groups: Discriminated excluded groups are directly targeted by the state with discriminatory policies designed to exclude them from political power. Non-discriminated excluded groups are also politically excluded from state power, but do not face overt political discrimination by the state. The central hypothesis we test is that non-discriminated excluded groups are less likely to engage in conflict with groups in power than those that face overt political discrimination. Groups that are politically excluded, but do not face overt discrimination by the state, are likely to have fewer grievances against the state (Gurr Citation1993).
In addition to testing for differences between discriminated and non-discriminated groups, we also examine the potential moderating effects of educational and economic inequalities, population disparities, and the share of ethnic elites. We predict that discriminated groups that are poorer or smaller relative to the ethnic group in power are less likely to engage in conflict. On the other hand, discriminated ethnic groups with less access to education and a larger share of elites will be more likely to engage in conflict. As Tilly (Citation1978) makes clear, the presence of grievances alone does not necessarily lead to conflict. Groups must not only be motivated to engage in conflict, but also must have the opportunity to do so.
To test our hypotheses, we use dyadic data on socioeconomic inequalities from the Ethnic Dyad Database (Alcorta, Smits, and Swedlund Citation2018), data on political access from the Ethnic Power Relations dataset (Vogt et al. Citation2015),Footnote2 and data on ethnic conflict incidence from the Uppsala Conflict Data Program Citation2018. Our dyadic database makes it possible to go beyond earlier research on the relationship between distance to power and conflict. We not only know which groups engaged in conflict as a result of political exclusion, but also between which groups these conflicts were fought. In total, our dataset includes 9,783 dyad year observations, incorporating 155 ethnic groups across 28 countries in sub-Saharan Africa.
Robust results from a multilevel regression model confirm our expectation that groups who face discrimination by the state that is designed to exclude them from political power are significantly more likely to be involved in conflict than groups who are excluded from power, but do not face explicit political discrimination. In addition, we find that several conditions moderate the relationship between political discrimination and conflict. In particular, discriminated groups who are poorer relative to the group(s) in power are less likely to engage in conflict, whilst discriminated groups that have a larger share of elites are more likely to be engaged in conflict.
This study contributes to the literature on political inequalities and ethnic conflict by providing more nuance to our understanding of when politically-excluded groups are more likely to engage in conflict. First, we differentiate between groups that face active and intentional discrimination by the state and groups that are ‘merely’ politically excluded, finding that it is discrimination that is largely driving the established relationship between political exclusion and conflict. Previous research has focused on political exclusion as the main causal mechanism (Buhaug, Cederman, and Rod Citation2008; Cederman, Gleditsch, and Buhaug Citation2013, Cederman, Wimmer, and Min Citation2010; Deiwiks, Cederman, and Gleditsch Citation2012). In contrast, in this article, the causal mechanism is political discrimination. Groups that are excluded but not actively discriminated against are less likely to engage in conflict than groups that are both excluded and discriminated against.
Second, by using a dyadic approach, we can measure not just distance to power, but which combinations of groups are more likely to lead to conflict. (Cederman, Gleditsch,and Buhaug Citation2013, Cederman, Wimmer, and Min 2010 importantly show that distance from power increases the likelihood that a group will engage in conflict. However, their data did not allow them to discern with which groups conflicts were fought, and empirically the state is considered a unitary actor instead of one that is composed of multiple power-sharing ethnic groups. In this article, we identify the ethnic identity of all groups involved in a conflict. For each dyadic pair of ethnic groups, we not only know both groups’ distance to power, but also numerous other relevant characteristics that may affect the risk of conflict between the two groups. This allows us to precisely identify the differences in conflict risk between all combinations of ethnic groups. Third, we examine how the relationship between political discrimination and conflict is influenced by characteristics of the groups and the situation in which they are living, using data at the ethnic-group and dyad level. In contrast to measuring how conflict-prone a group is based on its distance to power, this approach provides direct insight into the effects of relative deprivation, as well as further insights into when discrimination is likely to result in violence.
Political Inequality and Ethnic Conflict
There is a rich literature on the relationship between political inequalities and ethnic conflict. Political power provides groups with a channel through which to express their interests and address their grievances (Francois, Rainer, and Tebbi Citation2015). If groups are politically represented at the state level, they should be able to better exercise and defend their political rights, as well as influence the distribution of public goods and services (Cederman, Gleditsch, and Buhaug Citation2013). However, groups with political power may also be inclined to redistribute state wealth in a manner that is more favorable to their members (Burgesset al. Citation2015; Hodler and Raschky Citation2014). When some groups are politically excluded or have no access to state power, this difference in status may be perceived as unfairness in the political system (Vogt et al. Citation2015; Wimmer Citation2002). Systemic exclusion of groups from power likely limits their ability to sustain or improve their rights and entitlements, as well as the possibility to build political alliances. If exclusion occurs along ethnic lines, excluded groups may also perceive this to be an infringement on their right to self-determination (Horowitz Citation1985).
Given the relationship between political representation and access to goods and services, it not surprising that distance to power is associated with higher-levels of conflict (Cederman, Gleditsch,and Buhaug Citation2013, Cederman, Wimmer, and Min Citation2010; Wimmer, Cederman, and Min Citation2009). Under-representation in the police, military or government, or being blocked from access to state institutions, is associated with feelings of a collective injustice, increasing the likelihood of conflict (Stewart Citation2008; Wucherpfennig et al. Citation2012). Political exclusion and the absence of conventional paths to power may leave peripheral groups with little alternative than to challenge the ruling group(s) through violence (Buhaug, Cederman, Rod Citation2008; Deiwiks, Cederman, and Gleditsch Citation2012).
What, however, are the precise mechanisms linking political exclusion to the increased risk of conflict? Thus far, scholars have largely explained the association between political inequalities and ethnic conflict by suggesting that political exclusion fosters grievances, which in turn motivate ethnic groups to engage in conflict (i.e., Cederman, Gleditsch,and Buhaug Citation2013, Cederman, Wimmer, and Min Citation2010; Deiwiks, Cederman, and Gleditsch Citation2012). However, some forms of political exclusion may produce more grievances than others. For example, groups that represent a small proportion of the national population are often inherently marginalized in democratic processes, but this marginalization may not be overt or explicit. Geographic isolation or a nomadic lifestyle (i.e., the Himba in northern Namibia or the Tuareg across the Sahel) may also affect the ability, knowledge or desire of groups to be involved with the running of the state. Even groups who are socioeconomically relatively advantaged or represent a large share of the population may be politically excluded, if society is ethnically divided and the ruling party practices ethnic nepotism (Vanhanen Citation1999).
At the same time, although political exclusion may provide ethnic groups with the motivation to engage in conflict, it may also inhibit the opportunities of the disadvantaged group to form political alliances and to allocate state resources toward its members, reducing the group’s capacity to engage successfully in conflict (Esteban and Ray Citation2008; Tilly Citation1978). Research on the relationship between conflict and socioeconomic inequality suggests that horizontal inequalities can both encourage and discourage conflict – in other words they might generate motivations for conflict, but also limit the opportunities (Alcorta, Smits, and Swedlund Citation2018; Bara Citation2014; Besançon Citation2005). Similarly, when it comes to political inequalities, political exclusion may motivate groups to engage in conflict, but decrease opportunities to engage in violence.
Discrimination Versus Political Exclusion
In this article, we distinguish between two types of ethnic groups facing political exclusion by the state. Discriminated groups are directly targeted by the state with discriminatory policies designed to exclude them from political power. Non-discriminated groups are also excluded from state power, but do not face overt political discrimination by the state. Both kinds of groups face the opportunity constraint of having no political access, and therefore have limited political resources to mobilize for conflict. However, in addition to being excluded from political access, the discriminated groups are also subjected to repressive policies with the aim of depriving them of their political rights (Koos Citation2014). Our hypothesis is that:
H1: The likelihood of conflict incidence is higher when excluded ethnic groups face discrimination from ethnic groups in power.
According to Gurr (Citation1993), group-level grievances are likely to be the strongest when groups face political discrimination, defined as active and intentional discriminatory state policies designed to exclude them from political power (Vogt et al. Citation2015): i.e., black South Africans during the Apartheid regime; Tutsis before and Hutus after the genocide in Rwanda; and the Tuaregs in Mali and Niger. Political discrimination by the state is likely to deteriorate the affected group’s relations with groups in power, as members of the disadvantaged group may nurture grievances and attribute the discriminatory policies to those in power (Gurr Citation1993; Regan and Norton Citation2005). According to Buhaug, Cederman, and Gleditsch (Citation2014), the severity of this type of political exclusion might invoke an emotional response strong enough for affected groups to overcome the resulting power differentials (i.e., opportunity costs) and mobilize toward conflict.
That political repression is likely to induce strong grievances is well acknowledged (Regan and Norton Citation2005; Walter Citation2006). Nonetheless, empirically, discriminated and non-discriminated groups are often lumped into one category – even if the scholars distinguish between the two theoretically (i.e., Cederman, Weidmann,and Gleditsch et al. Citation2011; Deiwiks, Cederman, and Gleditsch Citation2012; Wimmer, Cederman, and Min Citation2009). Notably, a few studies (Cederman, Gleditsch,and Buhaug Citation2013, Cederman, Wimmer, and Min Citation2010) distinguish between six different kinds of groups in terms of distance to power – including non-discriminated and discriminated excluded groups – and find that more distance to power is associated with higher conflict risk. However, these studies focus on political exclusion, rather than discrimination, as the main causal variable. In addition, because of data limitations, they focus on ethnic conflict at the group level and solely against the state.
According to Gurr (Citation1993), it is political repression – not political exclusion – that is likely to induce the strongest grievances. We therefore predicted that groups facing political discrimination will be more likely to engage in conflict than groups that are political excluded, but not discriminated against. To give an example, in Ethiopia, both the Afar and the Beni-Shugal-Gumuz groups are politically excluded (Vogt et al. Citation2015). The Afar have limited access to political resources and have been historically subjected to discrimination by the state and by other groups (Yasin Citation2008). The Beni-Shugal-Gumuz are also excluded from political power, but they have not recently suffered from overt political discrimination. Although both groups are relatively similar in size, the Afar have been involved in more conflicts in the last thirty years than the Beni-Shugal-Gumuz (Allansson, Melander, and Themner Citation2017).
Moderators of the Effect of Political Discrimination
We expect that discriminated excluded groups are, on average, more likely to engage in conflict than non-discriminated excluded groups. However, political discrimination is not the only conflict risk factor to consider. Socio-economic inequalities, as well as the composition of the group, might also alter a group’s motivations and opportunities to engage in conflict. Accordingly, we test the moderation effect of four factors: differences in wealth, education, and population size, and the average share of elites within the group.
First, we predict that discriminated groups that are poorer relative to the ethnic group in power will be less likely to engage in conflict:
H2: Discriminated ethnic groups are less likely to engage in conflict, if they are poorer than the ethnic group in power.
Earlier research found a positive relationship between economic inequality and conflict (i.e., Cederman, Gleditsch, and Buhaug Citation2013, Cederman, Weidmann, and Gleditsch Citation2011; Regan and Norton Citation2005). However, these studies either measured economic inequalities and conflict on a national level, or compared the wealth level of the group to the national average. In practice, ethnic conflict occurs between two (or more) groups, and often at a subnational level. Therefore, more recently, scholars have studied this relationship dyadically, finding a negative relationship between economic inequality and conflict (Alcorta, Smits, and Swedlund Citation2018; Huber and Mayoral Citation2014). Although economically disadvantaged groups might have strong motivations to engage in conflict, they face high opportunity costs. Without sufficient organizational and material resources, aggrieved groups will be unable to rebel against the state (Gurr Citation1993; Tilly Citation1978). Poorer groups with less access to resources are less capable of financing conflict (Cederman Wimmer, and Min Citation2010).
Intergroup disparities in wealth can also affect the groups’ calculation of their own capabilities relative to other groups (Østby Citation2013). Discontent can be expected to be stronger for groups approaching economic parity, but suffering from political and educational inequalities (Besançon Citation2005). The independence movement in Catalonia, for example, illustrates how wealthy regions that have historically suffered from discriminatory policies may have strong incentives to mobilize collectively (Keating Citation2009). There is also some empirical evidence that politically-excluded groups who are economically relatively advantaged or who reside in oil-rich regions are more involved in conflict (Asalet al. Citation2016; Cederman, Gleditsch,and Buhaug Citation2013).
Second, we predict that discriminated groups that are smaller relative to the ethnic group in power will be less likely to engage in conflict:
H3: Discriminated ethnic groups are less likely to engage in conflict, if they are smaller than the ethnic group in power.
Differences in population are natural to multi-ethnic societies and, on their own, are not necessarily likely to be perceived as unjust. If an ethnic group represents only a small portion of a country’s population, having no access to political power could be considered a reflection of their relative size. In contrast, ethnic groups that constitute a larger proportion of the national population, but are excluded from the national political system, are more likely to perceive themselves as being unfairly treated and will have a larger potential resource pool from which to recruit (Cederman, Gleditsch, and Buhaug Citation2013, Cederman, Wimmer, and Min Citation2010). Groups who approach demographic parity with each other and who perceive themselves to be under threat, are found to be more likely involved in intergroup violence with each other, because both groups are able to compete for dominance (Balcells, Daniels, and Escribà-Folch. Citation2016):
Third, we predict that discriminated ethnic groups with lower levels of education relative to the group in power are more likely to engage in conflict:
H4: Discriminated ethnic groups are more likely to engage in conflict, if they are less educated than the ethnic group in power.
Education is a public good that most citizens in a country expect to have some level of access to, regardless of their background. More education decreases the chance of conflict by reducing grievances and stimulating economic development (Thyne Citation2006), increasing the cost of rebel recruitment (Collier and Hoeffler Citation2004), reducing the size of the recruitment pool (Barakat and Urdal Citation2009), and increasing the opportunity costs of young people to join a rebellion (Urdal Citation2006). However, when educational opportunities are distributed unequally between groups, education can also be a source of conflict (de Ferranti et al. Citation2004). Given the expectation of a fair provision of public services, inequalities in education are often considered fundamentally unjust. Groups that are educationally disadvantaged are found to have a higher tendency to engage in conflict (Alcorta, Smits, and Swedlund Citation2018; Østby Citation2008). For this reason, we predict that differences in education will strengthen the motivation of the discriminated group to engage in violence, increasing the risk of conflict.
Fourth, we predict that discriminated groups that have a larger share of elites are more likely to engage in conflict:
H5: Discriminated ethnic groups are more likely to engage in conflict, if the average share of elites in their group is larger.
A key element of within-group inequalities is the influence and motivation of elites (Besançon Citation2005; Fearon and Laitin Citation2000; Huber and Mayoral Citation2014; Wilkinson Citation2004).Footnote3 If the share of the group’s elite is large, this may amplify the group’s demands for an improved political/economic status and strengthen the ability of its elite to mobilize the group toward collective action (Besançon Citation2005). Particularly if groups are subjected to political discrimination, elites can play an important role in the buildup to conflict.Footnote4 When socioeconomic inequalities facilitate the mobilization of their constituencies, repression can lead ethnic elites to take up arms in order to force the state to listen to their demands (Cederman, Gleditsch, and Buhaug Citation2013; Lacina Citation2014). By blaming the plight of their ethnic community on other groups or by depicting other groups as a threat to their socioeconomic or political status, elites can mobilize their ethnic group toward collective action. Due to the risk involved in violent action, the masses must have reasons for following elites (Varshney Citation2003). This is easier to facilitate if the group faces repressive policies by the state (Langer Citation2005). The Ivory Coast is a good example of this – After the death of Houphouët-Boigny in 1993, the state imposed policies favoring the ethnicity of the ruling elite and excluding northern groups from the government and the military. This overt political discrimination, together with the presence of socioeconomic horizontal inequalities and latent ethnic tensions between the north and the south, encouraged northern elites from different groups to unite in opposition to the state and ultimately led to a coup d’état in 1999 (Langer Citation2005).
Research Design and Approach
Data Sources
To test our hypotheses, we use data from the Ethnic Dyad Database (Alcorta, Smits, and Swedlund et al. Citation2018). The EDD contains annual data for 155 ethnic groups living in 28 sub-Saharan Africa for the period 1990–2013 and is based on datasets from 73 Demographic and Health Surveys (DHS), derived from the Global Data Lab (www.globaldatalab.org). DHS are large, nationally representative household surveys that collect data on socioeconomic, demographic, and health-related issues through oral interviews. Response rates are usually very high (in most cases above 90%). Ethnic identity was measured by asking respondents for their ethnic group or tribe. Respondents could select from several predefined categories or specify their own, if they classify as another. On the basis of the ethnic identity information, data from the surveys was aggregated to the ethnic group level. When ethnic groups in the survey were very small in size (less than 1% of the sample population), groups were integrated into larger clusters from the same ethno-linguistic family. The ethnic group cluster to which groups belonged to was identified with the help of a variety of sources (Joshua Project Citation2016; Olson Citation1996; Simons and Fennig Citation2017). Very small groups that could not be combined into larger categories were left out of the analysis.
The aggregated information at the ethnic-group level from the different surveys was combined into an ethnic-group panel dataset with annual observations from 1990 to 2013. Since the dataset was based on DHS data, observations were only available for years in which DHS surveys were conducted within the countries (for the complete list of included surveys see Supplementary Table 1 in the online appendix). The values of the closest survey prior to the year of observation were utilized for years in which no dataset was available. When the year of observation came before the earliest available survey, the values of the earliest survey were extrapolated.
The socioeconomic data in the EDD was merged together with annual political access data from the Ethnic Power Relations (EPR) dataset (Vogt et al. Citation2015). The EPR dataset identifies politically-relevant groups and includes annual data on their access to power on the national level by coding to what extent representatives of ethnic groups held executive-level state power. The variable ranges on a scale from overt political discrimination (1) to total control of the government (6). Within each country, every dyadic combination of ethnic group was generated, for a total of 9,783 ethnic dyad year observations. This approach allows the socioeconomic and political features of ethnic groups within pairs to be compared. For the main variables, both the average of the groups in the dyad and the difference between the groups are included in the analysis.
Data on ethnic conflict incidence was derived from the Uppsala Conflict Data Program (UCDP), of which we identified the ethnic conflicts within the UCDP Dyadic Dataset (Allansson, Melander, and Themner Citation2017), the UCDP Non-State Conflict Dataset (Sundberg, Eck, and Kreutz Citation2012) and the UCDP One-Sided Violence Dataset (Eck and Hultman Citation2007). Conflict observations were coded as ethnic if the actors are organized along ethnic lines. Similarly to Buhaug, Cederman, and Rod et al. (Citation2008), we do not claim that these conflicts were specifically concerned with issues of ethnicity or national self-determination. The ethnic affiliation(s) of actors involved in each conflict was coded based on the ethnicity of their leaders and the major ethnic groups recruited in the army or represented by the actors. Each conflict observation was matched to the dyad for the ethnic groups involved. In cases where more than two ethnic groups were engaged in conflict, a conflict observation was recorded in all of the corresponding dyads.
The UCDP datasets include information on conflicts with at least 25 deaths in that year. From the period 1990 to 2013, we identified 375 intrastate conflict incidence observations in sub-Saharan African countries. These consist of conflicts between insurgents and the government, conflicts between actors where the government is not involved, and violence perpetrated against civilians by insurgents or the government. We focus on the period between 1990 and 2013 because of the availability of reliable group-level data. Furthermore, by opting to leave out conflicts that occurred before 1990, we exclude conflicts associated with the Cold War.
Research Design
To test our hypotheses, multilevel logistic regression analysis was performed with ethnic conflict incidence as the dependent variable. To control for clustering of the dyads within countries and for the repeated measurement of dyads over time, multilevel versions of the logistic regression model were used. The models were estimated with Stata Xtmelogit.
Ethnic conflict incidence was measured by a dummy variable indicating whether (1) or not (0) a violent conflict occurred within a specific dyad in a given year.Footnote5 Ethnic groups were recorded as participants in conflicts, when they were prevalent in the UCDP conflict description. Conflict observations were linked to the dyad of the ethnic groups involved in the fighting. Cases with the involvement of foreign groups or intra-ethnic conflicts (both groups from the same cluster) were excluded from the analysis. Of the 28 countries in this research, only five did not contain cases of intrastate ethnic conflict: Benin, Gabon, Malawi, Namibia, and Zambia.
Table 1. Descriptive statistics summary table.
The variable political inequality derived from the Ethnic Power Relations (EPR) dataset measures the level of access to state power of an ethnic group through their political representation at the central regime level. It has three main categories: ‘excluded from power’, ‘power-sharing’, or ‘dominant’. The excluded from power category consists of two kinds of groups, those that are only excluded from power and those that besides being excluded from power are also politically discriminated, with discriminated meaning intentionally and directly targeted by the state through repressive policies. The focus of our analysis is on the difference between these two excluded groups, which we refer to as discriminated and non-discriminated, in regards to risk of conflict with groups in power. To create the category ‘in power’, we combined the categories of power-sharing and dominant groups. Theoretically, this makes sense, as our interest is in how political discrimination by the state – represented by either a coalition or a single group – affects the propensity for conflict.
As socioeconomic factors at the ethnic-dyad level, we include within dyad differences in characteristics of the groups and the average values of those characteristics for the dyad. The characteristics are: economic wealth, group size, education level, and elite share. Because the average values are included, the differences indicate the inequalities specifically in the characteristics within the dyad (compare Alcorta, Smits, and Swedlund Citation2018). To measure the economic wealth level of the groups, the average score on the International Wealth Index (IWI) of households belonging to the groups is taken. IWI measures economic welfare and access to resources according to a weighted combination of the household’s possession of consumer durables, housing characteristics, and access to public utilities (Smits and Steendijk Citation2015). IWI ranges from 0 to 100, where 0 represents households without assets and with public/housing utilities of the poorest quality, and 100 represents households with all assets recorded in the survey and with public/housing utilities of the highest quality. The size of an ethnic group is determined by calculating the share of people in the group relative to the total population of the country. The education level of a group is represented by the average number of years of schooling received by respondents in the group that are within the 20–49 age category. The share of the group’s elites was measured by the group’s share of employed men aged 20–49 with higher occupations, such as technical, professional, and managerial positions. The degree of remoteness of the region where the group is concentrated is measured through the proportion of its members living in urbanized versus rural areas. The difference in this variable between two groups is expected to reflect the level of exposure between them.
Rule of law at the national level is included as control factor. This variable indicates to what extent people confide in and abide by the rules of society in which they live. In particular, it reflects their views on the police, the courts, the quality of property rights, and contract enforcement, as well as on the likelihood of crime and violence occurring. The variable is derived from the World Governance Indicators (WGIs) and uses a scale that runs from −2.5 to 2.5 (Kaufmann, Kraay, and Mastruzzi Citation2011). WGIs are only recorded from 1996 until 2002 on a bi-annual basis and since then yearly. Values for the period 1990–1995 are linearly extrapolated from 1996. Values for the missing years after 1996 are linearly interpolated from the bi-annual observations.
To control for earlier conflicts within the dyad, four dummy variables are used to indicate whether (1) or not (0) there was a conflict in the four years preceding the year of measurement. By controlling for prior conflict, we separate the indicators leading to conflict incidence from circumstances that may arise during an existing conflict. We include four of these dummies, as the dummy for conflict five years preceding the focus year was found to be insignificant. We also include a dummy indicating the observations for which the data is extrapolated from surveys taken later than the observation year. Allison’s (Citation2001) dummy variable adjustment procedure is used to address any values that were missing for education levels and share of elites. We tested for the possibility of nonlinear relationships by including quadratic terms for all interval-level variables in the models, but no indication of nonlinearity was found. We also tested for multicollinearity by computing the Variance Inflation Factor (VIF) statistic for all independent variables. The highest VIF value was 4.5, which is substantially below the critical threshold of 10, indicating that there is no multicollinearity in the data.
Modeling Strategy
We first estimate multilevel models for each independent and control variable to examine their bivariate relationship with ethnic conflict. In the bivariate analysis of the control variables, the difference and the mean variables are both incorporated within the model, as the two components are strongly linked with each other. We also include the controls for prior conflict.
Our multivariate analysis consists of four major steps. We first apply a simple division between groups that are excluded from power and groups that are in power (Model 1). This allows us to distinguish the effects for three categories of dyads: (1) excluded/in-power, (2) excluded/excluded, and (3) in-power/in-power. For each of these categories, a dummy variable was prepared. The aim of this step is to analyze in more detail the finding that excluded ethnic groups have a higher chance of conflict (Cederman, Gleditsch, and Buhaug Citation2013, Cederman, Wimmer, and Min Citation2010). In this analysis, the category excluded/in-power is taken as the reference category.
In the second step, we split the excluded group into discriminated and non-discriminated groups (Model 2). The result is six categories of dyads: (1) discriminated/in-power, (2) non-discriminated/in-power, (3) discriminated/discriminated, (4) non-discriminated/non-discriminated, (5) discriminated/non-discriminated, and (6) in-power/in-power. Again, for each of the categories a dummy variable was prepared. Taking the discriminated excluded groups as reference category, we then tested whether splitting up the excluded group into discriminated and non-discriminated leads to a better explanation of the variation in conflict incidence.
Given that this indeed turns out to be the case, in the third step (Model 3), we simplify the model by replacing the six-category variable used in step two with a two-category dummy variable that compares the combination discriminated/in-power with all other dyadic combinations taken together. As the omnibus test indicates that this model has essentially the same fit as Model 2, Model 3 is then taken as starting point for our interaction analysis. In Model 4, we analyze whether the heightened conflict risk of the discriminated/in-power combination is moderated by the characteristics of groups and the circumstances under which they live. For consistency, centered versions of the variables that make up the interaction coefficients are used throughout all models.
Findings and Results
provides a summary of the descriptive statistics. In our dataset, ethnic conflict occurs within 3.8% of the country-year observations. Dyads pairing excluded groups with groups in power account for 23.2% of the observations. Disaggregating this category, dyads pairing discriminated groups with groups in power represent 8.1% of the observations, whilst dyads pairing non-discriminated groups versus groups in power correspond to 15.2% of the total observations. On average, ethnic groups have 5 years of schooling, while educational inequalities within dyads average 1.6 years. Across the sample, the mean wealth level is 25.4 on the IWI scale, which ranges from 0 to 100. The difference in wealth between groups is, on average, 8.8 points on the same scale. On average, 9.6% of a group’s population belongs to its elite, and the difference in the proportion of elite within the dyads is 5.1%. Both average group size and population differences within the dyads average 10.5% of the total population. On average, 34.1% of the group’s populations live in urban areas and the differences in urbanization within the dyads average 16.9%. National values for the rule of law average −0.6 and range from −2.1 to 0.3.
Coefficients for the bivariate relationships are presented in , and coefficients for the multivariate relationships in . The coefficients are displayed as odds ratios, because these are easier to interpret than logit coefficients. The number of dyad observations included in the analysis is 9,783 and the number of conflict-year observations is 375. In and , the separate levels of political access are represented by dummy variables for the group combinations. In accordance with the political exclusion literature, the bivariate coefficient for dyads pairing excluded and in power groups shows a strongly significant and positive correlation to conflict, indicating that this dyadic combination is 2.3 times more likely than other combinations to result in ethnic conflict. In the bivariate analysis with the subcategories of excluded groups split up, however, the coefficients demonstrate that most of the weight of the impact of political exclusion on conflict risk is carried by the strong effect of dyads with discriminated and in-power groups (3.5 times more conflict-prone than other dyads). Dyads combining non-discriminated excluded groups and groups in power are not significantly more associated with conflict than the other combinations. Of the control factors that are significant, educational inequalities and occurrence of prior conflict are positively associated with conflict, whereas average education and rule of law show negative associations.
Table 2. Multilevel logistic regression coefficients for bivariate associations between selected independent variables and ethnic conflict incidence in sub-Saharan African countries 1990–2013.
Table 3. Multilevel logistic regression coefficients for multivariate associations between selected independent variables and ethnic conflict incidence in sub-Saharan African countries, 1990–2013.
Model 1 in compares different combinations of the political inequality variable within the dyads based on a simple division between groups that are in power and groups that are excluded from power. We see that, compared to the excluded/in-power combination (the reference category), the two other combinations have lower odds of engaging in conflict, but that the difference is only statistically significant for the combination in which both groups are in power. Dyads with groups who are both in power are 55% less likely to engage in conflict than dyads where one group is in power and the other is excluded from power.
In Model 2, we test whether splitting up the excluded groups into discriminated and non-discriminated leads to a better explanation of the variation in conflict incidence. This indeed turns out to be the case. We observe that, in comparison with the combination of discriminated excluded groups versus groups in power (the reference category), all other dyadic combinations of ethnic groups have lower conflict risk. For all but one combination (two discriminated groups), the coefficients are significant and substantial. Most notably, dyads of non-discriminated excluded groups versus in power groups are 60% less conflict prone than dyads of discriminated and in-power groups. Hence, in accordance with Hypothesis 1, it appears that it is the discriminated groups that are driving the relationship between political exclusion and conflict.
In Model 3, we simplify the model and isolate the effect of the discriminated/in-power combination on conflict. Given that Model 3 has a Chi2 value that is hardly different from that of Model 2 but uses four degrees of freedom less, Model 3 seems preferable over Model 2. In Model 3, the coefficient of the dummy variable for the combination discriminated/in-power is highly significant and has a 3.22 times higher odds of conflict than all other possible dyads combined.
To find out whether the heightened risk of conflict between discriminated groups and groups in power is related to group characteristics or circumstances, we then performed an interaction analysis with educational, economic and population inequalities, as well as the average share of elites. In Model 4 these interaction coefficients are jointly included. The interaction effects with wealth inequalities between the groups and with the combined elite share of the groups were found to be significant. The interaction coefficient for wealth inequalities indicates that – in line with hypothesis 3 – the risk of conflict between discriminated excluded groups and groups in power is significantly reduced, if wealth inequalities between the groups are higher. In line with hypothesis 5, the interaction coefficient for average elite share shows that conflict risk for the discriminated/in-power combination increases significantly when the average share of elites in the dyad is larger.
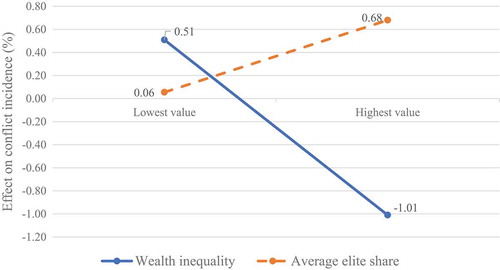
In both interaction effects are depicted graphically. For reasons of comparability and clarity, the coefficients are based on standardized versions of the variables and logit (logarithmic) coefficients are used. The figure shows that the effect of wealth inequalities on conflict risk is initially positive for small differences, but decreases substantially as wealth inequalities increase. Regarding average elite share within the dyads, conflict risk is negligible when elite share is at its minimum, and increases to some extent when the share of elites becomes larger. The other interaction coefficients are not significant, hence no evidence is found that differences population size (hypothesis 3) or in access to education (hypothesis 4) moderate the heightened conflict risk of the discriminated/in-power combination.
Figure 1. Interaction effects of wealth inequality and average elite share on the risk of conflict between discriminated and in-power groups (based on standardized logit coefficients).
Regarding the effects of the control factors in our models, shows that educational inequalities between groups, average group size, and average elite share of groups are significantly and positively associated to conflict, whilst the effects of rule of law is significantly negative. The controls for conflict in preceding years are all significant, stressing the importance of prior conflict as a determinant of current conflict. No significant effects of average education, wealth, and urbanization, nor of wealth, population, elite share, and urbanization inequality are found.
Discussion
In this paper, we sought to determine whether political exclusion due to discriminatory policies by the state provides a stronger incentive to engage in conflict than political exclusion alone. To accomplish this, we differentiated between politically-excluded ethnic groups that were overtly politically discriminated against by the state and those that were ‘merely’ excluded. We conducted dyadic analyses, comparing combinations of discriminated and non-discriminated excluded groups with groups in power to determine the likelihood of them being involved in conflict.
Our findings go beyond previous research by showing that it is not just that politically-excluded groups are more often associated with conflict than non-excluded groups (Cederman, Gleditsch, and Buhaug Citation2013, Cederman, Wimmer, and Min Citation2010), but that it is the specific combination of an excluded group with a group in power that has the highest risk of conflict. Moreover, when we subdivided excluded groups into groups that are politically discriminated and groups that are not politically discriminated, it becomes apparent that it is the discriminated groups that predominantly drive this effect. Dyads combining groups in power with excluded groups suffering from discrimination by the state were significantly more prone to ethnic conflict than dyads combining groups in power with excluded groups that were not discriminated.
This finding supports the argument that discrimination by the state is a critical factor driving politically-excluded ethnic groups toward conflict (Gurr Citation1993; Walter Citation2006). When exclusion is a result of politically discriminatory or repressive policies, group grievances may be severe enough to outweigh limited opportunities and spur the group on toward conflict (Brockett Citation2005).
We also find that economic inequalities and the average share of elites within the groups have significant moderating effects on the likelihood of discriminated groups engaging in conflict. The risk of conflict between discriminated groups and groups in power decreases as wealth inequalities between the groups become larger. On the other hand, this risk increases if the share of elite positions occupied by members of both groups is larger. The direction of the first interaction suggests that some inequalities between the groups may offset the effect of discrimination on conflict risk. Discriminated groups subjected to economic constraints relative to groups in power may not have the financial resources or organizational capacity to mount a rebellion against those in power (Tilly Citation1978). Economic inequalities, therefore, reinforce coercive control of groups in power over discriminated groups (Gurr Citation1993).
The positive association between elite size and conflict outbreak highlights the pivotal role of ethnic entrepreneurs in a volatile political environment. In their jostle for dominance, elites seeking to advance their own interests can become an aggravating factor in the buildup to ethnic conflict. They might exploit their influence in their community through indoctrination or by providing financial incentives (Varshney Citation2003). This role may be more critical when groups are discriminated against, as a stronger resentment toward the state makes it more feasible for elites to blame groups in power for the predicament of their community.
There are a couple of limitations to the study that should be considered when reflecting upon our findings. First, the dyadic approach means we cannot isolate the group within the dyad that initiated the fighting. Hence, we can observe the presence and size of inequalities, but it is not possible to draw conclusions regarding which of the groups is responsible for the conflict outbreak (Neumayer and Plümper. Citation2010). Second, the dyadic analysis lacks the possibility to include intragroup (vertical) inequalities, which are important, as they may influence the cohesiveness of the groups or their ability to sustain a conflict (Huber and Mayoral Citation2014; Kuhn and Weidmann Citation2015). Third, the data does not capture all the potential ethnic group conflicts during the period examined. In order to be able to run our analyses, sometimes ethnic groups had to be combined into larger ethnic clusters, because smaller ethnic groups were not consistent represented in the data across survey years (Nigeria for example has 400 ethnic groups). This means that we could not include conflicts between groups belonging to the same larger ethnic cluster. However, given the large number of ethnic groups distinguished in our database, the vast majority of ethnic conflicts in the study period (88%) were included and information loss is relatively small.
Conclusion
In this study, we reexamined the relationship between political exclusion and conflict by differentiating between groups who face active discriminatory policies by the state from groups that are politically excluded, but do not face political discrimination. We also explored how group characteristics and their environment influence the relationship between political discrimination and conflict. To make this possible, we drew on an Ethnic Dyad Database (EDD), containing 9,783 dyad year observations for 155 ethnic groups in 28 sub-Saharan African countries.
We find that the effect of political exclusion alone is not a sufficient predictor of conflict outbreak. Conflict turned out to be most closely linked to dyads with discriminated groups and groups in power. That is, it is discrimination that seems to be driving the established relationship between political exclusion and violence. Furthermore, interaction analysis revealed that discriminated groups were less inclined to engage in conflict with groups in power when there were larger economic differences between them. At the same time, conflicts between these kinds of groups turned out to be more frequent when the combined share of elites within the groups was larger.
Political inequalities represent a complex combination of incentives and opportunities that, to a certain extent, can counterbalance each other. We postulate that the motivation for conflict generated by discriminatory policies against politically-excluded groups may outweigh the limited opportunities these groups have to engage in conflict. Incentives for using violence can be further inflamed by elites who wield influence over other members of their group and may collectively mobilize them in pursuit of their own interests. However, these incentives are unlikely to be enough to lead ethnic groups into conflict, if they face additional economic constraints relative to the group in power.
The findings of this study may offer useful insights for policymakers. The decline of ethnic conflict has been explained by the recent trend of ethnic groups achieving better political access (Cederman, Gleditsch, and Wucherpfennig Citation2017). Although this is a positive development, our research suggests that policies aimed specifically at conflict prevention might be more effective if they focus on reducing discriminatory state practices and curbing the role of ethnic elites. Our results indicate that it is not political exclusion that drives violence, but rather active political discrimination.
Supplemental Material
Download Zip (23.1 KB)Supplementary material
Supplemental data for this article can be accessed on the publisher’s website.
Notes
1 A notable exception is Buhaug, Cederman, and Gleditsch (Citation2014), who compare the largest discriminated group with the group in power. Two other studies (Cederman, Gleditsch, and Buhaug Citation2013, Cederman Wimmer, and Min Citation2010) differentiate between these two categories in preliminary analyses, but not when testing their hypotheses.
2 In the EPR dataset ‘non-discriminated‘ excluded groups are referred to as ‘powerless’ (Vogt et al. Citation2015). We opt to use the term non-discriminated in order to make clear that active discrimination by the state is the key difference between the two groups.
3 Daloz (Citation2010) defines an elite as a selected and small group of citizens that controls a large amount of wealth and power.
4 For this reason, Goldstoneet al. (Citation2010) argue that models examining elite relationships will have greater predictive power for conflict onset than those focused on economic resources.
5 We use the term conflict incidence rather than onset, because we observe the chance that a conflict takes place for every year of its duration, rather than only the first year. Studies have shown that this different interpretation does not have a major effect on findings (Esteban, Mayoral, and Ray Citation2012). As a robustness test, we have repeated the analysis in Model 3 in with only the first year of each conflict included and the repeated conflict observations removed. Supplementary Table 2 (available in the online appendix) shows that some coefficients lose significance, as there are fewer conflict observations. However, the main effect of the political discrimination variable remains intact.
References
- Alcorta, Ludovico, Jeroen Smits, and Haley J. Swedlund. 2018. “Inequality and Ethnic Conflict in Sub-Saharan Africa.” Social Forces 97 (2): 769–92. doi:10.1093/sf/soy049.
- Allansson, Marie, Erik Melander, and Lotta Themnér. 2017. “Organized Violence 1989–2016.” Journal of Peace Research 54 (4): 574–87. doi:10.1177/0022343317718773.
- Allison, Paul D. 2001. Missing Data. London: Sage Publications.
- Asal, Victor, Michael Findley, James A. Piazza, and James I. Walsh. 2016. “Political Exclusion, Oil, and Ethnic Armed Conflict.” Journal of Conflict Resolution 60 (8): 1343–67. doi:10.1177/0022002714567948.
- Balcells, Laia, Lesley-Ann Daniels, and Abel Escribà-Folch. 2016. “The Determinants of Low-intensity Intergroup Violence: The Case of Northern Ireland.” Journal of Peace Research 53 (1): 33–48. doi:10.1177/0022343315610399.
- Barakat, Bilal, and Henrik Urdal. 2009. “Breaking the Waves? Does Education Mediate the Relationship between Youth Bulges and Political Violence?” Policy Research working paper, no. WPS 5114. Washington DC: The World Bank.
- Bara, Corinne. 2014. “Incentives and opportunities: A complexity-oriented explanation of violent ethnic conflict.” Journal of Peace Research 51 (6): 696–710. doi:0022343314534458.
- Besançon, Marie L. 2005. “Relative Resources: Inequality in Ethnic Wars, Revolutions, and Genocides.” Journal of Peace Research 42 (4): 393–415. doi:10.1177/0022343305054086.
- Brockett, Charles, D. 2005. Political Movements and Violence in Central America. New York, NY: Cambridge University Press.
- Buhaug, Halvard, Lars-Erik Cederman, and Kristian S. Gleditsch. 2014. “Square Pegs in Round Holes: Inequalities, Grievances, and Civil War.” International Studies Quarterly 58 (2): 418–31. doi:10.1111/isqu.12068.
- Buhaug, Halvard, Lars-Erik Cederman, and Jan K. Rød. 2008. “Disaggregating Ethno-Nationalist Civil Wars: A Dyadic Test of Exclusion Theory.” International Organization 62 (3): 531–51. doi:10.1017/S0020818308080181.
- Burgess, Robin, Remi Jedwab, Edward Miguel, Ameet Morjaria, and Gerard Padró i Miquel. 2015. “The Value of Democracy: Evidence from Road Building in Kenya.” American Economic Review 105 (6): 1817–51. doi:10.1257/aer.20131031.
- Cederman, Lars-Erik, Kristian S. Gleditsch, and Halvard Buhaug. 2013. Inequality, Grievances, and Civil War. New York: Cambridge University Press.
- Cederman, Lars-Erik, Kristian S. Gleditsch, and Julian Wucherpfennig. 2017. “Predicting the Decline of Ethnic Civil War: Was Gurr Right and for the Right Reasons?” Journal of Peace Research 54 (2): 262–74. doi:10.1177/0022343316684191.
- Cederman, Lars-Erik, Nils B. Weidmann, and Kristian S. Gleditsch. 2011. “Horizontal Inequalities and Ethnonationalist Civil War: A Global Comparison.” American Political Science Review 105 (3): 478–95. doi:10.1017/S0003055411000207.
- Cederman, Lars-Erik, Andreas Wimmer, and Brian Min. 2010. “Why Do Ethnic Groups Rebel? New Data and Analysis.” World Politics 62 (1): 87–119. doi:10.1017/S0043887109990219.
- Collier, Paul, and Anke Hoeffler. 2004. “Greed and Grievance in Civil War.” Oxford Economic Papers 56 (4): 563–95. doi:10.1093/oep/gpf064.
- Daloz, Jean-Pascal. 2010. The Sociology of Elite Distinction: From Theoretical to Comparative Perspectives. Basingstoke: Palgrave Macmillan.
- de Ferranti, David, Guillermo E. Perry, Francisco H.G. Ferreira, and Michael Walton. 2004. “Inequality in Latin America: Breaking with History?” World Bank Latin American and Caribbean Studies, Washington, DC: World Bank.
- Deiwiks, Christa, Lars-Erik Cederman, and Kristian S. Gleditsch. 2012. “Inequality and Conflict in Federations.” Journal of Peace Research 49 (2): 285–304. doi:10.1177/0022343311431754.
- Eck, Kristine, and Lisa Hultman. 2007. “Violence against Civilians in War.” Journal of Peace Research 44 (2): 233–46. doi:10.1177/0022343307075124.
- Esteban, Joan, Laura Mayoral, and Debraj Ray. 2012. “Ethnicity and Conflict: Theory and Facts.” Science 336 (6083): 858–65. doi:10.1126/science.1222240.
- Esteban, Joan, and Debraj Ray. 2008. “On the Salience of Ethnic Conflict.” American Economic Review 98 (5): 2185–202. doi:10.1257/aer.98.5.2185.
- Fearon, James D., and David D. Laitin. 2000. “Violence and the Social Construction of Ethnic Identity.” International Organization 54 (4): 845–77. doi:10.1162/002081800551398.
- Francois, Patrick, Ilia Rainer, and Francesco Tebbi. 2015. “How Is Power Shared in Africa?” Econometrica 83 (2): 465–503. doi:10.3982/ECTA11237.
- Goldstone, Jack A., Robert H. Bates, David L. Epstein, Ted R. Gurr, Michael B. Lustik, Monty G. Marshall, Jay Ulfelder, and Mark Woodward. 2010. “A Global Model for Forecasting Political Instability.” American Journal of Political Science 54 (1): 190–208. doi:10.1111/j.1540-5907.2009.00426.x.
- Gurr, Ted R. 1993. “Why Minorities Rebel: A Global Analysis of Communal Mobilization and Conflict since 1945.” International Political Science Review/Revue Internationale De Science Politique 14 (2): 161–201. doi:10.1177/019251219301400203.
- Hodler, Roland, and Paul Raschky. 2014. “Regional Favoritism.” The Quarterly Journal of Economics 129 (2): 995–1033.
- Horowitz, Donald L. 1985. Ethnic Groups in Conflict. Berkeley: University of California Press.
- Huber, John D., and Laura Mayoral. 2014. “Inequality, Ethnicity and Civil Conflict.” Barcelona Graduate School of Economics Working Paper Series no. 744.
- Joshua Project. 2016. Joshua Project. [online] Joshuaproject.net. https://joshuaproject.net.
- Kaufmann, Daniel, Aart Kraay, and Massimo Mastruzzi. 2011. “The Worldwide Governance Indicators: Methodology and Analytical Issues.” Hague Journal on the Rule of Law 3 (2): 220–46. doi:10.1017/S1876404511200046.
- Keating, Michael. 2009. “Social Citizenship, Solidarity and Welfare in Regionalized and Plurinational States.” Citizenship Studies 13 (5): 501–13. doi:10.1080/13621020903174654.
- Koos, Carlo. 2014. “Why and How Civil Defense Militias Emerge: The Case of the Arrow Boys in South Sudan.” Studies in Conflict & Terrorism 37 (12): 1039–57. doi:10.1080/1057610X.2014.962439.
- Kuhn, Patrick M., and Nils B. Weidmann. 2015. “Unequal we fight: Between- and Within-Group Inequality and Ethnic Civil War.” Political Science and Research Methods 3 (3): 543–568.
- Lacina, Bethany. 2014. “How Governments Shape the Risk of Civil Violence: India’s Federal Reorganization 1950–56.” American Journal of Political Science 58 (3): 720–38. doi:10.1111/ajps.2014.58.issue-3.
- Langer, Arnim. 2005. “Horizontal Inequalities and Violent Group Mobilisation in Côte d’Ivoire.” Oxford Development Studies 33 (1): 25–45. doi:10.1080/13600810500099634.
- Neumayer, Eric, and Thomas Plümper. 2010. “Spatial Effects in Dyadic Data.” International Organization 64 (1): 145–66. doi:10.1017/S0020818309990191.
- Olson, James S. 1996. The Peoples of Africa: An Ethnohistorical Dictionary. Westport,: Greenwood Press.
- Østby, Gudrun. 2008. “Polarization, Horizontal Inequalities and Violent Civil Conflict.” Journal of Peace Research 45 (2): 143–62. doi:10.1177/0022343307087169.
- Østby, Gudrun. 2013. “Inequality and Political Violence: A Review of the Literature.” International Area Studies Review 16 (2): 206–31. doi:10.1177/2233865913490937.
- Regan, Patrick M., and Daniel Norton. 2005. “Greed, Grievance, and Mobilization in Civil Wars.” Journal of Conflict Resolution 49 (3): 319–36. doi:10.1177/0022002704273441.
- Simons, Gary F., and Charles D. Fennig, Eds. 2017. Ethnologue: Languages of the World, Twentieth Edition. Dallas: SIL International. http://www.ethnologue.com.
- Smits, Jeroen, and Roel Steendijk. 2015. “The International Wealth Index (IWI).” Social Indicators Research: an International and Interdisciplinary Journal for Quality-of-Life Measurement 122 (1): 65–85. doi:10.1007/s11205-014-0683-x.
- Stewart, Frances, ed. 2008. Horizontal Inequalities and Conflict: Understanding Group Violence in Multiethnic Societies. Basingstoke: Palgrave MacMillan.
- Sundberg, Ralph, Kristine Eck, and Joakim Kreutz. 2012. “Introducing the UCDP Non-State Conflict Dataset.” Journal of Peace Research 49 (2): 351–62. doi:10.1177/0022343311431598.
- Thyne, Clayton. 2006. “ABC’s, 123’s, and the Golden Rule: The Pacifying Effect of Education on Civil War 1980–1999.” International Studies Quarterly 50 (4): 733–54. doi:10.1111/j.1468-2478.2006.00423.x.
- Tilly, Charles. 1978. From Mobilization to Revolution. Reading, MA: Addison-Wesley.
- Uppsala Conflict Data Program. 2018. UCDP Conflict Encyclopedia. Uppsala University, Department of Peace and Conflict Research. Accessed 23 April, 2017. www.ucdp.uu.se.
- Urdal, Henrik. 2006. “A Clash of Generations? Youth Bulges and Political Violence.” International Studies Quarterly 50 (3): 607–30. doi:10.1111/j.1468-2478.2006.00416.x.
- Vanhanen, Tatu. 1999. “Domestic Ethnic Conflict and Ethnic Nepotism: A Comparative Analysis.” Journal of Peace Research 36 (1): 55–73. doi:10.1177/0022343399036001004.
- Varshney, Ashutosh. 2003. Ethnic Conflict and Civic Life: Hindus and Muslims in India. New Haven: Yale University Press.
- Vogt, Manuel, Nils-Christian Bormann, Seraina Rüegger, Lars-Erik Cederman, Philipp Hunziker, and Luc Girardin. 2015. “Integrating Data on Ethnicity, Geography, and Conflict: The Ethnic Power Relations Dataset Family.” Journal of Conflict Resolution 59 (7): 1327–42. doi:10.1177/0022002715591215.
- Walter, Barbara F. 2006. “Information, Uncertainty, and the Decision to Secede.” International Organization 60 (1): 105–35. doi:10.1017/S0020818306060048.
- Wilkinson, Steven I. 2004. Votes and Violence: Electoral Competition and Ethnic Riots in India. Cambridge: Cambridge University Press.
- Wimmer, Andreas. 2002. Nationalist Exclusion and Ethnic Conflict: Shadows of Modernity. Cambridge: Cambridge University Press.
- Wimmer, Andreas, Lars-Erik Cederman, and Brian Min. 2009. “Ethnic Politics and Armed Conflict: A Configurational Analysis of A New Global Data Set.” American Sociological Review 74 (2): 316–37. doi:10.1177/000312240907400208.
- Wucherpfennig, Julian, Nils Metternich, Lars-Erik Cederman, and Kristian S. Gleditsch. 2012. “Ethnicity, the State, and the Duration of Civil Wars.” World Politics 64 (1): 79–115. doi:10.1017/S004388711100030X.
- Yasin, Yasin M. 2008. “Political History of the Afar in Ethiopia and Eritrea.” Afrika Spektrum 43 (1):39–65.